
|
市場調査レポート
商品コード
1698604
ドライブインムービーシアター市場の機会、成長促進要因、産業動向分析、2025年~2034年の予測Drive in Movie Theater Market Opportunity, Growth Drivers, Industry Trend Analysis, and Forecast 2025-2034 |
||||||
カスタマイズ可能
|
|||||||
| ドライブインムービーシアター市場の機会、成長促進要因、産業動向分析、2025年~2034年の予測 |
|
出版日: 2025年02月14日
発行: Global Market Insights Inc.
ページ情報: 英文 190 Pages
納期: 2~3営業日
|

全表示
- 概要
- 目次
世界のドライブインムービーシアター市場は2024年に53億米ドルに達し、2025年から2034年にかけてCAGR6.6%で成長すると予測されています。
この市場は、若年層と中年層の両方がユニークな屋外映画体験にますます惹かれているため、復活を経験しています。中高年の消費者はドライブインのノスタルジックな雰囲気に惹かれることが多いが、若い観客はイベントの社交性や地域社会に焦点を当てた側面に魅力を感じています。ドライブインシアターの人気は、社会的に距離のある娯楽を求める人々の間でCOVID-19が大流行した時期に急上昇し、その動向は今も続いています。成長を促す主な要因としては、可処分所得の増加、自動車所有率の上昇、映写システムやモバイル・チケッティングの技術進歩などが挙げられます。2023年の米国における可処分所得の増加は、ドライブインムービーシアター体験を含むレジャー活動への支出動向の拡大をさらに後押しします。
スクリーンサイズに関しては、市場は20フィートまで、20~50フィート、50フィート以上の3つのカテゴリーに分けられます。20フィートまでのセグメントは2024年に24億米ドルを生み出し、2034年までのCAGRは7.2%と予測されます。このスクリーン・サイズは、コスト、スペース、視聴品質のバランスが取れているため特に人気があり、小規模の独立系ドライブイン・シアターに理想的な選択肢となっています。さまざまな車種に対応し、近くから見ても遠くから見ても画質が落ちないです。20フィートスクリーンのノスタルジックな雰囲気は、現代の技術に対応しながらも、映画ファンにアピールしています。
| 市場範囲 | |
|---|---|
| 開始年 | 2024 |
| 予測年 | 2025-2034 |
| 開始金額 | 53億米ドル |
| 予測金額 | 97億米ドル |
| CAGR | 6.6% |
会場のタイプについては、ドライブインムービーシアター市場はレストラン駐車場と劇場駐車場に分類されます。レストラン駐車場セグメントは、2024年の売上高の57.7%以上を占め、2034年までCAGR 6.8%で成長すると予測されています。これらの施設は、レストランが駐車場を屋外映画会場に改装するユニークな機会を提供し、トラフィックを増加させ、追加収益を生み出すのに役立っています。この動向は、安全性と社会的距離を提供するオープンエアの娯楽空間に対する需要の高まりにより、支持を集めています。
市場は技術別にも細分化されており、2D映画と3D映画が主な選択肢となっています。3D分野は2024年には46.2%と大きなシェアを占めると予想されます。偏光3Dとデジタル映写技術の進歩により、ドライブインシアターはより充実した視聴体験を提供できるようになりました。こうした技術革新とプレミアム・エンターテインメントに対する消費者の関心が相まって、ドライブインでの3D上映の需要が高まっています。
北米はドライブインムービーシアター市場で圧倒的なシェアを占めており、2024年の総収入の22.9%、12億米ドルに貢献しています。この地域はドライブインシアターの復活を目の当たりにしており、文化的・技術的要因が継続的な成功に重要な役割を果たしています。可処分所得の増加と屋外での娯楽体験への嗜好が市場成長に寄与しています。
目次
第1章 調査手法と調査範囲
- 調査デザイン
- 調査アプローチ
- データ収集方法
- 基本推定と計算
- 基準年の算出
- 市場推計の主要動向
- 予測モデル
- 1次調査と検証
- 市場定義
第2章 エグゼクティブサマリー
第3章 業界洞察
- エコシステム分析
- サプライヤーの状況
- 価格分析
- テクノロジーとイノベーションの展望
- 主要ニュース&イニシアティブ
- 規制状況
- メーカー
- 販売業者
- 影響要因
- 促進要因
- 先端技術の導入とドライブスルーエリアの強化
- レストラン駐車場のドライブインムービーシアターへの利用拡大
- エンターテインメント業界におけるデジタル化と個人消費の増加
- 業界の潜在的リスク&課題
- 季節性と天候に左右される
- 初期設定コストの高さ
- 促進要因
- 成長可能性分析
- 消費者の購買行動
- ポーター分析
- PESTEL分析
第4章 競合情勢
- イントロダクション
- 企業シェア分析
- 競合のポジショニング・マトリックス
- 戦略展望マトリックス
第5章 市場推計・予測:スクリーンサイズ別、2021年~2034年
- 主要動向
- 20フィート未満
- 20~50フィート
- 50フィート以上
第6章 市場推計・予測:エリア別、2021年~2034年
- 主要動向
- 小規模
- 大規模
第7章 市場推計・予測:技術別、2021年~2034年
- 主要動向
- 2D
- 3D
第8章 市場推計・予測:価格別、2021年~2034年
- 主要動向
- 低価格
- 中価格
- 高価格
第9章 市場推計・予測:用途別、2021年~2034年
- 主要動向
- レストラン駐車場
- 劇場駐車場
第10章 市場推計・予測:地域別、2021年~2034年
- 主要動向
- 北米
- 米国
- カナダ
- 欧州
- 英国
- ドイツ
- フランス
- イタリア
- スペイン
- ロシア
- 北欧
- アジア太平洋
- 中国
- インド
- 日本
- オーストラリア
- 韓国
- 東南アジア
- ラテンアメリカ
- ブラジル
- メキシコ
- アルゼンチン
- MAMEA
- UAE
- 南アフリカ
- サウジアラビア
第11章 企業プロファイル
- Capri Drive-In
- Coyote Drive-In and Canteen
- Delsea Drive-In
- Field of Dreams Drive-In
- Galaxy Drive-In
- Hull's Drive-In
- Malco Theatres
- Mesa Drive-In
- Shankweiler's Drive-In
- South Bay Drive-In
- Star Drive-In
- Starlight Cinemas
- Sunset Cinema Club
- Van Buren Drive-In
- Wellfleet Drive-In
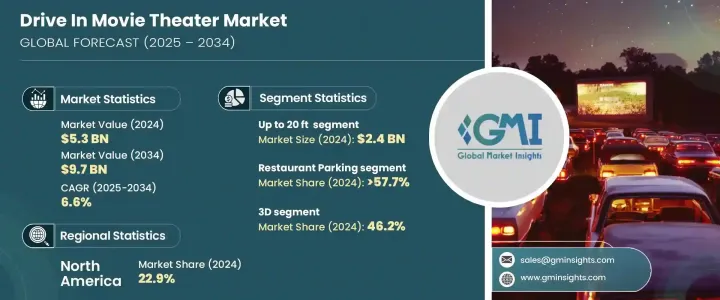
The Global Drive In Movie Theater Market reached USD 5.3 billion in 2024 and is anticipated to grow at 6.6% CAGR from 2025 to 2034. This market is experiencing a resurgence as both younger and middle-aged groups are increasingly drawn to the unique outdoor movie experience. While middle-aged consumers often gravitate toward the nostalgic ambiance of drive-ins, younger audiences are attracted to the social and community-focused aspects of the events. The popularity of drive-in theaters surged during the COVID-19 pandemic as people sought socially distanced entertainment, and the trend continues to thrive. Key factors driving growth include greater disposable income, rising auto ownership, and technological advancements in projection systems and mobile ticketing. The increase in disposable personal income in the U.S. in 2023 further supports the growing trend of spending on leisure activities, including drive-in movie experiences.
In terms of screen size, the market is divided into three categories: up to 20 ft, 20-50 ft, and above 50 ft. The up to 20 ft segment generated USD 2.4 billion in 2024, with a forecasted CAGR of 7.2% through 2034. This screen size is particularly popular because it balances cost, space, and viewing quality, making it an ideal choice for small and independent drive-in theaters. It offers a clear viewing experience for various vehicle types and maintains image quality for both closer and distant viewers. The nostalgic vibe of the 20-foot screen appeals to moviegoers while still accommodating modern-day technology.
| Market Scope | |
|---|---|
| Start Year | 2024 |
| Forecast Year | 2025-2034 |
| Start Value | $5.3 Billion |
| Forecast Value | $9.7 Billion |
| CAGR | 6.6% |
Regarding venue types, the drive-in movie theater market is categorized into restaurant parking lots and theater parking lots. The restaurant parking lots segment accounted for over 57.7% of revenue in 2024 and is projected to grow at 6.8% CAGR until 2034. These venues offer a unique opportunity for restaurants to convert their parking lots into outdoor movie venues, which helps boost their traffic and generate additional revenue. This trend has gained traction due to the increasing demand for open-air entertainment spaces that offer safety and social distancing.
The market is also segmented by technology, with 2D and 3D films being the main options. The 3D segment is expected to hold a significant share of 46.2% in 2024. With advances in polarized 3D and digital projection technology, drive-in theaters are able to deliver enhanced viewing experiences. These innovations, combined with consumer interest in premium entertainment, are driving the growing demand for 3D screenings at drive-ins.
North America holds a dominant share in the drive-in movie theater market, contributing 22.9% of the total revenue in 2024, or USD 1.2 billion. This region is witnessing a revival of drive-in theaters, with cultural and technological factors playing a key role in their ongoing success. The rising disposable income and preference for outdoor entertainment experiences are contributing to market growth.
Table of Contents
Chapter 1 Methodology & Scope
- 1.1 Research design
- 1.1.1 Research approach
- 1.1.2 Data collection methods
- 1.2 Base estimates and calculations
- 1.2.1 Base year calculation
- 1.2.2 Key trends for market estimates
- 1.3 Forecast model
- 1.4 Primary research & validation
- 1.4.1 Primary sources
- 1.4.2 Data mining sources
- 1.5 Market definitions
Chapter 2 Executive Summary
- 2.1 Industry synopsis, 2021 - 2034
Chapter 3 Industry Insights
- 3.1 Industry ecosystem analysis
- 3.2 Supplier landscape
- 3.3 Pricing analysis
- 3.4 Technology & innovation landscape
- 3.5 Key news & initiatives
- 3.6 Regulatory landscape
- 3.7 Manufacturers
- 3.8 Distributors
- 3.9 Impact forces
- 3.9.1 Growth drivers
- 3.9.1.1 Incorporation of advanced technologies and enhancement of drive-through areas
- 3.9.1.2 Wide usage of restaurant parking lots for drive-in movie theatres
- 3.9.1.3 Rising consumer spending as well as digitization in the entertainment industry
- 3.9.2 Industry pitfalls & challenges
- 3.9.2.1 Seasonal nature and weather dependence
- 3.9.2.2 High initial setup costs
- 3.9.1 Growth drivers
- 3.10 Growth potential analysis
- 3.11 Consumer buying behavior
- 3.12 Porter's analysis
- 3.13 PESTEL analysis
Chapter 4 Competitive Landscape, 2024
- 4.1 Introduction
- 4.2 Company market share analysis
- 4.3 Competitive positioning matrix
- 4.4 Strategic outlook matrix
Chapter 5 Market Estimates & Forecast, By Screen Size, 2021 - 2034 ($Bn)
- 5.1 Key trends
- 5.2 Up to 20 ft
- 5.3 20-50 ft
- 5.4 Above 50 ft
Chapter 6 Market Estimates & Forecast, By Area, 2021 - 2034 ($Bn)
- 6.1 Key trends
- 6.2 Small scale
- 6.3 Large scale
Chapter 7 Market Estimates & Forecast, By Technology, 2021 - 2034 ($Bn)
- 7.1 Key trends
- 7.2 2D
- 7.3 3D
Chapter 8 Market Estimates & Forecast, By Price, 2021 - 2034 ($Bn
- 8.1 Key trends
- 8.2 Low
- 8.3 Medium
- 8.4 High
Chapter 9 Market Estimates & Forecast, By Application, 2021 - 2034 ($Bn)
- 9.1 Key trends
- 9.2 Restaurant parking lots
- 9.3 Theater parking lots
Chapter 10 Market Estimates & Forecast, By Region, 2021 - 2034 ($Bn)
- 10.1 Key trends
- 10.2 North America
- 10.2.1 The U.S.
- 10.2.2 Canada
- 10.3 Europe
- 10.3.1 UK
- 10.3.2 Germany
- 10.3.3 France
- 10.3.4 Italy
- 10.3.5 Spain
- 10.3.6 Russia
- 10.3.7 Nordics
- 10.4 Asia Pacific
- 10.4.1 China
- 10.4.2 India
- 10.4.3 Japan
- 10.4.4 Australia
- 10.4.5 South Korea
- 10.4.6 Southeast Asia
- 10.5 Latin America
- 10.5.1 Brazil
- 10.5.2 Mexico
- 10.5.3 Argentina
- 10.6 MAMEA
- 10.6.1 UAE
- 10.6.2 South Africa
- 10.6.3 Saudi Arabia
Chapter 11 Company Profiles
- 11.1 Capri Drive-In
- 11.2 Coyote Drive-In and Canteen
- 11.3 Delsea Drive-In
- 11.4 Field of Dreams Drive-In
- 11.5 Galaxy Drive-In
- 11.6 Hull's Drive-In
- 11.7 Malco Theatres
- 11.8 Mesa Drive-In
- 11.9 Shankweiler's Drive-In
- 11.10 South Bay Drive-In
- 11.11 Star Drive-In
- 11.12 Starlight Cinemas
- 11.13 Sunset Cinema Club
- 11.14 Van Buren Drive-In
- 11.15 Wellfleet Drive-In
