
|
市場調査レポート
商品コード
1913347
リバースロジスティクス市場の機会、成長要因、業界動向分析、および2026年から2035年までの予測Reverse Logistics Market Opportunity, Growth Drivers, Industry Trend Analysis, and Forecast 2026 - 2035 |
||||||
カスタマイズ可能
|
|||||||
| リバースロジスティクス市場の機会、成長要因、業界動向分析、および2026年から2035年までの予測 |
|
出版日: 2025年12月29日
発行: Global Market Insights Inc.
ページ情報: 英文 240 Pages
納期: 2~3営業日
|

概要
世界のリバースロジスティクス市場は、2025年に8,726億米ドルと評価され、2035年までにCAGR 7.3%で成長し、1兆7,500億米ドルに達すると予測されています。
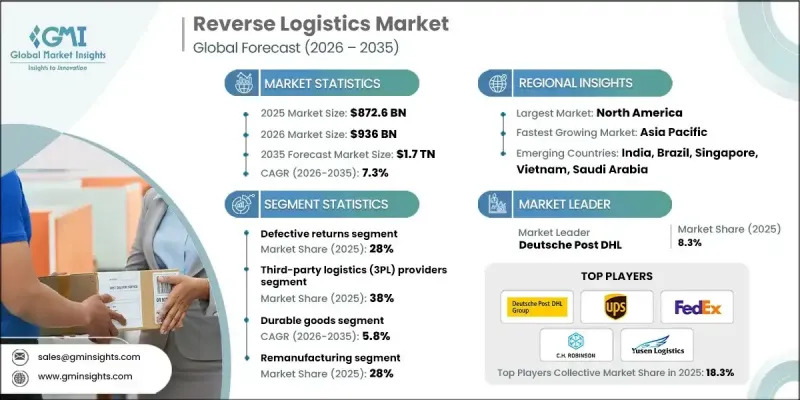
市場成長は、企業の環境責任への注力強化と、より広範な持続可能性目標との整合性によって推進されています。リバースロジスティクスは、返品製品の体系的な回収・再利用・責任ある廃棄を可能にすることで廃棄物削減を支援し、組織が環境負荷を低減すると同時に企業の社会的責任への取り組みを強化することを助けます。また、持続可能性は競争上の差別化要因ともなっており、消費者は責任ある事業運営を実践する企業をますます支持する傾向にあります。デジタルコマースの急速な拡大は返品量を大幅に増加させ、サプライチェーンを通じた製品移動を管理する効率的なシステムの必要性を高めています。効率化された返品処理は、顧客満足度、ブランド信頼性、長期的な顧客維持と密接に関連しています。リバースロジスティクスは、返品商品からの価値回収、資材効率の向上、新規投入資源への依存度低減を通じて、コスト管理も支援します。企業が循環型経済モデルと事業継続性を追求する中、リバースロジスティクスは小売、製造、流通ネットワークを横断する戦略的機能として、世界的に重要性を増しています。
| 市場範囲 | |
|---|---|
| 開始年 | 2025年 |
| 予測年度 | 2026-2035 |
| 開始時価値 | 8,726億米ドル |
| 予測金額 | 1兆7,500億米ドル |
| CAGR | 7.3% |
不良返品セグメントは2025年に28%のシェアを占めました。特に技術主導型および消費者志向の業界において、非適合製品の高ボリュームがリバースフローを継続的に促進しています。組織は、欠陥関連のコストを抑制するため、高度な診断ツールやサプライヤー連携ツールをますます活用しています。規制監視と透明性への期待が高まり続ける中、製品リコールも増加傾向にあります。
耐久消費財セグメントは、2026年から2035年にかけてCAGR5.8%で成長すると予測されています。高い返品頻度、再生可能性、持続的な二次市場需要が堅調な業績を支えています。コンシューマブル製品に関連するリバースロジスティクス活動も、コンプライアンス要件、ライフサイクル管理、環境配慮の影響により拡大しています。
米国リバースロジスティクス市場は2025年に1,600億米ドル規模に達し、2035年まで堅調な成長が見込まれます。高い返品率が自動化、データ駆動型仕分け、処理サイクルの高速化への投資を促進しています。多くの企業が効率性と顧客体験向上のためリバースオペレーションを外部委託する一方、持続可能性の要請とESGイニシアチブが再利用・回収プログラムの加速を継続的に後押ししています。
よくあるご質問
目次
第1章 調査手法
第2章 エグゼクティブサマリー
第3章 業界考察
- エコシステム分析
- サプライヤーの情勢
- 利益率分析
- コスト構造
- 各段階における付加価値
- バリューチェーンに影響を与える要因
- ディスラプション
- 業界への影響要因
- 促進要因
- オンラインショッピングの成長に伴うEC返品増加
- 廃棄物管理およびリサイクルに関する規制要件
- 持続可能性と循環型経済の導入に対する関心の高まり
- 返品商品及び再生可能資材からのコスト回収可能性
- 技術的進歩:追跡と自動化のためのAI、IoT、ブロックチェーン
- 業界の潜在的リスク&課題
- 返品輸送および処理における高い運営コスト
- マルチチャネル返品管理の複雑性
- 市場機会
- グリーンロジスティクスおよびカーボンフットプリント削減イニシアチブとの統合
- 再生品および中古市場の拡大
- スマート逆物流ソリューション(AI、予測分析)の導入
- メーカー、小売業者、リサイクル企業間の連携
- 成長可能性分析
- 規制情勢
- 北米
- 米国- 資源保全・再生法(RCRA)及び拡大生産者責任(EPR)法
- カナダ- カナダ環境保護法(CEPA)及び州のEPRプログラム
- 欧州
- 英国- 廃電気電子機器(WEEE)規制
- ドイツ- 循環経済法(Kreislaufwirtschaftsgesetz)
- フランス- 循環型経済のための廃棄物削減法(AGEC法)
- イタリア- 環境法(政令第152号/2006年)
- スペイン- 廃棄物及び汚染土壌法
- アジア太平洋地域
- 中国- 拡大生産者責任制度及び固形廃棄物汚染防止法
- 日本- 家電リサイクル法及び自動車リサイクル法
- インド- 電子廃棄物管理規則及びプラスチック廃棄物管理規則
- ラテンアメリカ
- ブラジル- 国家固形廃棄物政策(PNRS)
- メキシコ- 廃棄物防止及び総合管理に関する一般法(LGPGIR)
- アルゼンチン- 統合廃棄物管理法
- 中東・アフリカ
- アラブ首長国連邦- 廃棄物管理に関する連邦法
- 南アフリカ- 国家環境管理:廃棄物法
- サウジアラビア- 廃棄物管理規制
- 北米
- ポーター分析
- PESTEL分析
- 技術とイノベーションの動向
- 現在の技術動向
- 新興技術
- コスト内訳分析
- 開発コスト構造
- 研究開発費の分析
- マーケティング及び販売コスト
- 特許分析
- 持続可能性と環境面
- 持続可能な実践
- 廃棄物削減戦略
- 生産におけるエネルギー効率
- 環境に配慮した取り組み
- 返品行動と返品率の動向
- 業界および製品カテゴリー別の返品率分析
- 寛大な返品ポリシーがリバースロジスティクス量に与える影響
- 季節的およびプロモーションによる返品変動
- リバースロジスティクス業務におけるリスク状況
- 将来の運営モデルと業界の進化
- プラットフォーム型リバースロジスティクス・エコシステム
- 分散型およびオンデマンド返品処理
- ゼロ・ウェイスト義務化の長期的な影響
第4章 競合情勢
- イントロダクション
- 企業の市場シェア分析
- 北米
- 欧州
- アジア太平洋地域
- ラテンアメリカ
- 中東・アフリカ地域
- 主要市場企業の競合分析
- 競合ポジショニングマトリックス
- 戦略的展望マトリックス
- 主な発展
- 合併・買収
- 提携・協業
- 新製品の発売
- 事業拡大計画と資金調達
第5章 市場推計・予測:製造工程別、2021-2034
- 返品管理
- 再生製造
- リサイクル
- 廃棄処理
- その他
第6章 市場推計・予測:収益別、2021-2034
- 不良返品
- 回収された収益
- B2B返品および商業返品
- 修理可能な返品
- 寿命終了時の返品
- その他
第7章 市場推計・予測:サービスプロバイダー別、2021-2034
- 社内リバースロジスティクス
- サードパーティ・ロジスティクス(3PL)プロバイダー
- リサイクル企業
- 廃棄物管理会社
第8章 市場推計・予測:カテゴリー別、2022-2035
- 耐久消費財
- 消耗品
- 産業用機器
- 包装資材
- その他
第9章 市場推計・予測:最終用途別、2021-2034
- 小売業および電子商取引
- 電子機器
- 自動車
- 医薬品
- 製造業
- その他
第10章 市場推計・予測:地域別、2022-2035
- 北米
- 米国
- カナダ
- 欧州
- ドイツ
- 英国
- フランス
- イタリア
- スペイン
- ロシア
- 北欧諸国
- ポルトガル
- クロアチア
- ベネルクス
- アジア太平洋地域
- 中国
- インド
- 日本
- オーストラリア
- 韓国
- シンガポール
- タイ
- インドネシア
- ベトナム
- ラテンアメリカ
- ブラジル
- メキシコ
- アルゼンチン
- コロンビア
- 中東・アフリカ地域
- 南アフリカ
- サウジアラビア
- アラブ首長国連邦
- トルコ
第11章 企業プロファイル
- 世界プレイヤー
- Deutsche Post DHL
- United Parcel Service(UPS)
- FedEx
- CMA CGM
- DB Schenker
- CEVA Logistics
- XPO Logistics
- Ryder System
- C.H. Robinson Worldwide
- Yusen Logistics
- Kintetsu World Express
- Ingram Micro Commerce &Lifecycle Services
- Logistics Plus
- 地域プレイヤー
- NFI Industries
- Pitney Bowes
- Blue Dart Express
- Safexpress
- Reverse Logistics
- Stena Recycling
- R2 Logistics
- Inmar Intelligence
- Emerging/Disruptor Players
- Happy Returns(a PayPal company)
- Optoro
- ReverseLogix
- Apto Solutions
- Forterra Solutions
- Core Logistic
- Softbox Systems
- R2 Logistics
- Forterra Solutions
