
|
市場調査レポート
商品コード
1665334
充電式タイヤ市場機会と促進要因、業界動向分析、2025~2034年予測Rechargeable Tires Market Opportunity, Growth Drivers, Industry Trend Analysis, and Forecast 2025 - 2034 |
||||||
カスタマイズ可能
|
|||||||
| 充電式タイヤ市場機会と促進要因、業界動向分析、2025~2034年予測 |
|
出版日: 2024年12月23日
発行: Global Market Insights Inc.
ページ情報: 英文 175 Pages
納期: 2~3営業日
|

全表示
- 概要
- 目次
充電式タイヤの世界市場は、2024年に1億1,340万米ドルと評価され、2025~2034年にかけて6.7%のCAGRで堅調に拡大すると予測されています。
この成長の主因は、現代の消費者が性能、安全性、適応性をますます優先するようになり、カスタマイズ型タイヤソリューションに対する需要が高まっていることです。ドライバーは今日、オフロードでの冒険のための耐久性の強化、高性能車のためのハンドリングの改善、電気自動車のためのエネルギー効率の最適化など、特定のニーズに合わせたタイヤを求めています。このような嗜好の進化が産業を変革し、燃費、安全性、寿命を向上させるタイヤ設計の革新に拍車をかけています。
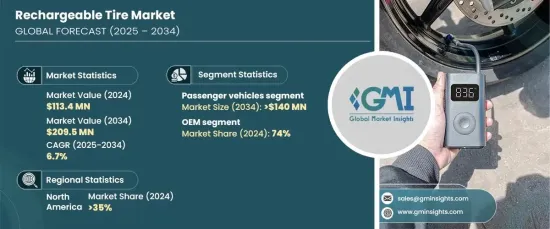
車種別では、市場は乗用車と商用車に区分されます。2024年には乗用車が市場シェアの60%を占め、2034年には1億4,000万米ドルに達すると予測されています。この優位性は、世界中で広く使用されていることと、利便性、耐久性、総合性能を向上させる先進的タイヤ技術への需要が高まっていることに起因しています。乗用車用に設計された充電式タイヤは、寿命の延長や自己修復機能といった魅力的な特徴を備えており、毎日の通勤や都市部の走行環境に最適です。
| 市場範囲 | |
|---|---|
| 開始年 | 2024年 |
| 予測年 | 2025~2034年 |
| 開始金額 | 1億1,340万米ドル |
| 予測金額 | 2億950万米ドル |
| CAGR | 6.7% |
充電式タイヤ市場は、さらに流通チャネル別にOEM(相手先ブランド製造)セグメントとアフターマーケットセグメントに分類されます。OEMセグメントは2024年に74%という驚異的な市場シェアを獲得しており、予測期間中も主導的地位を維持すると予想されます。自動車メーカーは、自動車の性能を高めるために革新的な技術をますます優先するようになっており、OEMはこれらの進歩を生産プロセスに組み込む重要な参入企業となっています。充電式タイヤは、特に効率、安全性、寿命が重要な電気自動車や高性能車のOEMチャネルで勢いを増しています。進化する自動車動向に沿ったカスタマイズ型ソリューションを提供するOEMの能力は、市場拡大を推進する上で極めて重要な役割を担っていることを裏付けています。
北米は、2024年の充電式タイヤ市場において35%という大きなシェアを占めており、同地域の自動車産業の拡大と乗用車・商用車の台数増加に支えられています。電気自動車(EV)の普及がこの市場をさらに後押ししており、EVはエネルギー効率と耐久性を追求したタイヤを要求しています。技術革新とサステイナブルモビリティを重視する北米は、現代の輸送需要に応える充電式モデルなど、最先端のタイヤ技術の拠点であり続けています。
目次
第1章 調査手法と調査範囲
- 調査デザイン
- 調査アプローチ
- データ収集方法
- 基本推定と計算
- 基準年の算出
- 市場推定の主要動向
- 予測モデル
- 一次調査と検証
- 一次情報
- データマイニングソース
- 市場スコープと定義
第2章 エグゼクティブサマリー
第3章 産業洞察
- エコシステム分析
- 原料サプライヤー
- 部品サプライヤー
- メーカー
- 技術プロバイダー
- 流通業者
- エンドユーザー
- サプライヤーの状況
- 利益率分析
- 技術とイノベーションの展望
- 特許分析
- 規制状況
- 価格分析
- 影響要因
- 促進要因
- 自動車設計における持続可能性の推進
- タイヤ製造におけるAIとスマート材料の採用
- パーソナライズされたタイヤソリューションへの需要の高まり
- 産業の潜在的リスク・課題
- 高い研究開発コスト
- 限られた商業的実行可能性
- 促進要因
- 成長可能性分析
- ポーター分析
- PESTEL分析
第4章 競合情勢
- イントロダクション
- 企業シェア分析
- 競合のポジショニングマトリックス
- 戦略展望マトリックス
第5章 市場推定・予測:材料別、2021~2034年
- 主要動向
- 生分解性ゴム
- 強化繊維
- 従来型混合ゴム
第6章 市場推定・予測:車両別、2021~2034年
- 主要動向
- 乗用車
- ハッチバック
- セダン
- SUV車
- 商用車
- 小型商用車(LCV)
- 大型商用車(HCV)
第7章 市場推定・予測:流通チャネル別、2021~2034年
- 主要動向
- OEM
- アフターマーケット
第8章 市場推定・予測:地域別、2021~2034年
- 主要動向
- 北米
- 米国
- カナダ
- 欧州
- 英国
- ドイツ
- フランス
- イタリア
- スペイン
- ロシア
- 北欧
- アジア太平洋
- 中国
- インド
- 日本
- オーストラリア
- 韓国
- 東南アジア
- ラテンアメリカ
- ブラジル
- メキシコ
- アルゼンチン
- 中東・アフリカ
- アラブ首長国連邦
- 南アフリカ
- サウジアラビア
第9章 企業プロファイル
- Existing companies
- Opportunity companies
The Global Rechargeable Tires Market was valued at USD 113.4 million in 2024 and is anticipated to expand at a robust CAGR of 6.7% from 2025 to 2034. This growth is primarily driven by the rising demand for customized tire solutions, as modern consumers increasingly prioritize performance, safety, and adaptability. Drivers today seek tires tailored to specific needs, such as enhanced durability for off-road adventures, improved handling for high-performance vehicles, and optimized energy efficiency for electric cars. This evolving preference is transforming the industry, fueling innovation in tire designs that enhance fuel efficiency, safety, and longevity.
In terms of vehicle type, the market is segmented into passenger and commercial vehicles. In 2024, passenger vehicles accounted for 60% of the market share and are projected to reach USD 140 million by 2034. This dominance is attributed to their widespread use across the globe and the growing demand for advanced tire technologies that improve convenience, durability, and overall performance. Rechargeable tires designed for passenger vehicles offer appealing features such as extended lifespans and self-repairing capabilities, making them ideal for daily commutes and urban driving environments.
| Market Scope | |
|---|---|
| Start Year | 2024 |
| Forecast Year | 2025-2034 |
| Start Value | $113.4 Million |
| Forecast Value | $209.5 Million |
| CAGR | 6.7% |
The rechargeable tires market is further categorized by sales channel into OEM (Original Equipment Manufacturer) and aftermarket segments. The OEM segment captured an impressive 74% market share in 2024 and is expected to maintain its leading position throughout the forecast period. Automakers are increasingly prioritizing innovative technologies to enhance vehicle performance, making OEMs critical players in integrating these advancements during the production process. Rechargeable tires are particularly gaining momentum in the OEM channel, especially for electric and high-performance vehicles, where efficiency, safety, and longevity are vital. The ability of OEMs to deliver customized solutions aligned with evolving automotive trends underscores their pivotal role in driving market expansion.
North America held a significant 35% share of the rechargeable tires market in 2024, supported by the region's expansive automotive industry and the rising number of passenger and commercial vehicles. The growing adoption of electric vehicles (EVs) further propels this market, as EVs demand tires engineered for energy efficiency and durability. With a strong focus on innovation and sustainable mobility, North America continues to be a hub for cutting-edge tire technologies, including rechargeable models that cater to the demands of modern transportation.
Table of Contents
Chapter 1 Methodology & Scope
- 1.1 Research design
- 1.1.1 Research approach
- 1.1.2 Data collection methods
- 1.2 Base estimates & calculations
- 1.2.1 Base year calculation
- 1.2.2 Key trends for market estimation
- 1.3 Forecast model
- 1.4 Primary research and validation
- 1.4.1 Primary sources
- 1.4.2 Data mining sources
- 1.5 Market scope & definition
Chapter 2 Executive Summary
- 2.1 Industry 3600 synopsis, 2021 - 2034
Chapter 3 Industry Insights
- 3.1 Industry ecosystem analysis
- 3.1.1 Raw material suppliers
- 3.1.2 Component suppliers
- 3.1.3 Manufacturers
- 3.1.4 Technology providers
- 3.1.5 Distributors
- 3.1.6 End users
- 3.2 Supplier landscape
- 3.3 Profit margin analysis
- 3.4 Technology & innovation landscape
- 3.5 Patent analysis
- 3.6 Regulatory landscape
- 3.7 Pricing analysis
- 3.8 Impact forces
- 3.8.1 Growth drivers
- 3.8.1.1 Sustainability push in automotive design
- 3.8.1.2 Adoption of AI and smart materials in tire manufacturing
- 3.8.1.3 Increased demand for personalized tire solutions
- 3.8.2 Industry pitfalls & challenges
- 3.8.2.1 High R&D costs
- 3.8.2.2 Limited commercial viability
- 3.8.1 Growth drivers
- 3.9 Growth potential analysis
- 3.10 Porter’s analysis
- 3.11 PESTEL analysis
Chapter 4 Competitive Landscape, 2024
- 4.1 Introduction
- 4.2 Company market share analysis
- 4.3 Competitive positioning matrix
- 4.4 Strategic outlook matrix
Chapter 5 Market Estimates & Forecast, By Material, 2021 - 2034 ($Mn, Units)
- 5.1 Key trends
- 5.2 Biodegradable rubber
- 5.3 Reinforced fiber
- 5.4 Traditional rubber blends
Chapter 6 Market Estimates & Forecast, By Vehicle, 2021 - 2034 ($Mn, Units)
- 6.1 Key trends
- 6.2 Passenger vehicles
- 6.2.1 Hatchback
- 6.2.2 Sedan
- 6.2.3 SUVs
- 6.3 Commercial vehicles
- 6.3.1 Light Commercial Vehicles (LCVs)
- 6.3.2 Heavy Commercial Vehicles (HCVs)
Chapter 7 Market Estimates & Forecast, By Sales Channel, 2021 - 2034 ($Mn, Units)
- 7.1 Key trends
- 7.2 OEM
- 7.3 Aftermarket
Chapter 8 Market Estimates & Forecast, By Region, 2021 - 2034 ($Mn, Units)
- 8.1 Key trends
- 8.2 North America
- 8.2.1 U.S.
- 8.2.2 Canada
- 8.3 Europe
- 8.3.1 UK
- 8.3.2 Germany
- 8.3.3 France
- 8.3.4 Italy
- 8.3.5 Spain
- 8.3.6 Russia
- 8.3.7 Nordics
- 8.4 Asia Pacific
- 8.4.1 China
- 8.4.2 India
- 8.4.3 Japan
- 8.4.4 Australia
- 8.4.5 South Korea
- 8.4.6 Southeast Asia
- 8.5 Latin America
- 8.5.1 Brazil
- 8.5.2 Mexico
- 8.5.3 Argentina
- 8.6 MEA
- 8.6.1 UAE
- 8.6.2 South Africa
- 8.6.3 Saudi Arabia
Chapter 9 Company Profiles
- 9.1 Existing companies
- 9.1.1 Goodyear
- 9.1.2 Michelin
- 9.1.3 Hankook
- 9.1.4 Nexen tire
- 9.1.5 Nokian
- 9.2 Opportunity companies
- 9.2.1 Bridgestone
- 9.2.2 Continental
- 9.2.3 Cooper
- 9.2.4 Dunlop
- 9.2.5 Kumho
- 9.2.6 Mickey Thompson
- 9.2.7 Pirelli
- 9.2.8 Sumitomo
- 9.2.9 Toyo
- 9.2.10 Yokohama

