
分光学ソフトウェア市場の市場機会、成長促進要因、産業動向分析、2025年~2034年予測
Spectroscopy Software Market Opportunity, Growth Drivers, Industry Trend Analysis, and Forecast 2025 - 2034- 発行日
- ページ情報
- 英文 135 Pages
- 納期
- 2~3営業日
- 商品コード
- 1665256
- カスタマイズ可能 お客様のご希望に応じて、既存データの加工や未掲載情報(例:国別セグメント)の追加などの対応が可能です。詳細はお問い合わせください。
- 翻訳ツール提供対象 PDF対応AI翻訳ツールの無料貸し出しサービスのご利用が可能です
概要
分光学ソフトウェアの世界市場は、2024年に11億米ドルと評価され、2025~2034年にかけてCAGR 9.1%の目覚ましい成長が予測されています。
分光学ソフトウェアは、スペクトロメーターとの連携において重要な役割を果たし、幅広い用途におけるスペクトルデータの効率的な収集、分析、解釈を促進します。このソフトウェアは、精密で正確な測定に依存する産業にとって不可欠であり、様々なセグメントで極めて重要なツールとなっています。
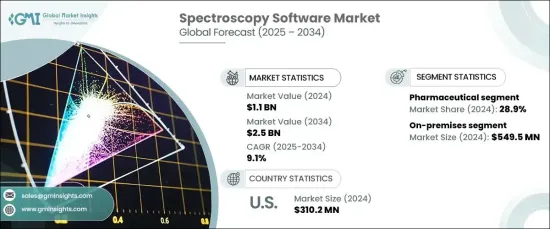
市場は展開タイプ別にオンプレミスとクラウドのソリューションに分けられます。2024年には、オンプレミスが市場をリードし、5億4,950万米ドルの収益を上げており、予測期間中も堅調な成長が見込まれています。オンプレミスソリューションは、産業規制の遵守に不可欠な機密データの管理強化を必要とする組織に特に支持されています。医療や製薬など、データセキュリティが最重要視される産業では、オンプレミスの導入モデルが強く支持されています。これらのソリューションは、情報に対する必要なセキュリティとコントロールを確保し、厳しい規制基準を満たす上で不可欠なものとなっています。
| 市場範囲 | |
|---|---|
| 開始年 | 2024年 |
| 予測年 | 2025~2034 |
| 開始金額 | 11億米ドル |
| 予測金額 | 25億米ドル |
| CAGR | 9.1% |
用途別では、市場は食品検査、環境検査、法医学、医薬品、その他のセグメントに区分されます。製薬産業は2024年の市場シェアの28.9%を占め、今後数年で大幅な成長が見込まれます。医薬品開発における精密で高品質な標準物質への要求の高まりと規制要件の強化が、分光法ソフトウェアの採用拡大を後押ししています。さらに、創薬における高性能スクリーニングのニーズの高まりが、これらのソフトウェアソリューションの使用に拍車をかけています。研究開発者は、大規模なデータセットの管理、ワークフローの合理化、医薬品開発と臨床検査における研究成果の加速のために、ますます分光学ソフトウェアに頼るようになっています。
米国では、分光学ソフトウェア市場は2024年に3億1,020万米ドルを生み出しました。米国は、分光法ソフトウェアの大手開発企業や装置メーカーの本拠地であり、世界市場で圧倒的な強さを維持しています。米国のラボでは先進的分析技術が広く採用されており、医薬品や食品安全などの産業における厳しい規制環境と相まって、最先端の分光法ソフトウェアソリューションの需要が引き続き高まっています。これらの要因は、継続的な技術の進歩と相まって、米国市場の成長を維持し、今後10年間の継続的な拡大に貢献すると予想されます。
目次
第1章 調査手法と調査範囲
- 市場スコープと定義
- 調査デザイン
- 調査アプローチ
- データ収集方法
- 基本推定と計算
- 基準年の算出
- 市場推定の主要動向
- 予測モデル
- 1次調査と検証
- 一次情報
- データマイニングソース
第2章 エグゼクティブサマリー
第3章 産業洞察
- エコシステム分析
- 産業への影響要因
- 促進要因
- 製薬産業における分光法ソフトウェアの需要拡大
- 環境と食品安全規制
- 技術の進歩
- 学術研究機関における研究開発投資の増加
- 産業の潜在的リスク・課題
- データセキュリティに関する懸念
- 促進要因
- 成長可能性分析
- 規制状況
- 米国
- 欧州
- 技術動向
- 今後の市場動向
- 主要ニュースと取り組み
- ギャップ分析
- ポーター分析
- PESTEL分析
第4章 競合情勢
- イントロダクション
- 企業シェア分析
- 企業マトリックス分析
- 主要市場参入企業の競合分析
- 競合のポジショニングマトリックス
- 戦略ダッシュボード
第5章 市場推定・予測:展開タイプ別、2021~2034年
- 主要動向
- オンプレミス
- クラウド
第6章 市場推定・予測:用途別、2021~2034年
- 主要動向
- 食品検査
- 環境検査
- 法医学
- 医薬品
- その他
第7章 市場推定・予測:地域別、2021~2034年
- 主要動向
- 北米
- 米国
- カナダ
- 欧州
- ドイツ
- 英国
- フランス
- スペイン
- イタリア
- オランダ
- アジア太平洋
- 中国
- 日本
- インド
- オーストラリア
- 韓国
- ラテンアメリカ
- ブラジル
- メキシコ
- アルゼンチン
- 中東・アフリカ
- 南アフリカ
- サウジアラビア
- アラブ首長国連邦
第8章 企業プロファイル
- Agilent Technologies
- Advanced Chemistry Development
- Bruker Corporation
- Danaher Corporation
- Genedata
- Lablicate
- Microsaic Systems
- OpenMS
- SCIEX
- Shimadzu Corporation
- SpectralWorks
- Spectrum Software Solutions
- StellarNet
- Thermo Fisher Scientific
- Waters Corporation
目次
The Global Spectroscopy Software Market was valued at USD 1.1 billion in 2024 and is projected to grow at an impressive CAGR of 9.1% from 2025 to 2034. Spectroscopy software plays a crucial role in working with spectrometers, facilitating the efficient collection, analysis, and interpretation of spectral data across a wide range of applications. This software is essential for industries that rely on precise and accurate measurements, making it a pivotal tool in various sectors.
The market is divided by deployment type into on-premises and cloud-based solutions. In 2024, the on-premises segment led the market, generating USD 549.5 million in revenue, and is expected to continue experiencing robust growth throughout the forecast period. On-premises solutions are particularly favored by organizations that require enhanced control over sensitive data, which is critical for compliance with industry regulations. Industries such as healthcare and pharmaceuticals, where data security is paramount, strongly prefer on-premises deployment models. These solutions ensure the necessary security and control over information, making them indispensable in meeting stringent regulatory standards.
| Market Scope | |
|---|---|
| Start Year | 2024 |
| Forecast Year | 2025-2034 |
| Start Value | $1.1 Billion |
| Forecast Value | $2.5 Billion |
| CAGR | 9.1% |
In terms of application, the market is segmented into food testing, environmental testing, forensic science, pharmaceuticals, and other sectors. The pharmaceutical industry accounted for 28.9% of the market share in 2024 and is expected to experience substantial growth in the coming years. The increasing demand for precision and high-quality standards in drug development, along with tightening regulatory requirements, is driving the growing adoption of spectroscopy software. Furthermore, the rising need for high-throughput screening in drug discovery is fueling the use of these software solutions. Researchers are increasingly relying on spectroscopy software to manage large datasets, streamline workflows, and accelerate research outcomes in drug development and clinical testing.
In the United States, the spectroscopy software market generated USD 310.2 million in 2024. The U.S. remains a dominant force in the global market, home to leading developers of spectroscopy software and instrument manufacturers. The widespread adoption of advanced analytical technologies in U.S. laboratories, combined with the strict regulatory environment in industries such as pharmaceuticals and food safety, continues to drive the demand for cutting-edge spectroscopy software solutions. These factors, coupled with ongoing technological advancements, are expected to sustain the growth of the U.S. market and contribute to its continued expansion over the next decade.
Table of Contents
Chapter 1 Methodology & Scope
- 1.1 Market scope & definitions
- 1.2 Research design
- 1.2.1 Research approach
- 1.2.2 Data collection methods
- 1.3 Base estimates & calculations
- 1.3.1 Base year calculation
- 1.3.2 Key trends for market estimation
- 1.4 Forecast model
- 1.5 Primary research and validation
- 1.5.1 Primary sources
- 1.5.2 Data mining sources
Chapter 2 Executive Summary
- 2.1 Industry 3600 synopsis
Chapter 3 Industry Insights
- 3.1 Industry ecosystem analysis
- 3.2 Industry impact forces
- 3.2.1 Growth drivers
- 3.2.1.1 Growing demand of spectroscopy software in pharmaceutical industry
- 3.2.1.2 Environmental and food safety regulations
- 3.2.1.3 Technological advancements
- 3.2.1.4 Rise in research and development investments in academic and research institutions
- 3.2.2 Industry pitfalls & challenges
- 3.2.2.1 Data security concerns
- 3.2.1 Growth drivers
- 3.3 Growth potential analysis
- 3.4 Regulatory landscape
- 3.4.1 U.S.
- 3.4.2 Europe
- 3.5 Technology landscape
- 3.6 Future market trends
- 3.7 Key news and initiatives
- 3.8 Gap analysis
- 3.9 Porter’s analysis
- 3.10 PESTEL analysis
Chapter 4 Competitive Landscape, 2024
- 4.1 Introduction
- 4.2 Company market share analysis
- 4.3 Company matrix analysis
- 4.4 Competitive analysis of major market players
- 4.5 Competitive positioning matrix
- 4.6 Strategy dashboard
Chapter 5 Market Estimates and Forecast, By Deployment Type, 2021 – 2034 ($ Mn)
- 5.1 Key trends
- 5.2 On-premises
- 5.3 Cloud
Chapter 6 Market Estimates and Forecast, By Application, 2021 – 2034 ($ Mn)
- 6.1 Key trends
- 6.2 Food testing
- 6.3 Environmental testing
- 6.4 Forensic science
- 6.5 Pharmaceuticals
- 6.6 Other applications
Chapter 7 Market Estimates and Forecast, By Region, 2021 – 2034 ($ Mn)
- 7.1 Key trends
- 7.2 North America
- 7.2.1 U.S.
- 7.2.2 Canada
- 7.3 Europe
- 7.3.1 Germany
- 7.3.2 UK
- 7.3.3 France
- 7.3.4 Spain
- 7.3.5 Italy
- 7.3.6 Netherlands
- 7.4 Asia Pacific
- 7.4.1 China
- 7.4.2 Japan
- 7.4.3 India
- 7.4.4 Australia
- 7.4.5 South Korea
- 7.5 Latin America
- 7.5.1 Brazil
- 7.5.2 Mexico
- 7.5.3 Argentina
- 7.6 Middle East and Africa
- 7.6.1 South Africa
- 7.6.2 Saudi Arabia
- 7.6.3 UAE
Chapter 8 Company Profiles
- 8.1 Agilent Technologies
- 8.2 Advanced Chemistry Development
- 8.3 Bruker Corporation
- 8.4 Danaher Corporation
- 8.5 Genedata
- 8.6 Lablicate
- 8.7 Microsaic Systems
- 8.8 OpenMS
- 8.9 SCIEX
- 8.10 Shimadzu Corporation
- 8.11 SpectralWorks
- 8.12 Spectrum Software Solutions
- 8.13 StellarNet
- 8.14 Thermo Fisher Scientific
- 8.15 Waters Corporation
- 発行日
- 発行
- Global Market Insights Inc.
- ページ情報
- 英文 135 Pages
- 納期
- 2~3営業日


