
|
市場調査レポート
商品コード
1664828
玩具の市場機会、成長促進要因、産業動向分析、2025年~2034年予測Toy Market Opportunity, Growth Drivers, Industry Trend Analysis, and Forecast 2025 - 2034 |
||||||
カスタマイズ可能
|
|||||||
| 玩具の市場機会、成長促進要因、産業動向分析、2025年~2034年予測 |
|
出版日: 2024年12月02日
発行: Global Market Insights Inc.
ページ情報: 英文 220 Pages
納期: 2~3営業日
|

全表示
- 概要
- 目次
世界の玩具市場は、2023年に1,087億米ドルとなり、2024年から2032年にかけてCAGR5.8%で拡大すると予測されています。
創造性、批判的思考、問題解決能力を高めることに重点を置き、教育的価値を促進する玩具を選ぶ親が増えています。この変化は、特にSTEM(科学、技術、工学、数学)教育に対応した、学習と娯楽を組み合わせたデザインの玩具の人気を牽引しています。
市場は製品タイプ別に、教育玩具、建設玩具、音楽玩具、ゲーム玩具、人形・ミニチュア玩具、自動車玩具、ままごと玩具、その他に区分されます。中でも教育玩具は重要なセグメントとして浮上し、2023年には約250億米ドルの収益を生み出します。このカテゴリーは、予測期間中にCAGR6.5%で成長すると予想されています。教育玩具は、没入型の学習体験を生み出すために、人工知能、ロボット工学、拡張現実などの最先端技術をますます取り入れるようになっています。こうした進歩は、学習を魅力的なものにするだけでなく、娯楽と発達上の利点を融合させた玩具に対する需要の高まりにも応えています。
| 市場範囲 | |
|---|---|
| 開始年 | 2024年 |
| 予測年 | 2025年~2034年 |
| 開始金額 | 1,087億米ドル |
| 予測金額 | 1,794億米ドル |
| CAGR | 5.8% |
最終用途別に見ると、市場は個人向けセグメントと商業向けセグメントに分けられます。2023年には、商業セグメントが市場シェアの約56%を占め、2032年までのCAGRは5.9%と予測されています。学校や保育所などの教育機関が、これらの玩具を大量に購入することで需要を牽引しています。幼児教育が重視されるようになったことで、知育玩具は認知能力や社会性の発達に欠かせないツールと位置づけられています。さらに、こうした玩具は、子どもたちの問題解決能力やチームワークを育むことを目的としたSTEM学習プログラムに組み込まれることが増えています。
北米では、米国が2023年の収益約228億米ドルで市場をリードしています。米国市場は2032年までCAGR5.9%で成長すると予測されており、これは玩具に先端技術が統合されていることが要因となっています。バーチャルリアリティ、拡張知能、人工知能などの機能が、物理的要素とデジタル要素を融合させたインタラクティブな遊びの新しい波を生み出しています。この動向は、子供たちやテクノロジー愛好家の共感を呼んでいます。
目次
第1章 調査手法と調査範囲
- 市場範囲と定義
- 基本推定と計算
- 予測計算
- データソース
- 一次
- 二次
- 有料情報源
- 公的情報源
第2章 エグゼクティブサマリー
第3章 業界洞察
- 業界エコシステム分析
- バリューチェーンに影響を与える要因
- 利益率分析
- 変革
- 将来の展望
- メーカー
- 流通業者
- サプライヤーの状況
- 利益率分析
- 主要ニュース・イニシアチブ
- 規制状況
- 影響要因
- 成長促進要因
- 教育玩具とSTEM玩具の成長
- eコマースの成長
- 業界の潜在的リスク・課題
- 価格感応度
- 成長促進要因
- 成長可能性分析
- ポーター分析
- PESTEL分析
第4章 競合情勢
- イントロダクション
- 企業シェア分析
- 競合のポジショニングマトリックス
- 戦略展望マトリックス
第5章 市場推計・予測:製品タイプ別、2021年~2032年
- 主要動向
- 知育玩具
- 建設玩具
- 音楽玩具
- ゲーム玩具
- 人形・ミニチュア玩具
- 自動車玩具
- ままごと玩具
- その他(美術工芸玩具、楽器など)
第6章 市場推計・予測:価格帯別、2021年~2032年
- 主要動向
- 低
- 中
- 高
第7章 市場推計・予測:年齢層別、2021年~2032年
- 主要動向
- 1歳未満
- 1~3歳
- 3~5歳
- 5~12歳
- 12歳以上
第8章 市場推計・予測:材料別、2021年~2032年
- 主要動向
- プラスチック
- 木製
- 金属
- 布地
- 生分解性/有機素材
第9章 市場推計・予測:最終用途別、2021年~2032年
- 主要動向
- 個人向け
- 業務用
第10章 市場推計・予測:流通チャネル別、2021年~2032年
- 主要動向
- オンライン
- eコマースサイト
- 自社サイト
- オフライン
- ハイパーマーケット・スーパーマーケット
- 百貨店
- 専門店
- その他の小売店
第11章 市場推計・予測:地域別、2021年~2032年
- 主要動向
- 北米
- 米国
- カナダ
- 欧州
- 英国
- ドイツ
- フランス
- イタリア
- スペイン
- ロシア
- アジア太平洋
- 中国
- インド
- 日本
- 韓国
- オーストラリア
- ラテンアメリカ
- ブラジル
- メキシコ
- 中東・アフリカ
- UAE
- サウジアラビア
- 南アフリカ
第12章 企業プロファイル
- Bandai Namco Holdings Inc.
- Fisher-Price
- Hasbro, Inc.
- Jakks Pacific, Inc.
- LeapFrog Enterprises, Inc.
- Mattel, Inc.
- MGA Entertainment, Inc.
- Moose Toys
- Playmobil
- Ravensburger AG
- Schleich GmbH
- Spin Master Corp.
- The LEGO Group
- Tomy Company, Ltd.
- VTech Holdings Ltd.
The Global Toy Market was valued at USD 108.7 billion in 2023 and is projected to expand at a CAGR of 5.8% between 2024 and 2032. Increasingly, parents are opting for toys that promote educational value, focusing on enhancing creativity, critical thinking, and problem-solving skills. This shift has driven the popularity of toys designed to combine learning with entertainment, particularly those catering to STEM (Science, Technology, Engineering, and Mathematics) education.
The market is segmented by product type into categories such as educational, construction, musical, game, doll and miniature, automotive, pretend play, and others. Among these, educational toys emerged as a significant segment, generating approximately USD 25 billion in revenue in 2023. This category is expected to grow at a CAGR of 6.5% during the forecast period. Educational toys increasingly incorporate cutting-edge technologies like artificial intelligence, robotics, and augmented reality to create immersive learning experiences. These advancements not only make learning engaging but also respond to the growing demand for toys that blend entertainment with developmental benefits.
| Market Scope | |
|---|---|
| Start Year | 2024 |
| Forecast Year | 2025-2034 |
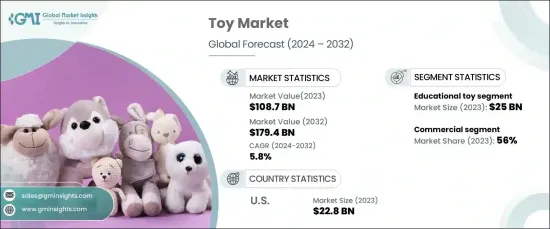
| Start Value | $108.7 Billion |
| Forecast Value | $179.4 Billion |
| CAGR | 5.8% |
By end use, the market is divided into individual and commercial segments. In 2023, the commercial segment accounted for about 56% of the market share and is forecasted to grow at a CAGR of 5.9% through 2032. Educational institutions such as schools and daycare centers are driving demand by purchasing these toys in bulk. The emphasis on early childhood education has positioned educational toys as indispensable tools for cognitive and social skill development. Additionally, these toys are increasingly being integrated into STEM learning programs, which aim to nurture problem-solving abilities and teamwork in children.
In North America, the United States led the market with revenue of approximately USD 22.8 billion in 2023. The market in the U.S. is anticipated to grow at a CAGR of 5.9% through 2032, fueled by the integration of advanced technologies in toys. Features such as virtual reality, augmented reality, and artificial intelligence are creating a new wave of interactive play, blending physical and digital elements. This trend resonates with children and technology enthusiasts alike.
Table of Contents
Chapter 1 Methodology & Scope
- 1.1 Market scope & definitions
- 1.2 Base estimates & calculations
- 1.3 Forecast calculations.
- 1.4 Data sources
- 1.4.1 Primary
- 1.4.2 Secondary
- 1.4.2.1 Paid sources
- 1.4.2.2 Public sources
Chapter 2 Executive Summary
- 2.1 Industry synopsis, 2021-2032
Chapter 3 Industry Insights
- 3.1 Industry ecosystem analysis
- 3.1.1 Factor affecting the value chain.
- 3.1.2 Profit margin analysis.
- 3.1.3 Disruptions
- 3.1.4 Future outlook
- 3.1.5 Manufacturers
- 3.1.6 Distributors
- 3.2 Supplier landscape
- 3.3 Profit margin analysis.
- 3.4 Key news & initiatives
- 3.5 Regulatory landscape
- 3.6 Impact forces
- 3.6.1 Growth drivers
- 3.6.1.1 Growing educational and STEM toys
- 3.6.1.2 E-commerce growth
- 3.6.2 Industry pitfalls & challenges
- 3.6.2.1 Price sensitivity
- 3.6.1 Growth drivers
- 3.7 Growth potential analysis
- 3.8 Porter’s analysis
- 3.9 PESTEL analysis
Chapter 4 Competitive Landscape, 2023
- 4.1 Introduction
- 4.2 Company market share analysis
- 4.3 Competitive positioning matrix
- 4.4 Strategic outlook matrix
Chapter 5 Market Estimates & Forecast, By Product Type, 2021-2032 (USD Billion) (Billion Units)
- 5.1 Key trends
- 5.2 Educational toy
- 5.3 Construction toy
- 5.4 Musical toy
- 5.5 Game toy
- 5.6 Doll & miniature
- 5.7 Automotive toy
- 5.8 Pretended play toy
- 5.9 Others (Art and Craft Toys, Musical Instruments etc.)
Chapter 6 Market Estimates & Forecast, By Price Range, 2021-2032 (USD Billion) (Billion Units)
- 6.1 Key trends
- 6.2 Low
- 6.3 Medium
- 6.4 High
Chapter 7 Market Estimates & Forecast, By Age Group, 2021-2032 (USD Billion) (Billion Units)
- 7.1 Key trends
- 7.2 Below 1 Yrs.
- 7.3 Age 1- 3
- 7.4 Age 3- 5
- 7.5 Age 5- 12
- 7.6 Age 12+
Chapter 8 Market Estimates & Forecast, By Material, 2021-2032 (USD Billion) (Billion Units)
- 8.1 Key trends
- 8.2 Plastic
- 8.3 Wooden
- 8.4 Metal
- 8.5 Fabric
- 8.6 Biodegradable/Organic Materials
Chapter 9 Market Estimates & Forecast, By End-use, 2021-2032 (USD Billion) (Billion Units)
- 9.1 Key trends
- 9.2 Individual
- 9.3 Commercial
Chapter 10 Market Estimates & Forecast, By Distribution Channel, 2021-2032 (USD Billion) (Billion Units)
- 10.1 Key trends
- 10.2 Online
- 10.2.1 E-Commerce website
- 10.2.2 Company owned website
- 10.3 Offline
- 10.3.1 Hypermarket/Supermarket
- 10.3.2 Departmental stores
- 10.3.3 Specialized stores
- 10.3.4 Other retail stores
Chapter 11 Market Estimates & Forecast, By Region, 2021-2032 (USD Billion) (Billion Units)
- 11.1 Key trends
- 11.2 North America
- 11.2.1 U.S.
- 11.2.2 Canada
- 11.3 Europe
- 11.3.1 UK
- 11.3.2 Germany
- 11.3.3 France
- 11.3.4 Italy
- 11.3.5 Spain
- 11.3.6 Russia
- 11.4 Asia Pacific
- 11.4.1 China
- 11.4.2 India
- 11.4.3 Japan
- 11.4.4 South Korea
- 11.4.5 Australia
- 11.5 Latin America
- 11.5.1 Brazil
- 11.5.2 Mexico
- 11.6 MEA
- 11.6.1 UAE
- 11.6.2 Saudi Arabia
- 11.6.3 South Africa
Chapter 12 Company Profiles
- 12.1 Bandai Namco Holdings Inc.
- 12.2 Fisher-Price
- 12.3 Hasbro, Inc.
- 12.4 Jakks Pacific, Inc.
- 12.5 LeapFrog Enterprises, Inc.
- 12.6 Mattel, Inc.
- 12.7 MGA Entertainment, Inc.
- 12.8 Moose Toys
- 12.9 Playmobil
- 12.10 Ravensburger AG
- 12.11 Schleich GmbH
- 12.12 Spin Master Corp.
- 12.13 The LEGO Group
- 12.14 Tomy Company, Ltd.
- 12.15 VTech Holdings Ltd.

