
|
市場調査レポート
商品コード
1876820
植物エキス市場の機会、成長要因、業界動向分析、および2025年から2034年までの予測Botanical Extracts Market Opportunity, Growth Drivers, Industry Trend Analysis, and Forecast 2025 - 2034 |
||||||
カスタマイズ可能
|
|||||||
| 植物エキス市場の機会、成長要因、業界動向分析、および2025年から2034年までの予測 |
|
出版日: 2025年11月04日
発行: Global Market Insights Inc.
ページ情報: 英文 190 Pages
納期: 2~3営業日
|

概要
世界の植物エキス市場は、2024年に300億米ドルと評価され、2034年までにCAGR8%で成長し、646億米ドルに達すると予測されています。
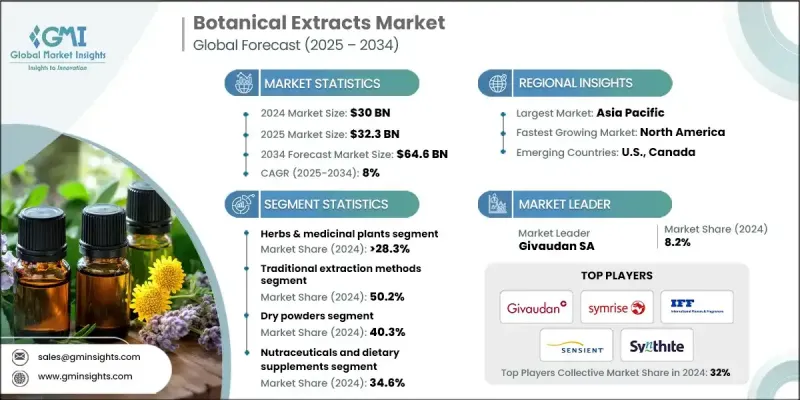
市場拡大の背景には、天然由来・植物由来成分への消費者志向の高まりがあります。合成添加物の健康影響に対する認識の向上により、飲食品・化粧品・栄養補助食品分野で治療効果を有する天然香料・抗酸化剤として植物抽出物の利用が促進されています。植物由来のこれらの抽出物は、薬理学的活性を通じて総合的な健康増進に重要な役割を果たします。パーソナルケア業界では、抗老化・抗炎症・肌鎮静効果を目的として広く採用され、天然由来のスキンケア製品への需要増加と合致しています。さらに、漢方薬・医薬品・栄養補助食品への応用により、免疫力向上・消化器健康・活力増進に貢献。機能性食品や伝統医療においても不可欠な存在であり、最も汎用性の高い天然原料の一つです。配合技術の継続的な革新と、クリーンラベル製品や持続可能な製品への世界的な移行により、植物抽出物の産業横断的な役割はさらに高まると予想されます。
| 市場範囲 | |
|---|---|
| 開始年 | 2024年 |
| 予測期間 | 2025-2034 |
| 開始時価値 | 300億米ドル |
| 予測金額 | 646億米ドル |
| CAGR | 8% |
ハーブおよび薬用植物セグメントは、2024年に28.3%のシェアを占め、2034年までCAGR 8.4%で成長すると予測されています。このセグメントは、何世紀にもわたる伝統的な使用と、科学的研究および規制当局の承認による有効性の増加により、その優位性を維持しています。これらの植物は、ホリスティックな健康と天然由来の治療効果を求める消費者の間で、引き続き注目を集めています。
超臨界流体抽出セグメントは2034年までCAGR 7.8%で成長する見込みです。この先進的な抽出プロセスは、溶剤残留物なしの高品質な抽出物の生産を可能にし、純度と濃度を精密に制御します。その効率性と環境に優しい特性から、特に医薬品や高級化粧品などの高付加価値用途において、優先的に採用される技術となっています。
北米植物エキス市場は2024年に34.8%のシェアを占め、2034年までCAGR 8.2%を維持すると予測されます。米国は2024年に81億米ドルの市場規模で地域市場を牽引しました。同地域の成長は主に、自然・有機・持続可能な製品に対する消費者意識の高まりによって推進されています。健康志向の消費者は、植物成分を豊富に含むハーブサプリメントや機能性食品をますます求めるようになっています。強力な規制枠組みと、抽出・加工技術の発展が相まって、北米における市場拡大をさらに促進しています。
世界の植物エキス市場で事業を展開している主要企業には、Synthite Industries、Givaudan SA、ケリー・グループ、ネクシラ、アルジュナ・ナチュラル、センシエント・テクノロジーズ、サビンサ・コーポレーション、IFF、ブルースカイ・ボタニックス、マーティン・バウアー・グループ、カルセック社、ランサム・ナチュラルズ、ドラー社、シンライズ社、インデナ社などが挙げられます。世界の植物エキス市場の主要企業は、市場での存在感を強化するため、イノベーション、生産能力の拡大、戦略的パートナーシップに注力しています。各社は、植物性化合物の収量、純度、持続可能性を高めるため、先進的な抽出技術に投資しています。多くの企業が、食品、化粧品、栄養補助食品分野向けに、標準化され、用途に特化した抽出物を開発することで、製品ポートフォリオの拡大を図っています。研究機関や原材料サプライヤーとの協力により、トレーサビリティと品質管理の向上に貢献しています。さらに、市場をリードする企業は、環境に配慮した加工方法やクリーンラベル認証を採用し、環境意識の高い消費者にアピールすることで、より強力なブランド差別化とグローバルな競争力を確保しています。
よくあるご質問
目次
第1章 調査手法と範囲
第2章 エグゼクティブサマリー
第3章 業界考察
- エコシステム分析
- サプライヤーの情勢
- 利益率
- 各段階における付加価値
- バリューチェーンに影響を与える要因
- ディスラプション
- 業界への影響要因
- 促進要因
- 業界の潜在的リスク&課題
- 市場機会
- 成長可能性分析
- 規制情勢
- 北米
- 欧州
- アジア太平洋地域
- ラテンアメリカ
- 中東・アフリカ
- ポーター分析
- PESTEL分析
- 価格動向
- 地域別
- ソース別
- 将来の市場動向
- 技術とイノベーションの動向
- 現在の技術動向
- 新興技術
- 特許状況
- 貿易統計(HSコード)(注:貿易統計は主要国のみ提供されます)
- 主要輸入国
- 主要輸出国
- 持続可能性と環境的側面
- 持続可能な取り組み
- 廃棄物削減戦略
- 生産におけるエネルギー効率
- 環境に配慮した取り組み
- カーボンフットプリントへの配慮
第4章 競合情勢
- イントロダクション
- 企業の市場シェア分析
- 地域別
- 北米
- 欧州
- アジア太平洋地域
- ラテンアメリカ
- 中東・アフリカ地域
- 地域別
- 企業マトリクス分析
- 主要市場企業の競合分析
- 競合ポジショニングマトリックス
- 主な発展
- 合併・買収
- 提携・協力関係
- 新製品の発売
- 事業拡大計画
第5章 市場推計・予測:ソース別、2021-2034
- 主要動向
- 香辛料・調味料
- トウガラシ・胡椒エキス
- ショウガ及びウコンエキス
- その他のスパイスエキス
- ハーブ及び薬用植物
- アダプトゲンハーブ(アシュワガンダ、高麗人参)
- 伝統的な薬用ハーブ
- 食用・芳香ハーブ
- 果実・ベリー類
- 抗酸化物質豊富なベリーエキス
- 柑橘類の果実エキス
- 熱帯・エキゾチックフルーツエキス
- 花と花びら
- ローズ及びフローラルエキス
- カモミール及びキンセンカエキス
- その他の花エキス
- 茶・コーヒーの植物
- 緑茶・紅茶エキス
- コーヒーチェリー及びコーヒー豆エキス
- スペシャルティティーエキス
- 葉と葉類
- アロエベラ及び多肉植物エキス
- ミント及び芳香性葉エキス
- その他の葉エキス
- 根と根茎
- 高麗人参及びアダプトゲン根エキス
- ウコン及びショウガ根エキス
- その他の根・根茎エキス
- 海藻類・藻類
- スピルリナ及びクロレラエキス
- 海藻・昆布エキス
- その他の海藻類・藻類エキス
第6章 市場推計・予測:抽出技術別、2021-2034
- 主要動向
- 従来の抽出方法
- 超臨界流体抽出
- 高度な溶媒抽出法
- グリーン抽出技術
- 機械的抽出法
第7章 市場推計・予測:形態別、2021-2034
- 主要動向
- 乾燥粉末
- 液体抽出物
- ソフトエキス
- カプセル化形態
- 油性抽出物
第8章 市場推計・予測:最終用途産業別、2021-2034
- 主要動向
- ニュートラシューティカルズ・栄養補助食品
- カプセル・錠剤
- 機能性原料の用途
- スポーツ栄養製品
- 機能性飲食品
- 強化食品
- 健康・エナジードリンク
- 機能性スナック・バー
- 医薬品・漢方薬
- 医薬品原薬
- 医薬品添加剤
- 伝統医学・漢方薬
- 化粧品・パーソナルケア
- スキンケア製品
- ヘアケア用途
- カラー化粧品・香料
- 食品加工・保存
- 天然保存料
- 風味増強剤
- 天然着色料
- 動物飼料・ペット栄養
- 家畜飼料添加物
- ペット用サプリメント
- 獣医学用途
- 工業用途
- 香料・アロマテラピー
- 洗浄製品
- その他の工業用途
- その他
第9章 市場推計・予測:地域別、2021-2034
- 主要動向
- 北米
- 米国
- カナダ
- 欧州
- ドイツ
- 英国
- フランス
- スペイン
- イタリア
- その他欧州地域
- アジア太平洋地域
- 中国
- インド
- 日本
- オーストラリア
- 韓国
- その他アジア太平洋地域
- ラテンアメリカ
- ブラジル
- メキシコ
- アルゼンチン
- その他ラテンアメリカ地域
- 中東・アフリカ
- サウジアラビア
- 南アフリカ
- アラブ首長国連邦
- その他中東・アフリカ地域
第10章 企業プロファイル
- Arjuna Natural
- Blue Sky Botanics
- Dohler GmbH
- Givaudan SA
- IFF
- Indena S.p.A.
- Kalsec Inc.
- Kerry Group plc
- Martin Bauer Group
- Nexira
- Ransom Naturals
- Sabinsa Corporation
- Sensient Technologies
- Symrise AG
- Synthite Industries

