
|
市場調査レポート
商品コード
1822609
再生可能エネルギー炭素クレジットの市場機会、成長促進要因、産業動向分析、2025年~2034年予測Renewable Energy Carbon Credit Market Opportunity, Growth Drivers, Industry Trend Analysis, and Forecast 2025 - 2034 |
||||||
カスタマイズ可能
|
|||||||
| 再生可能エネルギー炭素クレジットの市場機会、成長促進要因、産業動向分析、2025年~2034年予測 |
|
出版日: 2025年08月28日
発行: Global Market Insights Inc.
ページ情報: 英文 132 Pages
納期: 2~3営業日
|

概要
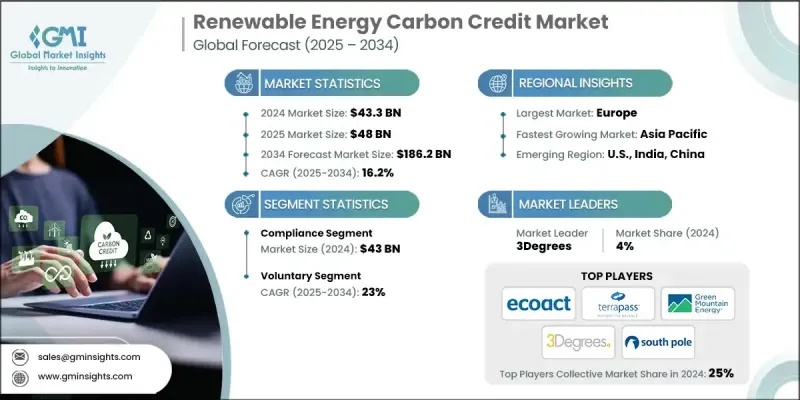
Global Market Insights Inc.が発行した最新レポートによると、世界の再生可能エネルギー炭素クレジット市場は2024年に433億米ドルと推定され、CAGR16.2%で2025年の480億米ドルから2034年には1,862億米ドルに成長すると予測されています。
世界中の政府や企業が積極的なネットゼロ目標を設定しているため、再生可能エネルギー発電プロジェクトで生成された炭素クレジットの需要が急増しています。これらのクレジットは、現在の排出量と長期的な脱炭素化目標とのギャップを埋めるのに役立ちます。
| 市場範囲 | |
|---|---|
| 開始年 | 2024 |
| 予測年 | 2025-2034 |
| 市場規模 | 433億米ドル |
| 予測金額 | 1,862億米ドル |
| CAGR | 16.2% |
コンプライアンスが牽引役に
2024年には、政府による排出削減目標や規制の枠組みによって、コンプライアンス分野が顕著なシェアを占める。キャップ・アンド・トレードや再生可能エネルギー・ポートフォリオ基準のようなプログラムでは、企業は排出量の一部を相殺する必要があり、認定再生可能エネルギー・クレジットの安定した需要を後押ししています。この分野は、体系化された監督と標準化されたプロトコルの恩恵を受け、市場参入企業により予測可能性を提供しています。
ボランタリーセグメントでの採用増加
企業、機関、個人が、規制による義務付けを超えて、持続可能性に向けた積極的な取り組みを行うにつれて、自主的なセグメントは2025年から2034年にかけて、まずまずのCAGRで成長すると思われます。企業は、気候変動に対するリーダーシップを示し、社内のネット・ゼロ目標を達成し、ESG報告を強化するために、再生可能エネルギー炭素クレジットを購入しています。この分野は柔軟性に富んでおり、地域密着型の太陽光発電所や小規模な風力開発など、自社のブランド価値に合致したプロジェクトを購入者が選択しています。
地域別の洞察
有利な地域として浮上する欧州
欧州再生可能エネルギー炭素クレジット市場は、野心的な気候政策、成熟した炭素取引制度、再生可能技術の普及に支えられ、2024年に大きな収益を上げました。EU排出権取引制度(EUETS)に代表されるこの地域の強力なコンプライアンス・インフラは、炭素価格設定と透明性の世界標準となっています。同時に、欧州企業がネット・ゼロの約束を推進し、国境を越えたクリーン・エネルギー・プロジェクトに資金を提供しようとしていることから、自主的な参加も増加しています。
再生可能エネルギー炭素クレジット市場の主なプレーヤーは、WayCarbon、Carbon Credit Capital, LLC.、TerraPass、Native Energy、Climate Impact Partners、Atmosfair、The Carbon Collective Company、Carbon Better、EcoAct、ClimeCo LLC.、South Pole、ALLCOT、Sterling Planet Inc.、PwC、Green Mountain Energy Company、3Degrees、CarbonClear、Ecosecurities、The Carbon Trust、Carbon Directです。
再生可能エネルギー炭素クレジット分野で事業を展開する企業は、その地位を強化するために、信頼性、拡張性、デジタル革新に注力しています。その多くは、再生可能エネルギー開発業者と直接提携し、新規プロジェクトからの長期的なクレジット供給を確保することで、追加性と将来の収益源を確保しています。また、衛星データやAIを含む高度な監視・報告技術に投資し、クレジットインパクトの検証やバイヤーとの信頼獲得に取り組んでいる企業もあります。市場のリーダー企業は、取引プラットフォームを合理化し、より高い透明性を提供するために、フィンテック企業との戦略的提携にも乗り出しています。さらに、地域の気候変動目標に合わせたクレジットの提供や、ICVCMやVCMIなどのグローバルスタンダードとの整合性を図ることで、評判と競争力を高め、国際的に事業を拡大している企業もあります。
目次
第1章 調査手法と範囲
第2章 エグゼクティブサマリー
第3章 業界考察
- エコシステム分析
- 規制情勢
- 業界への影響要因
- 促進要因
- 業界の潜在的リスク&課題
- 成長可能性分析
- ポーター分析
- PESTEL分析
- 新たな機会と動向
- デジタル化とIoTの統合
- 新興市場への浸透
第4章 競合情勢
- イントロダクション
- 企業の市場シェア分析:地域別
- 北米
- 欧州
- アジア太平洋地域
- 中東・アフリカ
- ラテンアメリカ
- 戦略的取り組み
- 競合ベンチマーキング
- 戦略的ダッシュボード
- イノベーションとテクノロジーの情勢
第5章 市場規模・予測:タイプ別、2021-2034
- 主要動向
- ボランタリー
- コンプライアンス
第6章 市場規模・予測:地域別、2021-2034
- 主要動向
- 北米
- 欧州
- アジア太平洋地域
- 中東・アフリカ
- ラテンアメリカ
第7章 企業プロファイル
- 3Degrees
- Atmosfair
- ALLCOT
- Carbon Better
- Carbon Credit Capital, LLC.
- Carbon Direct
- ClimeCo LLC.
- Climate Impact Partners
- CarbonClear
- Ecosecurities
- EcoAct
- Green Mountain Energy Company
- Native Energy
- PwC
- Sterling Planet Inc.
- South Pole
- The Carbon Trust
- The Carbon Collective Company
- TerraPass
- WayCarbon

