
|
市場調査レポート
商品コード
1716692
オンショア風力エネルギー市場の機会、成長促進要因、産業動向分析、2025年~2034年の予測Onshore Wind Energy Market Opportunity, Growth Drivers, Industry Trend Analysis, and Forecast 2025 - 2034 |
||||||
カスタマイズ可能
|
|||||||
| オンショア風力エネルギー市場の機会、成長促進要因、産業動向分析、2025年~2034年の予測 |
|
出版日: 2025年03月05日
発行: Global Market Insights Inc.
ページ情報: 英文 150 Pages
納期: 2~3営業日
|

全表示
- 概要
- 目次
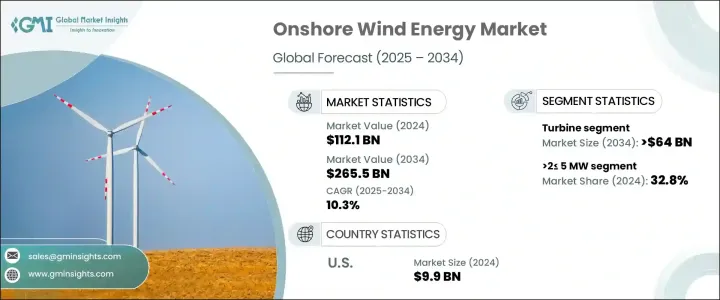
世界のオンショア風力エネルギー市場は、2024年に1,121億米ドルと評価され、2025年から2034年にかけてCAGR 10.3%で成長すると予測されています。
この成長の主な要因は、クリーンで再生可能なエネルギー源に対する需要の急増と、二酸化炭素排出量の削減や持続可能な開発目標の支援を目的とした政府のイニシアティブです。世界各国は化石燃料からの脱却に向けた取り組みを強化しており、オンショア風力エネルギーは最も費用対効果が高く、スケーラブルなソリューションの一つとして際立っています。世界経済が再生可能エネルギー目標の達成を迫られる中、陸上風力発電プロジェクトは、有利な規制枠組み、技術コストの低下、最新型風力タービンの効率向上により、勢いを増しています。
政策立案者は、風力エネルギー開発を促進するために、合理化された許認可プロセスを導入し、税額控除を提供し、インセンティブ・プログラムを展開しており、市場関係者がポートフォリオを拡大するのに非常に有利な環境を作り出しています。さらに、タービンの設計と制御システムにおける技術革新により、容量係数が大幅に改善され、平準化エネルギーコスト(LCOE)が削減され、陸上風力発電プロジェクトがより経済的に実行可能なものとなっています。気候目標が強化され、特に新興国を中心にエネルギー需要が急増する中、世界市場は今後10年間で大幅な容量増を記録する見通しです。
| 市場範囲 | |
|---|---|
| 開始年 | 2024 |
| 予測年 | 2025-2034 |
| 開始金額 | 1,121億米ドル |
| 予測金額 | 2,655億米ドル |
| CAGR | 10.3% |
連邦および州レベルの奨励措置の着実な実施、政府の強力な義務付け、積極的な再生可能エネルギー目標が、オンショア風力エネルギー市場の強力な成長触媒として作用しています。急速な都市化、産業の拡大、特に発展途上地域におけるエネルギー消費の増加は、陸上風力発電プロジェクトの開発をさらに加速させています。ブラジル、メキシコ、アルゼンチンといった国々は、豊富な風力資源だけでなく、積極的な政府支援や魅力的な投資枠組みを提供する有望な市場として台頭してきています。これらの国々では、風力エネルギー・インフラの拡大を目指したプロジェクトの発表や海外からの投資が増加しています。送電網インフラの近代化に向けた並行投資は、風力発電の国家エネルギーシステムへの統合を促進し、風力発電電力の信頼性と効率を高めています。
オンショア風力エネルギー市場は、タービン、支持構造、電気インフラ、その他に区分され、タービンが主要な構成要素となっています。厳しい再生可能エネルギー発電義務に対応した大容量で効率的なタービンの需要増に後押しされ、タービン分野だけで2034年までに640億米ドルの市場規模が見込まれています。より高いタワー、より長いブレード、高度なグリッド統合機能など、タービン技術の進歩により、より高いエネルギー出力と多様な風況への適応性が可能になり、陸上風力発電設備は投資家にとっても電力会社にとっても魅力的なものとなっています。
タービンの定格では、2MWから5MWのシステムが2024年の市場シェアの32.8%を占めているが、これは容量、コスト、グリッド適合性のバランスが最適であるためです。これらのタービンは、空間的または技術的制約のある中程度の出力を必要とするプロジェクトに特に適しています。また、制御システムの強化や高度なソフトウェアの統合により、タービンの性能が向上し、エネルギー収量が向上し、ダウンタイムが最小限に抑えられています。
北米は、長期的な連邦政府のインセンティブと風力発電技術の費用対効果の進歩に支えられ、2024年のオンショア風力エネルギー世界市場シェアの8.6%を占めました。継続的な政策支援と技術改善により、北米は将来の市場成長を牽引する極めて重要な地域であることに変わりはないです。
目次
第1章 調査手法と調査範囲
第2章 エグゼクティブサマリー
第3章 業界洞察
- 業界エコシステム
- 規制状況
- 業界への影響要因
- 促進要因
- 業界の潜在的リスク&課題
- 成長可能性分析
- ポーター分析
- PESTEL分析
第4章 競合情勢
- イントロダクション
- 戦略ダッシュボード
- イノベーションとテクノロジーの展望
第5章 市場規模・予測:コンポーネント別、2021年~2034年
- 主要動向
- タービン
- タワー
- ブレード
- その他
- 支持構造
- 下部構造
- ファンデーション
- その他
- 電気インフラ
- 電線・ケーブル
- 変電所
- その他
- その他
第6章 市場規模・予測:タービン定格別、2021年~2034年
- 主要動向
- 2 MW以下
- 2~5 MW
- 5~8 MW
- 8~10 MW
- 10~12MW
- 12MW超
第7章 市場規模・予測:地域別、2021~2034年
- 主要動向
- 北米
- 米国
- カナダ
- 欧州
- ドイツ
- オランダ
- スウェーデン
- フランス
- 英国
- フィンランド
- ポーランド
- スペイン
- イタリア
- オーストリア
- アイルランド
- ベルギー
- アジア太平洋
- 中国
- インド
- 日本
- オーストラリア
- 世界のその他の地域
第8章 企業プロファイル
- CRRC
- CSSC Haizhuang Wind Power
- Envision Group
- Goldwind
- GE Vernova
- Iberdrola
- Nordex
- Siemens Gamesa Renewable Energy
- United Power
- Vestas
- Windey Energy Technology Group
The Global Onshore Wind Energy Market was valued at USD 112.1 billion in 2024 and is projected to grow at a CAGR of 10.3% between 2025 and 2034. This growth is largely fueled by a surge in demand for clean, renewable energy sources, combined with government-backed initiatives aimed at reducing carbon emissions and supporting sustainable development goals. Countries worldwide are ramping up efforts to transition away from fossil fuels, and onshore wind energy stands out as one of the most cost-effective and scalable solutions. As economies worldwide face increasing pressure to meet their renewable energy targets, onshore wind projects are gaining momentum, driven by favorable regulatory frameworks, declining technology costs, and improved efficiency of modern wind turbines.
Policymakers are introducing streamlined permitting processes, offering tax credits, and deploying incentive programs to foster wind energy development, creating a highly conducive environment for market players to expand their portfolios. In addition, technological innovations in turbine design and control systems are significantly improving capacity factors and reducing the levelized cost of energy (LCOE), making onshore wind projects more financially viable. As climate goals tighten and energy demand soars, particularly across emerging economies, the global market is on track to witness substantial capacity additions over the next decade.
| Market Scope | |
|---|---|
| Start Year | 2024 |
| Forecast Year | 2025-2034 |
| Start Value | $112.1 Billion |
| Forecast Value | $265.5 Billion |
| CAGR | 10.3% |
The steady implementation of federal and state-level incentives, robust government mandates, and aggressive renewable energy targets are acting as strong growth catalysts for the onshore wind energy market. Rapid urbanization, industrial expansion, and increasing energy consumption, especially in developing regions, are further accelerating the deployment of onshore wind projects. Countries such as Brazil, Mexico, and Argentina are emerging as promising markets, offering not only abundant wind resources but also proactive government support and attractive investment frameworks. These countries are witnessing a growing number of project announcements and foreign investments aimed at expanding their wind energy infrastructure. Parallel investments in modernizing grid infrastructure are facilitating better integration of wind power into national energy systems, enhancing the reliability and efficiency of wind-generated electricity.
The onshore wind energy market is segmented into turbines, support structures, electrical infrastructure, and others, with turbines dominating as the leading component. The turbine segment alone is anticipated to generate USD 64 billion by 2034, propelled by the increasing demand for high-capacity, efficient turbines that align with stringent renewable energy mandates. Advancements in turbine technology, including taller towers, longer blades, and sophisticated grid integration capabilities, are enabling higher energy outputs and greater adaptability to diverse wind conditions, making onshore wind installations more attractive for investors and utilities alike.
In terms of turbine rating, systems ranging from 2 MW to 5 MW held 32.8% of the market share in 2024, owing to their optimal balance between capacity, cost, and grid compatibility. These turbines are particularly favored for projects requiring moderate output with spatial or technical constraints. Enhanced control systems and advanced software integrations are also boosting turbine performance, improving energy yields, and minimizing downtime.
North America accounted for 8.6% of the global onshore wind energy market share in 2024, backed by long-term federal incentives and advancements in wind power technology cost-effectiveness. With continuous policy support and technology improvements, North America remains a pivotal region driving future market growth.
Table of Contents
Chapter 1 Methodology & Scope
- 1.1 Research Design
- 1.2 Base estimates & calculations
- 1.3 Forecast model
- 1.4 Primary research & validation
- 1.4.1 Primary sources
- 1.4.2 Data mining sources
- 1.5 Market Definitions
Chapter 2 Executive Summary
- 2.1 Industry synopsis, 2021 – 2034
Chapter 3 Industry Insights
- 3.1 Industry ecosystem
- 3.2 Regulatory landscape
- 3.3 Industry impact forces
- 3.3.1 Growth drivers
- 3.3.2 Industry pitfalls & challenges
- 3.4 Growth potential analysis
- 3.5 Porter's analysis
- 3.5.1 Bargaining power of suppliers
- 3.5.2 Bargaining power of buyers
- 3.5.3 Threat of new entrants
- 3.5.4 Threat of substitutes
- 3.6 PESTEL analysis
Chapter 4 Competitive landscape, 2024
- 4.1 Introduction
- 4.2 Strategic dashboard
- 4.3 Innovation & technology landscape
Chapter 5 Market Size and Forecast, By Component, 2021 – 2034 (USD Million)
- 5.1 Key trends
- 5.2 Turbine
- 5.2.1 Tower
- 5.2.2 Blades
- 5.2.3 Others
- 5.3 Support structure
- 5.3.1 Substructure steel
- 5.3.2 Foundation
- 5.3.3 Others
- 5.4 Electrical infrastructure
- 5.4.1 Wires & Cables
- 5.4.2 Substation
- 5.4.3 Others
- 5.5 Others
Chapter 6 Market Size and Forecast, By Turbine Rating, 2021 – 2034 (USD Million & MW)
- 6.1 Key trends
- 6.2 ≤ 2 MW
- 6.3 >2≤ 5 MW
- 6.4 >5≤ 8 MW
- 6.5 >8≤10 MW
- 6.6 >10≤ 12 MW
- 6.7 > 12 MW
Chapter 7 Market Size and Forecast, By Region, 2021 – 2034 (USD Million & MW)
- 7.1 Key trends
- 7.2 North America
- 7.2.1 U.S.
- 7.2.2 Canada
- 7.3 Europe
- 7.3.1 Germany
- 7.3.2 Netherlands
- 7.3.3 Sweden
- 7.3.4 France
- 7.3.5 UK
- 7.3.6 Finland
- 7.3.7 Poland
- 7.3.8 Spain
- 7.3.9 Italy
- 7.3.10 Austria
- 7.3.11 Ireland
- 7.3.12 Belgium
- 7.4 Asia Pacific
- 7.4.1 China
- 7.4.2 India
- 7.4.3 Japan
- 7.4.4 Australia
- 7.5 Rest of World
Chapter 8 Company Profiles
- 8.1 CRRC
- 8.2 CSSC Haizhuang Wind Power
- 8.3 Envision Group
- 8.4 Goldwind
- 8.5 GE Vernova
- 8.6 Iberdrola
- 8.7 Nordex
- 8.8 Siemens Gamesa Renewable Energy
- 8.9 United Power
- 8.10 Vestas
- 8.11 Windey Energy Technology Group

