|
|
市場調査レポート
商品コード
1716697
e-fuel(合成燃料)市場の機会、成長促進要因、産業動向分析、2025年~2034年の予測E-Fuel Market Opportunity, Growth Drivers, Industry Trend Analysis, and Forecast 2025 - 2034 |
||||||

|
|||||||
カスタマイズ可能
|
|||||||

| e-fuel(合成燃料)市場の機会、成長促進要因、産業動向分析、2025年~2034年の予測 |
|
出版日: 2025年03月31日
発行: Global Market Insights Inc.
ページ情報: 英文 131 Pages
納期: 2~3営業日
|

全表示
- 概要
- 目次
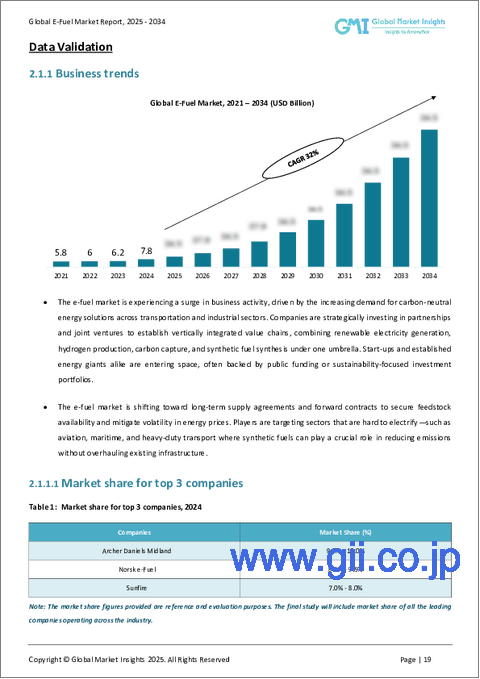
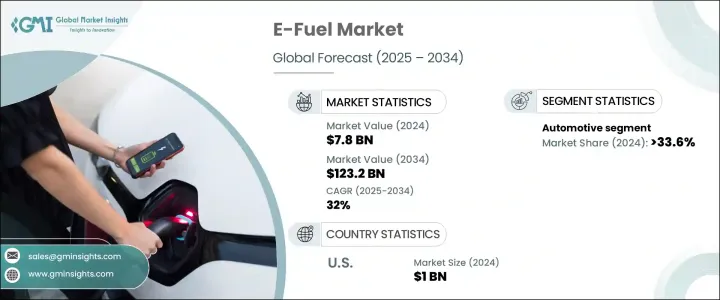
世界のe-fuel(合成燃料)市場は、2024年には78億米ドルと評価され、2025年から2034年にかけてCAGR 32%という著しい成長を遂げると予測されています。
この成長は、再生可能エネルギー技術の進歩、環境意識の高まり、炭素排出規制の厳格化が主な要因です。e-fuel(合成燃料)は、水素燃料電池やバッテリー電気自動車(BEV)の限界を克服する有望なソリューションとして台頭してきており、実行可能なエネルギー貯蔵オプションを提供しています。世界各国の政府は、e-fuel(合成燃料)の開発を奨励する有利な政策やインセンティブを導入しており、これが関連インフラへの投資を促進しています。
環境問題、特に航空、海運、重輸送といった産業からの温室効果ガス排出に対する懸念の高まりが、代替エネルギー・ソリューションの需要に拍車をかけています。これらのセクターは脱炭素化が困難なため、e-fuel(合成燃料)が有力な選択肢となっています。多くの地域が再生可能燃料をエネルギーシステムに統合する枠組みを確立しており、政府の規制とインセンティブはe-fuel(合成燃料)の採用を促進する上で重要な役割を果たしています。
| 市場範囲 | |
|---|---|
| 開始年 | 2024 |
| 予測年 | 2025-2034 |
| 開始金額 | 78億米ドル |
| 予測金額 | 1,232億米ドル |
| CAGR | 32% |
電子燃料製造プロセスにおける技術の進歩と革新も市場成長に寄与しています。電気分解と炭素回収の方法が改善されたことで、生産コストが下がり、e-fuel(合成燃料)の経済性が高まっています。風力発電や太陽光発電などの再生可能エネルギーをe-fuel(合成燃料)生産に統合することで、二酸化炭素排出量と運転経費が削減され、業界の拡大をさらに後押ししています。
e-fuel(合成燃料)市場は製品タイプによって区分され、e-ガソリン、e-ディーゼル、e-ケロシン、e-メタノール、エタノールが含まれます。中でもe-ガソリンは、既存の内燃機関(ICE)車のドロップイン燃料として、特に自動車分野で人気を集めています。この成長の背景には、現在のインフラに大きな変更を加えることなく自動車産業を脱炭素化したいという願望があります。
用途別では、市場は主に自動車、船舶、航空、産業セクターに分けられ、2024年の市場シェアは自動車セクターが33.6%以上を占める。自動車用e-fuel(合成燃料)分野は、特にインフラやコストの障壁が電気自動車(EV)の普及を妨げている地域において、内燃機関からの排出ガスを削減するための重要な戦略として成長しています。e-ガソリンやe-ディーゼルのようなe-fuel(合成燃料)は実用的な解決策を提供し、既存の給油所や自動車エンジンが混乱することなく運転を継続できるようにします。
米国では、e-fuel(合成燃料)市場は急成長を遂げており、その市場規模は2022年の7億米ドルから2024年には10億米ドルに増加します。この成長には、持続可能なエネルギー技術にインセンティブを与えるインフレ削減法のような取り組みが大きく寄与しています。さらに、全国の施設でe-fuelを生産する企業間の提携もこの成長に寄与しており、配送車両への電力供給と従来の燃料源への依存度の低減に重点が置かれています。
目次
第1章 調査手法と調査範囲
第2章 エグゼクティブサマリー
第3章 業界洞察
- エコシステム分析
- 規制状況
- 業界への影響要因
- 促進要因
- 業界の潜在的リスク&課題
- 成長ポテンシャル分析
- ポーター分析
- PESTEL分析
第4章 競合情勢
- イントロダクション
- 戦略ダッシュボード
- イノベーションと持続可能性の展望
第5章 市場規模・予測:再生可能エネルギー源別、2021年~2034年
- 主要動向
- オンサイト・ソーラー
- 風力
第6章 市場規模・予測:技術別、2021年~2034年
- 主要動向
- フィッシャー・トロプシュ
- eRWGS
- その他
第7章 市場規模・予測:製品別、2021年~2034年
- 主要動向
- Eガソリン
- Eディーゼル
- E-ケロシン
- エタノール
- メタノール
- その他
第8章 市場規模・予測:用途別、2021年~2034年
- 主要動向
- 自動車
- 海洋
- 航空
- 産業
- その他
第9章 市場規模・予測:地域別、2021年~2034年
- 主要動向
- 北米
- 米国
- カナダ
- 欧州
- 英国
- ドイツ
- フランス
- オランダ
- スペイン
- アジア太平洋
- 中国
- インド
- 日本
- 韓国
- オーストラリア
- 中東・アフリカ
- サウジアラビア
- アラブ首長国連邦
- 南アフリカ
- ラテンアメリカ
- ブラジル
- アルゼンチン
第10章 企業プロファイル
- Arcadia eFuels
- Archer Daniels Midland
- Ballard Power Systems
- Ceres Power Holding
- Clean Fuels Alliance America
- Climeworks
- Electrochaea
- eFuel Pacific
- ExxonMobil
- FuelCell Energy
- HIF Global
- Infra Synthetic Fuels
- LanzaJet
- Liquid Wind
- MAN Energy Solutions
- Norsk e-Fuel
- Porsche
- Sunfire
The Global E-Fuel Market was valued at USD 7.8 billion in 2024 and is projected to grow at a remarkable CAGR of 32% from 2025 to 2034. This growth can largely be attributed to advancements in renewable energy technologies, increasing environmental awareness, and stricter carbon emission regulations. E-fuels are emerging as a promising solution to overcome the limitations of hydrogen fuel cells and battery electric vehicles (BEVs), offering a viable energy storage option. Governments worldwide are introducing favorable policies and incentives that encourage the development of e-fuels, which is driving investments in related infrastructure.
The rise in environmental concerns, particularly about greenhouse gas emissions from industries like aviation, shipping, and heavy transport, is spurring the demand for alternative energy solutions. These sectors are difficult to decarbonize, making e-fuels a compelling choice. Government regulations and incentives play a crucial role in facilitating e-fuel adoption, with many regions establishing frameworks for integrating renewable fuels into their energy systems.
| Market Scope | |
|---|---|
| Start Year | 2024 |
| Forecast Year | 2025-2034 |
| Start Value | $7.8 Billion |
| Forecast Value | $123.2 Billion |
| CAGR | 32% |
Technological advancements and innovations in the e-fuel production process are also contributing to market growth. Improved methods for electrolysis and carbon capture are helping lower production costs and increase the economic viability of e-fuels. The integration of renewable energy sources, such as wind and solar power, into e-fuel production is reducing the carbon footprint and operational expenses, further supporting industry expansion.
The e-fuel market is segmented based on product type, with categories including e-gasoline, e-diesel, e-kerosene, e-methanol, and ethanol. Among these, e-gasoline is gaining popularity, particularly in the automotive sector, as a drop-in fuel for existing internal combustion engine (ICE) vehicles. This growth is driven by the desire to decarbonize the automobile industry without requiring significant changes to the current infrastructure.
By application, the market is primarily divided into automotive, marine, aviation, and industrial sectors, with the automotive sector accounting for over 33.6% of the market share in 2024. The automotive e-fuel segment is growing as a key strategy to reduce emissions from ICE vehicles, especially in regions where the infrastructure or cost barriers hinder the widespread adoption of electric vehicles (EVs). E-fuels like e-gasoline and e-diesel provide a practical solution, enabling existing fuel stations and vehicle engines to continue operating without disruption.
In the U.S., the e-fuel market has seen rapid growth, with values increasing from USD 0.7 billion in 2022 to USD 1 billion in 2024. This growth is largely fueled by initiatives like the Inflation Reduction Act, which provides incentives for sustainable energy technologies. Additionally, partnerships between companies to produce e-fuel in facilities across the country are contributing to this growth, with a focus on powering delivery fleets and reducing reliance on traditional fuel sources.
Table of Contents
Chapter 1 Methodology & Scope
- 1.1 Market definitions
- 1.2 Base estimates & calculations
- 1.3 Forecast calculation
- 1.4 Data sources
- 1.4.1 Primary
- 1.4.2 Secondary
- 1.4.2.1 Paid
- 1.4.2.2 Public
Chapter 2 Executive Summary
- 2.1 Industry synopsis, 2021 - 2034
Chapter 3 Industry Insights
- 3.1 Industry ecosystem analysis
- 3.2 Regulatory landscape
- 3.3 Industry impact forces
- 3.3.1 Growth drivers
- 3.3.2 Industry pitfalls & challenges
- 3.4 Growth potential analysis
- 3.5 Porter's analysis
- 3.5.1 Bargaining power of suppliers
- 3.5.2 Bargaining power of buyers
- 3.5.3 Threat of new entrants
- 3.5.4 Threat of substitutes
- 3.6 PESTEL analysis
Chapter 4 Competitive landscape, 2024
- 4.1 Introduction
- 4.2 Strategic dashboard
- 4.3 Innovation & sustainability landscape
Chapter 5 Market Size and Forecast, By Renewable Source, 2021 - 2034 (USD Billion)
- 5.1 Key trends
- 5.2 On-site solar
- 5.3 Wind
Chapter 6 Market Size and Forecast, By Technology, 2021 - 2034 (USD Billion)
- 6.1 Key trends
- 6.2 Fischer-tropsch
- 6.3 eRWGS
- 6.4 Others
Chapter 7 Market Size and Forecast, By Product, 2021 - 2034 (USD Billion)
- 7.1 Key trends
- 7.2 E-Gasoline
- 7.3 E-Diesel
- 7.4 E-Kerosene
- 7.5 Ethanol
- 7.6 E-Methanol
- 7.7 Others
Chapter 8 Market Size and Forecast, By Application, 2021 - 2034 (USD Billion)
- 8.1 Key trends
- 8.2 Automotive
- 8.3 Marine
- 8.4 Aviation
- 8.5 Industrial
- 8.6 Others
Chapter 9 Market Size and Forecast, By Region, 2021 - 2034 (USD Billion)
- 9.1 Key trends
- 9.2 North America
- 9.2.1 U.S.
- 9.2.2 Canada
- 9.3 Europe
- 9.3.1 UK
- 9.3.2 Germany
- 9.3.3 France
- 9.3.4 Netherlands
- 9.3.5 Spain
- 9.4 Asia Pacific
- 9.4.1 China
- 9.4.2 India
- 9.4.3 Japan
- 9.4.4 South Korea
- 9.4.5 Australia
- 9.5 Middle East & Africa
- 9.5.1 Saudi Arabia
- 9.5.2 UAE
- 9.5.3 South Africa
- 9.6 Latin America
- 9.6.1 Brazil
- 9.6.2 Argentina
Chapter 10 Company Profiles
- 10.1 Arcadia eFuels
- 10.2 Archer Daniels Midland
- 10.3 Ballard Power Systems
- 10.4 Ceres Power Holding
- 10.5 Clean Fuels Alliance America
- 10.6 Climeworks
- 10.7 Electrochaea
- 10.8 eFuel Pacific
- 10.9 ExxonMobil
- 10.10 FuelCell Energy
- 10.11 HIF Global
- 10.12 Infra Synthetic Fuels
- 10.13 LanzaJet
- 10.14 Liquid Wind
- 10.15 MAN Energy Solutions
- 10.16 Norsk e-Fuel
- 10.17 Porsche
- 10.18 Sunfire

