|
|
市場調査レポート
商品コード
1481319
産業用配電変圧器の市場規模:コア別、巻線別、設置別、冷却別、絶縁別、定格別、取付別、予測、2024-2032年Industrial Distribution Transformer Market Size - By Core, By Winding, By Cooling, By Insulation, By Rating, By Mounting, Installation & Forecast, 2024 - 2032 |
||||||
カスタマイズ可能
|
|||||||
| 産業用配電変圧器の市場規模:コア別、巻線別、設置別、冷却別、絶縁別、定格別、取付別、予測、2024-2032年 |
|
出版日: 2024年03月04日
発行: Global Market Insights Inc.
ページ情報: 英文 920 Pages
納期: 2~3営業日
|
全表示
- 概要
- 目次
産業用配電変圧器の市場規模は、2024年から2032年にかけてCAGR 9%超と予測されます。
急速な都市化、工業化、インフラ整備に起因する世界の電力需要の増加が、配電網における配電変圧器の必要性を煽っています。特に新興経済諸国では、既存の電力インフラの近代化と拡張が、老朽化した変圧器の交換とアップグレードを促進しています。米国エネルギー情報局(EIA)によると、2022年の米国の総電力消費量は約4兆700億kWhでした。この電力需要の増加が、産業用配電変圧器の魅力を高めています。
太陽光発電や風力発電のような再生可能エネルギー源のグリッドへの統合が進むにつれ、エネルギーの送配電を促進するための配電変圧器の設置も必要となっています。最近では、より効率的で環境に優しいユニットの開発など、変圧器技術の進歩も著しいです。政府のイニシアティブの高まりも、エネルギー効率と送電網の近代化を促進し、業界の発展をさらに後押ししています。
産業用配電変圧器産業は、コア、巻線、設置、冷却、絶縁、定格、取付、地域に分別されます。
コアに基づくと、ベリーセグメントからの市場需要は2032年まで称賛に値する速度で上昇します。ベリーコアは高効率でコンパクトな設計のため、様々な産業用途に適しています。磁気特性の改善や損失の低減など、ベリーコア技術の開発が進み、変圧器の性能が向上しています。エネルギー効率と環境の持続可能性を重視する傾向が強まっていることも、今後数年間でベリーコア配電変圧器の採用を加速させると思われます。
オートトランス巻線セグメントによる産業用配電変圧器市場シェアは、その高い効率性と汎用性により、2032年まで大幅な成長率で上昇すると推定されます。自動変圧器は、従来の変圧器に比べ、サイズ、重量、コストが削減されるなどの利点があり、様々な産業用途に魅力的です。効率と信頼性の向上など、オートトランスの巻線技術の進歩も、このセグメントの成長を加速させると思われます。
アジア太平洋の産業用配電変圧器産業は、2024年から2032年にかけて顕著な成長を示すと思われます。この背景には、新興経済諸国における急速な都市化、工業化、インフラ整備があります。増大する電力需要に対応するための発電、送電、配電インフラへの投資の増加は、産業用配電変圧器の魅力を加速させています。再生可能エネルギーの導入と送電網の近代化を促進する政府のイニシアティブの登場も、この地域の産業の成長を増大させると思われます。
目次
第1章 調査手法と調査範囲
第2章 エグゼクティブサマリー
第3章 業界洞察
- エコシステム分析
- ベンダーマトリックス
- 規制状況
- 業界への影響要因
- 促進要因
- 業界の潜在的リスク&課題
- 潜在成長力分析
- ポーター分析
- PESTEL分析
第4章 競合情勢
- 戦略ダッシュボード
- イノベーションと持続可能性の展望
第5章 市場規模・予測:コア別、2019年~2032年
- 主要動向
- クローズド
- シェル
- ベリー
第6章 市場規模・予測:巻線別、2019年~2032年
- 主要動向
- 2巻線
- オートトランス
第7章 市場規模・予測:設置別、2019年~2032年、
- 主要動向
- 屋外
- 屋内
第8章 市場規模・予測:冷却別、2019年~2032年
- 主要動向
- 乾式
- 油浸式
第9章 市場規模・予測:絶縁別、2019年~2032年
- 主要動向
- ガス
- 油
- 固体
- 空気
- その他
第10章 市場規模・予測:定格別、2019年~2032年、
- 主要動向
- 2.5 MVA以下
- 2.6 MVA~10 MVA
- 10 MVA超
第11章 市場規模・予測:取付別、2019年~2032年
- 主要動向
- パッド
- ポール
- その他
第12章 市場規模・予測:地域別、2019年~2032年
- 主要動向
- 北米
- 米国
- カナダ
- メキシコ
- 欧州
- ドイツ
- フランス
- ロシア
- 英国
- イタリア
- スペイン
- オランダ
- アジア太平洋
- 中国
- 日本
- 韓国
- インド
- オーストラリア
- 中東・アフリカ
- サウジアラビア
- アラブ首長国連邦
- カタール
- エジプト
- 南アフリカ
- ナイジェリア
- ラテンアメリカ
- ブラジル
- ペルー
- アルゼンチン
第13章 企業プロファイル
- ABB
- Celme S.r.l.
- CG Power & Industrial Solutions Ltd.
- Eaton Corporation
- Elsewedy Electric
- ERMCO
- General Electric
- Hitachi Energy Ltd.
- HYOSUNG HEAVY INDUSTRIES
- IMEFY GROUP
- Mitsubishi Electric Corporation
- ORMAZABAL
- Schneider Electric
- Siemens
- Toshiba Energy Systems & Solutions Corporation
- Voltamp
Industrial Distribution Transformer Market size is projected to depict over 9% CAGR from 2024 to 2032. The increasing demand for electricity worldwide owing to rapid urbanization, industrialization, and infrastructural development is fueling the need for distribution transformers in power distribution networks. The modernization and expansion of existing electricity infrastructure, particularly in developing economies is driving the replacement and upgrade of aging transformers. According to the U.S. Energy Information Administration (EIA), in 2022, the total electricity consumption in the U.S. was approximately 4.07 trillion kWh. This increasing electricity demand is increasing the appeal of industrial distribution transformers.
The rising integration of renewable energy sources like solar and wind power into the grid is also necessitating the installation of distribution transformers to facilitate energy transmission and distribution. Of late, there have been significant advances in transformer technology like the development of more efficient and environmentally friendly units. The rise in government initiatives is also promoting energy efficiency and grid modernization, further driving the industry progression.
The industrial distribution transformer industry is segregated into core, winding, installation, cooling, insulation, rating, mounting, and region.
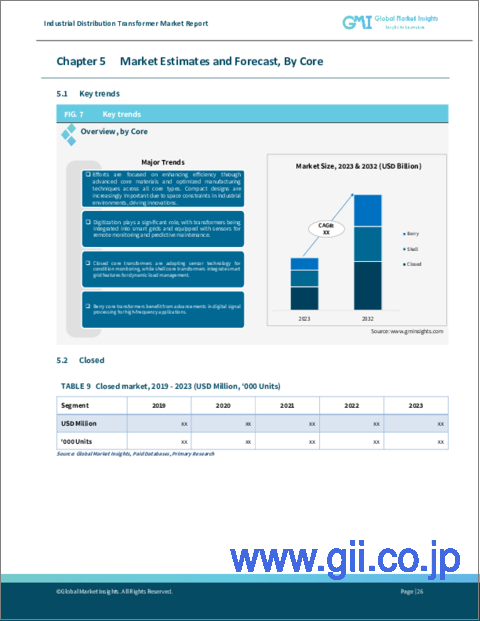
Based on core, the market demand from the berry segment will rise at commendable rate until 2032. The high efficiency and compact design of berry core makes it suitable for various industrial applications. Rising developments in berry core technology, including improved magnetic properties and reduced losses are offering enhanced transformer performance. The increasing emphasis on energy efficiency and environmental sustainability will also escalate the adoption of berry core distribution transformers in the coming years.
Industrial distribution transformer market share from the auto-transformer winding segment is estimated to rise at substantial growth rate through 2032, due to their high efficiency and versatility. Auto-transformers offer advantages, such as reduced size, weight, and cost compared to conventional transformers, making them attractive for various industrial applications. Growing advancements in autotransformer winding technology, including improved efficiency and reliability will also amplify the segment growth.
Asia Pacific industrial distribution transformer industry will depict noticeable growth from 2024 to 2032. This can be credited to the rapid urbanization, industrialization, and infrastructural development across emerging economies. Increasing investments in power generation, transmission, and distribution infrastructure to meet growing electricity demand are accelerating the appeal of industrial distribution transformers. The advent of government initiatives to promote renewable energy adoption and grid modernization will also augment the regional industry growth.
Table of Contents
Chapter 1 Methodology & Scope
- 1.1 Market definitions
- 1.2 Base estimates & calculations
- 1.3 Forecast calculation
- 1.4 Data sources
- 1.4.1 Primary
- 1.4.2 Secondary
- 1.4.2.1 Paid
- 1.4.2.2 Public
Chapter 2 Executive Summary
- 2.1 Industry 360 degree synopsis, 2019 - 2032
Chapter 3 Industry Insights
- 3.1 Industry ecosystem analysis
- 3.1.1 Vendor Matrix
- 3.2 Regulatory landscape
- 3.3 Industry impact forces
- 3.3.1 Growth drivers
- 3.3.2 Industry pitfalls & challenges
- 3.4 Growth potential analysis
- 3.5 Porter's Analysis
- 3.5.1 Bargaining power of suppliers
- 3.5.2 Bargaining power of buyers
- 3.5.3 Threat of new entrants
- 3.5.4 Threat of substitutes
- 3.6 PESTEL Analysis
Chapter 4 Competitive landscape, 2023
- 4.1 Strategic dashboard
- 4.2 Innovation & sustainability landscape
Chapter 5 Market Size and Forecast, By Core, 2019 - 2032, ('000 Units & USD Million)
- 5.1 Key trends
- 5.2 Closed
- 5.3 Shell
- 5.4 Berry
Chapter 6 Market Size and Forecast, By Winding, 2019 - 2032, ('000 Units & USD Million)
- 6.1 Key trends
- 6.2 Two-winding
- 6.3 Auto-transformer
Chapter 7 Market Size and Forecast, By Installation, 2019 - 2032, ('000 Units & USD Million)
- 7.1 Key trends
- 7.2 Outdoor
- 7.3 Indoor
Chapter 8 Market Size and Forecast, By Cooling, 2019 - 2032, ('000 Units & USD Million)
- 8.1 Key trends
- 8.2 Dry type
- 8.3 Oil immersed
Chapter 9 Market Size and Forecast, By Insulation, 2019 - 2032, ('000 Units & USD Million)
- 9.1 Key trends
- 9.2 Gas
- 9.3 Oil
- 9.4 Solid
- 9.5 Air
- 9.6 Others
Chapter 10 Market Size and Forecast, By Rating, 2019 - 2032, ('000 Units & USD Million)
- 10.1 Key trends
- 10.2 < 2.5 MVA
- 10.3 2.6 MVA to 10 MVA
- 10.4 > 10 MVA
Chapter 11 Market Size and Forecast, By Mounting, 2019 - 2032, ('000 Units & USD Million)
- 11.1 Key trends
- 11.2 Pad
- 11.3 Pole
- 11.4 Others
Chapter 12 Market Size and Forecast, By Region, 2019 - 2032, ('000 Units & USD Million)
- 12.1 Key trends
- 12.2 North America
- 12.2.1 U.S.
- 12.2.2 Canada
- 12.2.3 Mexico
- 12.3 Europe
- 12.3.1 Germany
- 12.3.2 France
- 12.3.3 Russia
- 12.3.4 UK
- 12.3.5 Italy
- 12.3.6 Spain
- 12.3.7 Netherlands
- 12.4 Asia Pacific
- 12.4.1 China
- 12.4.2 Japan
- 12.4.3 South Korea
- 12.4.4 India
- 12.4.5 Australia
- 12.5 Middle East & Africa
- 12.5.1 Saudi Arabia
- 12.5.2 UAE
- 12.5.3 Qatar
- 12.5.4 Egypt
- 12.5.5 South Africa
- 12.5.6 Nigeria
- 12.6 Latin America
- 12.6.1 Brazil
- 12.6.2 Peru
- 12.6.3 Argentina
Chapter 13 Company Profiles
- 13.1 ABB
- 13.2 Celme S.r.l.
- 13.3 CG Power & Industrial Solutions Ltd.
- 13.4 Eaton Corporation
- 13.5 Elsewedy Electric
- 13.6 ERMCO
- 13.7 General Electric
- 13.8 Hitachi Energy Ltd.
- 13.9 HYOSUNG HEAVY INDUSTRIES
- 13.10 IMEFY GROUP
- 13.11 Mitsubishi Electric Corporation
- 13.12 ORMAZABAL
- 13.13 Schneider Electric
- 13.14 Siemens
- 13.15 Toshiba Energy Systems & Solutions Corporation
- 13.16 Voltamp


