
|
市場調査レポート
商品コード
1740976
自動車用3D地図システムの市場機会、成長促進要因、産業動向分析、2025年~2034年予測Automotive 3D Map System Market Opportunity, Growth Drivers, Industry Trend Analysis, and Forecast 2025 - 2034 |
||||||
カスタマイズ可能
|
|||||||
| 自動車用3D地図システムの市場機会、成長促進要因、産業動向分析、2025年~2034年予測 |
|
出版日: 2025年04月29日
発行: Global Market Insights Inc.
ページ情報: 英文 170 Pages
納期: 2~3営業日
|

全表示
- 概要
- 目次
自動車用3D地図システムの世界市場規模は、2024年に54億米ドルとなり、CAGR11.1%で成長し、2034年までには149億米ドルに達すると推定されます。
この成長は、自律走行車技術の急速な拡大によるところが大きいです。自動車の自動運転化が進むにつれて、3D地図は、正確な車線特定、リアルタイムの障害物検知、インテリジェントなルート計画などの高度な機能を実現する重要な手段として台頭してきています。高精細マッピングは、レベル3から5の自律走行で動作する車両にとって不可欠であり、車載センサーの視線を超えた環境コンテキストを提供します。このような詳細な地図がなければ、自律走行システムは複雑な意思決定に必要なデータを欠くことになります。業界がよりスマートなモビリティソリューションに軸足を移す中、メーカーは3Dマップの役割を強化する技術に多額の投資を行っています。これらの地図は、安全性と性能を高めるだけでなく、より良い車内体験を生み出すのにも役立ちます。自律走行とADAS(先進運転支援システム)の研究開発は、3D地図のイノベーションを加速し続けています。リアルタイムで状況を把握できるナビゲーションに対する消費者の期待が高まる中、自動車メーカーは3Dマッピングシステムを車両ラインアップ全体の標準コンポーネントとしつつあります。自動車メーカーとデジタル地図開発企業とのコラボレーションは、統合されたブランド化されたナビゲーション体験を提供することを目指し、一般的になりつつあります。
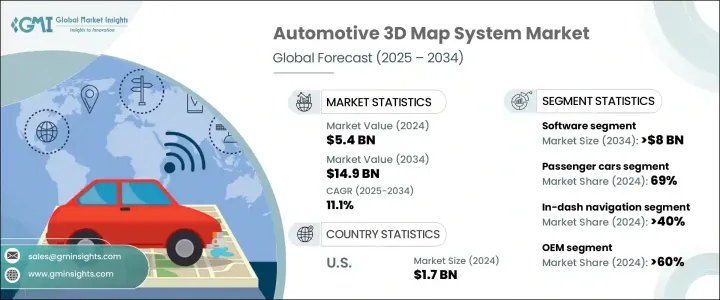
市場はコンポーネント別にハードウェア、ソフトウェア、サービスに区分されます。2024年には、ソフトウェア分野が市場全体の約50%のシェアを占め、業界を支配しており、2034年には80億米ドルを超えると予測されています。人工知能とクラウドコンピューティングの進歩により、マッピングソフトウェアは、変化する交通状況、道路閉鎖、環境要因にリアルタイムで適応する高度にダイナミックなプラットフォームへと変貌しつつあります。自動車メーカーは現在、予測ルート計画や運転行動分析を改善するため、クラウド対応の地図システムを好んで使用しています。ドライバーはパーソナライズされたデジタル体験をますます求めるようになっており、カスタマイズ可能な地図ソフトウェアへの需要は高まり続けています。自動車メーカーは、独自のユーザープロファイル、美的テーマ、豊富なデータオーバーレイをサポートする汎用性の高いプラットフォームを導入しており、地図ソフトウェアをインフォテインメントシステムにおける重要な差別化要因としています。
| 市場範囲 | |
|---|---|
| 開始年 | 2024年 |
| 予測年 | 2025年~2034年 |
| 開始金額 | 54億米ドル |
| 予測金額 | 149億米ドル |
| CAGR | 11.1% |
ハードウェアもまた、3Dマッピング技術をサポートする上で重要な役割を果たしています。LiDAR、レーダー、HDカメラを搭載した車両は、正確な地図作成に不可欠な詳細な空間データを生成します。これらのセンサーは、物体検出、深度推定、道路境界認識に大きく貢献しています。センサーのコストが下がるにつれて、中級車にもこうした技術が搭載されるようになり、今後10年間のハードウェア分野の成長を押し上げると予想されます。
車両タイプ別に分類すると、乗用車、商用車、オフロード車が含まれます。2024年には乗用車が市場をリードし、69%のシェアを占めました。ますます密集し複雑化する道路をナビゲートするドライバーは、周囲の状況をより明確かつインタラクティブに把握するために、現在3Dマップを頼りにしています。車線維持支援やアダプティブクルーズコントロールのような機能は高精度地図に大きく依存するため、自動車メーカーはより幅広い車種に高度な地図システムを搭載するようになっています。デジタルコックピットがより洗練されるにつれ、3D地図は全体的な運転体験を向上させる不可欠な機能に変わりつつあります。
また、市場はナビゲーションディスプレイの形式によっても分けられます:ダッシュボード内システム、ヘッドアップディスプレイ(HUD)、拡張現実(AR)ナビゲーションです。ダッシュボード内ナビゲーションは現在、40%以上の市場シェアでセグメントをリードしています。消費者は、アフターマーケットのGPSデバイスから徐々に離れ、統合された工場設置のシステムを好むようになっています。これらのダッシュボード内ディスプレイは、シームレスなユーザー体験、信頼性の向上、ドライバーの注意散漫の最小化を提供します。インダッシュマップを高解像度ディスプレイやインテリジェントオーバーレイと組み合わせることで、ユーザーの満足度はさらに向上します。一方、HUDテクノロジーは、ドライバーにリアルタイムのルートや危険データを提供しながら、道路から目を離さないことを可能にする、安全性を重視したイノベーションとして支持を集めています。3DマッピングとARの統合は、HUDベースのシステムをさらに強化し、インタラクティブで視覚的に直感的なものにします。
販売チャネルの観点からは、OEMが2024年には60%を超えるシェアを占め、市場を独占しました。このセグメントは2034年までCAGR11.5%以上で成長すると予測されます。自動車メーカーは、車載センサーとのシームレスな統合を保証し、自律走行機能に関連する規制要件を満たすために、工場レベルで3D地図システムを自動車に組み込んでいます。このような内蔵ソリューションは、アフターマーケットの代替品と比較して、より優れた性能、システムの信頼性、消費者の信頼を提供します。とはいえ、アフターマーケットの3D地図システムは、費用対効果の高いアップグレードを求める古い車両の所有者やフリートオペレーターの間で支持を集め続けています。これらのシステムは、車両全体を買い替えることなくナビゲーションとADAS機能を強化するための、拡張可能で後付けに適したソリューションを提供します。
地域別では、北米が2024年の世界市場をリードし、総売上の35%以上を占めました。米国だけが17億米ドルを占め、自律走行車テストの進展、スマートインフラ構想、安全志向の機能に対する消費者需要の増加がその原動力となっています。米国は、法的枠組み、ハイテクセクターの投資、広大な交通インフラの組み合わせにより、3Dマッピング技術革新の中心的な拠点となっています。これらの要因によって、さまざまな走行条件下での高精細マッピングシステムの迅速な展開とリアルタイムのテストが可能となっています。
この市場には、世界な技術プロバイダー、マッピングソフトウェア開発企業、地域密着型のプレーヤーが混在しています。ティア1のサプライヤーは、OEMのニーズに合わせたクラウドベースのプラットフォーム、AIを強化した知覚ツール、V2X(Vehicle-to-Everything)統合機能を提供しています。一方、地域企業は新興市場で急速に拡大しており、地域の道路状況や消費者ニーズに合わせた、手頃な価格で拡張性と適応性のあるソリューションを提供しています。
目次
第1章 調査手法と範囲
第2章 エグゼクティブサマリー
第3章 業界考察
- 業界エコシステム分析
- サプライヤーの情勢
- 部品サプライヤー
- テクノロジープロバイダー
- ソフトウェアプロバイダー
- 販売代理店
- 最終用途
- トランプ政権による関税への影響
- 貿易への影響
- 貿易量の混乱
- 報復措置
- 業界への影響
- 供給側の影響(原材料)
- 主要原材料の価格変動
- サプライチェーンの再構築
- 生産コストへの影響
- 需要側の影響(顧客へのコスト)
- 最終市場への価格伝達
- 市場シェアの動向
- 消費者の反応パターン
- 供給側の影響(原材料)
- 影響を受ける主要企業
- 戦略的な業界対応
- サプライチェーンの再構成
- 価格設定と製品戦略
- 政策関与
- 展望と今後の検討事項
- 貿易への影響
- 利益率分析
- テクノロジーとイノベーションの情勢
- 特許分析
- 主なニュースと取り組み
- 規制情勢
- ユースケース
- 影響要因
- 成長促進要因
- リアルタイムの高精度地図を必要とする自動運転車の需要の高まり
- ADASと安全技術の導入を推進する政府規制
- OEMによる工場出荷時のインフォテインメントシステムへの3Dマップの統合
- V2X通信をサポートするスマートシティとコネクテッドインフラの拡大
- 業界の潜在的リスク・課題
- リアルタイムの高解像度地図の開発と保守にかかるコストが高め
- 位置情報サービスに関連するデータプライバシーとサイバーセキュリティの懸念
- 成長促進要因
- 成長可能性分析
- ポーター分析
- PESTEL分析
第4章 競合情勢
- イントロダクション
- 企業の市場シェア分析
- 競合ポジショニングマトリックス
- 戦略的展望マトリックス
第5章 市場推計・予測:コンポーネント別、2021年~2034年
- 主要動向
- ハードウェア
- ソフトウェア
- サービス
第6章 市場推計・予測:ナビゲーション別、2021年~2034年
- 主要動向
- インダッシュナビゲーション
- ヘッドアップディスプレイ(HUD)
- 拡張現実(AR)ナビゲーション
第7章 市場推計・予測:車両別、2021年~2034年
- 主要動向
- 乗用車
- ハッチバック
- セダン
- SUV
- 商用車
- 小型商用車(LCV)
- 中型商用車(MCV)
- 大型商用車(HCV)
- オフロード車
第8章 市場推計・予測:用途別、2021年~2034年
- 主要動向
- ADAS
- 自動運転
- 車載ナビゲーション
- 車両・物流管理
- その他
第9章 市場推計・予測:販売チャネル別、2021年~2034年
- 主要動向
- OEM
- アフターマーケット
第10章 市場推計・予測:地域別、2021年~2034年
- 主要動向
- 北米
- 米国
- カナダ
- 欧州
- 英国
- ドイツ
- フランス
- イタリア
- スペイン
- ロシア
- 北欧諸国
- アジア太平洋
- 中国
- インド
- 日本
- 韓国
- オーストラリア・ニュージーランド
- 東南アジア
- ラテンアメリカ
- ブラジル
- メキシコ
- アルゼンチン
- 中東・アフリカ
- アラブ首長国連邦
- サウジアラビア
- 南アフリカ
第11章 企業プロファイル
- 3D Mapping
- Carmera
- Civil Maps
- Deepmap
- Dynamic Map Platform
- Elektrobit
- Garmin
- HERE Technologies
- Inrix
- MapBox
- Microsoft
- Mitsubishi
- Mobileye
- NavInfo
- Nvidia
- Telenav
- TomTom
- Trimble
- Valeo
The Global Automotive 3D Map System Market was valued at USD 5.4 billion in 2024 and is estimated to grow at a CAGR of 11.1% to reach USD 14.9 billion by 2034. This growth is largely driven by the rapid expansion of autonomous vehicle technologies. As vehicles become increasingly automated, 3D maps are emerging as a critical enabler of advanced features such as precise lane localization, real-time obstacle detection, and intelligent route planning. High-definition mapping is essential for vehicles operating at Levels 3 to 5 autonomy, delivering an environmental context that goes beyond the line of sight of onboard sensors. Without these detailed maps, autonomous systems lack the necessary data for complex decision-making. As the industry pivots toward smarter mobility solutions, manufacturers are heavily investing in technologies that enhance the role of 3D maps. These maps not only boost safety and performance but also help create a better in-vehicle experience. Research and development in autonomous driving and advanced driver assistance systems (ADAS) continue to accelerate innovations in 3D mapping. With increasing consumer expectations for real-time, context-aware navigation, automakers are making 3D mapping systems a standard component across vehicle lineups. Collaborations between car manufacturers and digital map developers are becoming more common as they aim to deliver integrated and branded navigation experiences.
The market is segmented by component into hardware, software, and services. In 2024, the software segment dominated the industry with approximately 50% of the overall market share and is forecasted to surpass USD 8 billion by 2034. Advancements in artificial intelligence and cloud computing are transforming mapping software into highly dynamic platforms that adapt in real-time to changing traffic conditions, road closures, and environmental factors. Automakers are now favoring cloud-enabled mapping systems to improve predictive route planning and driving behavior analysis. As drivers increasingly seek personalized digital experiences, the demand for customizable map software continues to rise. Automakers are deploying versatile platforms that support unique user profiles, aesthetic themes, and data-rich overlays, making mapping software a key differentiator in infotainment systems.
| Market Scope | |
|---|---|
| Start Year | 2024 |
| Forecast Year | 2025-2034 |
| Start Value | $5.4 Billion |
| Forecast Value | $14.9 Billion |
| CAGR | 11.1% |
Hardware also plays a vital role in supporting 3D mapping technology. Vehicles equipped with LiDAR, radar, and HD cameras generate detailed spatial data essential for accurate map creation. These sensors contribute significantly to object detection, depth estimation, and road boundary recognition. As the cost of sensors drops, mid-range vehicles are also expected to feature such technologies, boosting the hardware segment's growth in the coming decade.
When segmented by vehicle type, the market includes passenger cars, commercial vehicles, and off-road vehicles. Passenger cars led the market in 2024, holding a 69% share. Drivers navigating increasingly dense and complex roadways are now relying on 3D maps for a clearer, more interactive understanding of their surroundings. Features like lane-keeping assistance and adaptive cruise control depend heavily on precision mapping, prompting automakers to incorporate advanced map systems into a wider range of car models. As digital cockpits become more sophisticated, 3D maps are turning into essential features that enhance the overall driving experience.
The market is also divided based on navigation display formats: in-dash systems, Heads-Up Displays (HUD), and Augmented Reality (AR) navigation. In-dash navigation currently leads the segment with over 40% market share. Consumers are gradually moving away from aftermarket GPS devices and favoring integrated, factory-installed systems. These in-dash displays offer seamless user experiences, enhanced reliability, and minimal driver distraction. Pairing in-dash maps with high-resolution displays and intelligent overlays further improves user satisfaction. Meanwhile, HUD technology is gaining traction as a safety-forward innovation, allowing drivers to keep their eyes on the road while receiving real-time route and hazard data. The integration of 3D mapping with AR will further strengthen HUD-based systems, making them interactive and visually intuitive.
From a sales channel perspective, OEMs dominate the market with a share exceeding 60% in 2024. This segment is projected to grow at over 11.5% CAGR through 2034. Automakers are embedding 3D map systems into vehicles at the factory level to ensure seamless integration with onboard sensors and to meet regulatory requirements associated with autonomous features. These built-in solutions offer better performance, system reliability, and consumer trust compared to aftermarket alternatives. That said, aftermarket 3D map systems continue to gain traction among owners of older vehicles and fleet operators looking for cost-effective upgrades. These systems offer scalable, retrofit-friendly solutions for enhancing navigation and ADAS capabilities without replacing entire vehicle fleets.
Regionally, North America led the global market in 2024, contributing over 35% of total revenue. The U.S. alone accounted for USD 1.7 billion, driven by growing advancements in autonomous vehicle testing, smart infrastructure initiatives, and increasing consumer demand for safety-oriented features. The country has become a central hub for innovation in 3D mapping technologies, thanks to a combination of legal frameworks, tech-sector investment, and an expansive transportation infrastructure. These factors enable the rapid deployment and real-time testing of high-definition mapping systems under a wide range of driving conditions.
The market features a mix of global tech providers, mapping software developers, and localized players. Tier 1 suppliers offer cloud-based platforms, AI-enhanced perception tools, and vehicle-to-everything (V2X) integration capabilities tailored to OEM needs. Meanwhile, regional firms are rapidly expanding in emerging markets, offering affordable, scalable, and adaptable solutions tailored to local road conditions and consumer needs.
Table of Contents
Chapter 1 Methodology & Scope
- 1.1 Research design
- 1.1.1 Research approach
- 1.1.2 Data collection methods
- 1.2 Base estimates and calculations
- 1.2.1 Base year calculation
- 1.2.2 Key trends for market estimates
- 1.3 Forecast model
- 1.4 Primary research & validation
- 1.4.1 Primary sources
- 1.4.2 Data mining sources
- 1.5 Market definitions
Chapter 2 Executive Summary
- 2.1 Industry 3600 synopsis, 2021 - 2034
Chapter 3 Industry Insights
- 3.1 Industry ecosystem analysis
- 3.2 Supplier landscape
- 3.2.1 Component supplier
- 3.2.2 Technology providers
- 3.2.3 Software providers
- 3.2.4 Distributors
- 3.2.5 End use
- 3.3 Impact of Trump administration tariffs
- 3.3.1 Trade impact
- 3.3.1.1 Trade volume disruptions
- 3.3.1.2 Retaliatory measures
- 3.3.2 Impact on industry
- 3.3.2.1 Supply-side impact (raw materials)
- 3.3.2.1.1 Price volatility in key materials
- 3.3.2.1.2 Supply chain restructuring
- 3.3.2.1.3 Production cost implications
- 3.3.2.2 Demand-side impact (Cost to customers)
- 3.3.2.2.1 Price transmission to end markets
- 3.3.2.2.2 Market share dynamics
- 3.3.2.2.3 Consumer response patterns
- 3.3.2.1 Supply-side impact (raw materials)
- 3.3.3 Key companies impacted
- 3.3.4 Strategic industry responses
- 3.3.4.1 Supply chain reconfiguration
- 3.3.4.2 Pricing and product strategies
- 3.3.4.3 Policy engagement
- 3.3.5 Outlook & future considerations
- 3.3.1 Trade impact
- 3.4 Profit margin analysis
- 3.5 Technology & innovation landscape
- 3.6 Patent analysis
- 3.7 Key news & initiatives
- 3.8 Regulatory landscape
- 3.9 Use cases
- 3.10 Impact on forces
- 3.10.1 Growth drivers
- 3.10.1.1 Rising demand for autonomous vehicles requiring real-time, high-precision maps
- 3.10.1.2 Government regulations pushing adoption of ADAS and safety technologies
- 3.10.1.3 Integration of 3D maps into factory-installed infotainment systems by OEMs
- 3.10.1.4 Expansion of smart cities and connected infrastructure supporting V2X communication
- 3.10.2 Industry pitfalls & challenges
- 3.10.2.1 High development and maintenance costs for real-time, high-resolution maps
- 3.10.2.2 Data privacy and cybersecurity concerns related to location-based services
- 3.10.1 Growth drivers
- 3.11 Growth potential analysis
- 3.12 Porter's analysis
- 3.13 PESTEL analysis
Chapter 4 Competitive Landscape, 2024
- 4.1 Introduction
- 4.2 Company market share analysis
- 4.3 Competitive positioning matrix
- 4.4 Strategic outlook matrix
Chapter 5 Market Estimates & Forecast, By Component, 2021 - 2034 ($Bn)
- 5.1 Key trends
- 5.2 Hardware
- 5.3 Software
- 5.4 Services
Chapter 6 Market Estimates & Forecast, By Navigation, 2021 - 2034 ($Bn)
- 6.1 Key trends
- 6.2 In-dash navigation
- 6.3 Heads-Up Display (HUD)
- 6.4 Augmented Reality (AR) navigation
Chapter 7 Market Estimates & Forecast, By Vehicle, 2021 - 2034 ($Bn)
- 7.1 Key trends
- 7.2 Passenger cars
- 7.2.1 Hatchback
- 7.2.2 Sedan
- 7.2.3 SUV
- 7.3 Commercial vehicles
- 7.3.1 Light Commercial Vehicles (LCV)
- 7.3.2 Medium Commercial Vehicles (MCV)
- 7.3.3 Heavy Commercial Vehicles (HCV)
- 7.4 Off-road vehicles
Chapter 8 Market Estimates & Forecast, By Application, 2021 - 2034 ($Bn)
- 8.1 Key trends
- 8.2 ADAS
- 8.3 Autonomous driving
- 8.4 In-vehicle navigation
- 8.5 Fleet and logistics management
- 8.6 Others
Chapter 9 Market Estimates & Forecast, By Sales Channel, 2021 - 2034 ($Bn)
- 9.1 Key trends
- 9.2 OEM
- 9.3 Aftermarket
Chapter 10 Market Estimates & Forecast, By Region, 2021 - 2034 ($Bn)
- 10.1 Key trends
- 10.2 North America
- 10.2.1 U.S.
- 10.2.2 Canada
- 10.3 Europe
- 10.3.1 UK
- 10.3.2 Germany
- 10.3.3 France
- 10.3.4 Italy
- 10.3.5 Spain
- 10.3.6 Russia
- 10.3.7 Nordics
- 10.4 Asia Pacific
- 10.4.1 China
- 10.4.2 India
- 10.4.3 Japan
- 10.4.4 South Korea
- 10.4.5 ANZ
- 10.4.6 Southeast Asia
- 10.5 Latin America
- 10.5.1 Brazil
- 10.5.2 Mexico
- 10.5.3 Argentina
- 10.6 MEA
- 10.6.1 UAE
- 10.6.2 Saudi Arabia
- 10.6.3 South Africa
Chapter 11 Company Profiles
- 11.1 3D Mapping
- 11.2 Carmera
- 11.3 Civil Maps
- 11.4 Deepmap
- 11.5 Dynamic Map Platform
- 11.6 Elektrobit
- 11.7 Garmin
- 11.8 Google
- 11.9 HERE Technologies
- 11.10 Inrix
- 11.11 MapBox
- 11.12 Microsoft
- 11.13 Mitsubishi
- 11.14 Mobileye
- 11.15 NavInfo
- 11.16 Nvidia
- 11.17 Telenav
- 11.18 TomTom
- 11.19 Trimble
- 11.20 Valeo
