|
|
市場調査レポート
商品コード
1434004
輸送用液体水素市場規模:流通別、生産量別、地域別展望、成長可能性、競合市場シェア&予測 2024年~2032年Transportation Liquid Hydrogen Market Size - By Distribution (Pipelines, Cryogenic Tanks), By Production (Coal Gasification, SMR, Electrolysis,), Regional Outlook, Growth Potential, Competitive Market Share & Forecast, 2024 - 2032 |
||||||
|
|
|||||||
|
● お客様のご希望に応じて、既存データの加工や未掲載情報(例:国別セグメント)の追加などの対応が可能です。 詳細はお問い合わせください。 |
|||||||


| 輸送用液体水素市場規模:流通別、生産量別、地域別展望、成長可能性、競合市場シェア&予測 2024年~2032年 |
|
出版日: 2024年01月10日
発行: Global Market Insights Inc.
ページ情報: 英文 150 Pages
納期: 2~3営業日
|
- 全表示
- 概要
- 図表
- 目次
輸送用液体水素の市場規模は、2024年から2032年にかけてCAGR 6%以上で拡大すると予測されます。
持続可能なエネルギー源への世界のシフトにより、輸送用クリーン燃料としての水素への関心が高まっています。例えば、2023年12月、中国の新興企業Hybotが世界初の気体水素を動力源とするトラックを発売しました。このトラックは航続距離1,000km以上を誇り、49トンの貨物を満載して高速走行すると100kmあたり8kgの水素を使用します。
液体水素は、燃料電池車や大型トラックなど、さまざまな輸送手段で汎用性を発揮します。政府の取り組みやインセンティブが高まっていることも、水素を燃料とする輸送の促進に役立っています。輸送セクターにおける二酸化炭素排出量の削減と脱炭素化目標の達成への注目が高まっていることが、液体水素の需要をさらに押し上げています。さらに、水素製造技術とインフラ開拓の急速な進歩も市場拡大に寄与すると思われます。
輸送用液体水素市場は、流通、生産、地域に分別されます。
生産に基づくと、電解分野からの市場価値は、グリーン水素需要の高まりにより、2024年から2032年にかけて大幅なCAGRで上昇すると予想されます。再生可能エネルギーを動力源とする電解は、二酸化炭素を排出することなく水素を製造するのに役立ち、持続可能性の目標にさらに合致します。さらに、電解インフラへの投資の増加、急速な技術進歩、クリーンエネルギー・ソリューションに対する政府支援の高まりが、同分野の成長を後押しします。
輸送用液体水素の市場シェアは、パイプライン流通部門が2024年から2032年にかけて大きく成長すると予測されます。これは、パイプラインによる水素輸送がもたらす効率性と費用対効果によるものです。強固なパイプライン・インフラの整備が、液体水素の広範な流通を促進しています。さらに、水素サプライチェーンの最適化に対する注目の高まりが、このセグメントの拡大を後押しします。
地域別では、北米の液体水素輸送産業規模は、2024年から2032年にかけて顕著なCAGRで拡大すると予測されています。この成長の背景には、脱炭素化へのコミットメントの高まり、政府の支援イニシアティブ、水素インフラへの投資の増加があります。また、クリーンで持続可能な輸送ソリューションに対する需要の高まりと技術進歩も、この地域の市場拡大に拍車をかけると思われます。
目次
第1章 調査手法と調査範囲
第2章 エグゼクティブサマリー
第3章 輸送用液体水素業界考察
- エコシステム分析
- ベンダーマトリックス
- 規制状況
- 業界への影響要因
- 促進要因
- 脱炭素化へのシフト
- 代替燃料への関心の高まり
- 業界の潜在的リスク&課題
- 水素ステーション網の不足
- 促進要因
- 成長可能性分析
- ポーター分析
- PESTEL分析
第4章 競合ベンチマーキング
- イノベーションと持続可能性の展望
- 競合情勢、2023年
- 戦略ダッシュボード
第5章 輸送用液体水素市場:流通別
- 主な流通動向
- パイプライン
- 低温タンク
第6章 輸送用液体水素市場:生産別
- 主な生産動向
- 石炭ガス化
- SMR
- 電解
第7章 輸送用液体水素市場:地域別
- 主な地域動向
- 北米
- 米国
- カナダ
- 欧州
- ドイツ
- 英国
- フランス
- イタリア
- アジア太平洋
- 中国
- 日本
- 韓国
- インド
- オーストラリア
第8章 企業プロファイル
- Air Liquide
- Air Products and Chemicals, Inc.
- Iwatani Corporation
- Messer
- Plug Power Inc.
- ENGIE
- Linde plc
- GE Appliances
- Shell plc
- Chart Industries
- Kawasaki Heavy Industries, Ltd.
- INOX India limited
- GenH2
- Praxair Technology, Inc.
- Salzburger Aluminium Group
Data Tables
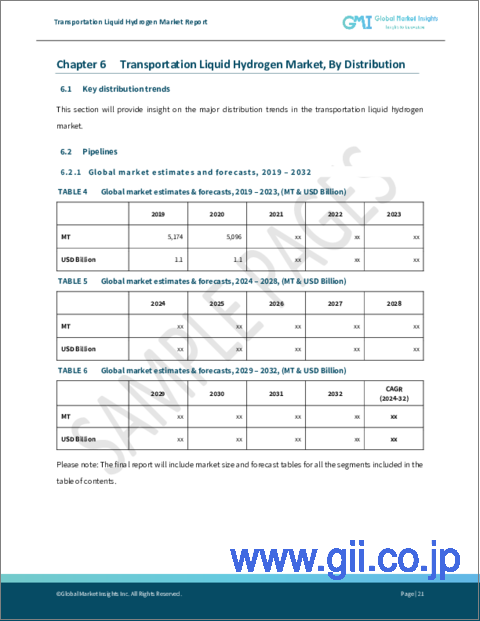
- TABLE 1 Transportation liquid hydrogen market, 2019 - 2023 (Volume & Revenue)
- TABLE 2 Transportation liquid hydrogen market, 2024 - 2027 (Volume & Revenue)
- TABLE 3 Transportation liquid hydrogen market, 2028 - 2032 (Volume & Revenue)
- TABLE 4 Transportation liquid hydrogen market by distribution, 2019 - 2023 (MT)
- TABLE 5 Transportation liquid hydrogen market by distribution, 2024 - 2027 (MT)
- TABLE 6 Transportation liquid hydrogen market by distribution, 2028 - 2032 (MT)
- TABLE 7 Transportation liquid hydrogen market by distribution, 2019 - 2023 (USD Billion)
- TABLE 8 Transportation liquid hydrogen market by distribution, 2024 - 2027 (USD Billion)
- TABLE 9 Transportation liquid hydrogen market by distribution, 2028 - 2032 (USD Billion)
- TABLE 10 Transportation liquid hydrogen market by production, 2019 - 2023 (MT)
- TABLE 11 Transportation liquid hydrogen market by production, 2024 - 2027 (MT)
- TABLE 12 Transportation liquid hydrogen market by production, 2028 - 2032 (MT)
- TABLE 13 Transportation liquid hydrogen market by production, 2019 - 2023 (USD Billion)
- TABLE 14 Transportation liquid hydrogen market by production, 2024 - 2027 (USD Billion)
- TABLE 15 Transportation liquid hydrogen market by production, 2028 - 2032 (USD Billion)
- TABLE 16 Transportation liquid hydrogen market by region, 2019 - 2023 (MT)
- TABLE 17 Transportation liquid hydrogen market by region, 2024 - 2027 (MT)
- TABLE 18 Transportation liquid hydrogen market by region, 2028 - 2032 (MT)
- TABLE 19 Transportation liquid hydrogen market by region, 2019 - 2023 (USD Billion)
- TABLE 20 Transportation liquid hydrogen market by region, 2024 - 2027 (USD Billion)
- TABLE 21 Transportation liquid hydrogen market by region, 2028 - 2032 (USD Billion)
- TABLE 22 Industry impact forces
- TABLE 23 Transportation liquid hydrogen market from distribution, pipelines, 2019 - 2023 (Volume & Revenue)
- TABLE 24 Transportation liquid hydrogen market from distribution, pipelines, 2024 - 2027 (Volume & Revenue)
- TABLE 25 Transportation liquid hydrogen market from distribution, pipelines, 2028 - 2032 (Volume & Revenue)
- TABLE 26 Transportation liquid hydrogen market from distribution, pipelines, by region, 2019 - 2023 (MT)
- TABLE 27 Transportation liquid hydrogen market from distribution, pipelines, by region, 2024 - 2027 (MT)
- TABLE 28 Transportation liquid hydrogen market from distribution, pipelines, by region, 2028 - 2032 (MT)
- TABLE 29 Transportation liquid hydrogen market from distribution, pipelines, by region, 2019 - 2023 (USD Billion)
- TABLE 30 Transportation liquid hydrogen market from distribution, pipelines, by region, 2024 - 2027 (USD Billion)
- TABLE 31 Transportation liquid hydrogen market from distribution, pipelines, by region, 2028 - 2032 (USD Billion)
- TABLE 32 Transportation liquid hydrogen market from distribution, cryogenic tanks, 2019 - 2023 (Volume & Revenue)
- TABLE 33 Transportation liquid hydrogen market from distribution, cryogenic tanks, 2024 - 2027 (Volume & Revenue)
- TABLE 34 Transportation liquid hydrogen market from distribution, cryogenic tanks, 2028 - 2032 (Volume & Revenue)
- TABLE 35 Transportation liquid hydrogen market from distribution, cryogenic tanks, by region, 2019 - 2023 (MT)
- TABLE 36 Transportation liquid hydrogen market from distribution, cryogenic tanks, by region, 2024 - 2027 (MT)
- TABLE 37 Transportation liquid hydrogen market from distribution, cryogenic tanks, by region, 2028 - 2032 (MT)
- TABLE 38 Transportation liquid hydrogen market from distribution, cryogenic tanks, by region, 2019 - 2023 (USD Billion)
- TABLE 39 Transportation liquid hydrogen market from distribution, cryogenic tanks, by region, 2024 - 2027 (USD Billion)
- TABLE 40 Transportation liquid hydrogen market from distribution, cryogenic tanks, by region, 2028 - 2032 (USD Billion)
- TABLE 41 Transportation liquid hydrogen market from production, coal gasification, 2019 - 2023 (Volume & Revenue)
- TABLE 42 Transportation liquid hydrogen market from production, coal gasification, 2024 - 2027 (Volume & Revenue)
- TABLE 43 Transportation liquid hydrogen market from production, coal gasification, 2028 - 2032 (Volume & Revenue)
- TABLE 44 Transportation liquid hydrogen market from production, coal gasification, by region, 2019 - 2023 (MT)
- TABLE 45 Transportation liquid hydrogen market from production, coal gasification, by region, 2024 - 2027 (MT)
- TABLE 46 Transportation liquid hydrogen market from production, coal gasification, by region, 2028 - 2032 (MT)
- TABLE 47 Transportation liquid hydrogen market from production, coal gasification, by region, 2019 - 2023 (USD Billion)
- TABLE 48 Transportation liquid hydrogen market from production, coal gasification, by region, 2024 - 2027 (USD Billion)
- TABLE 49 Transportation liquid hydrogen market from production, coal gasification, by region, 2028 - 2032 (USD Billion)
- TABLE 50 Transportation liquid hydrogen market from production, SMR, 2019 - 2023 (Volume & Revenue)
- TABLE 51 Transportation liquid hydrogen market from production, SMR, 2024 - 2027 (Volume & Revenue)
- TABLE 52 Transportation liquid hydrogen market from production, SMR, 2028 - 2032 (Volume & Revenue)
- TABLE 53 Transportation liquid hydrogen market from production, SMR, by region, 2019 - 2023 (MT)
- TABLE 54 Transportation liquid hydrogen market from production, SMR, by region, 2024 - 2027 (MT)
- TABLE 55 Transportation liquid hydrogen market from production, SMR, by region, 2028 - 2032 (MT)
- TABLE 56 Transportation liquid hydrogen market from production, SMR, by region, 2019 - 2023 (USD Billion)
- TABLE 57 Transportation liquid hydrogen market from production, SMR, by region, 2024 - 2027 (USD Billion)
- TABLE 58 Transportation liquid hydrogen market from production, SMR, by region, 2028 - 2032 (USD Billion)
- TABLE 59 Transportation liquid hydrogen market from production, electrolysis, 2019 - 2023 (Volume & Revenue)
- TABLE 60 Transportation liquid hydrogen market from production, electrolysis, 2024 - 2027 (Volume & Revenue)
- TABLE 61 Transportation liquid hydrogen market from production, electrolysis, 2028 - 2032 (Volume & Revenue)
- TABLE 62 Transportation liquid hydrogen market from production, electrolysis, by region, 2019 - 2023 (MT)
- TABLE 63 Transportation liquid hydrogen market from production, electrolysis, by region, 2024 - 2027 (MT)
- TABLE 64 Transportation liquid hydrogen market from production, electrolysis, by region, 2028 - 2032 (MT)
- TABLE 65 Transportation liquid hydrogen market from production, electrolysis, by region, 2019 - 2023 (USD Billion)
- TABLE 66 Transportation liquid hydrogen market from production, electrolysis, by region, 2024 - 2027 (USD Billion)
- TABLE 67 Transportation liquid hydrogen market from production, electrolysis, by region, 2028 - 2032 (USD Billion)
- TABLE 68 North America transportation liquid hydrogen market, 2019 - 2023 (Volume & Revenue)
- TABLE 69 North America transportation liquid hydrogen market, 2024 - 2027 (Volume & Revenue)
- TABLE 70 North America transportation liquid hydrogen market, 2028 - 2032 (Volume & Revenue)
- TABLE 71 North America transportation liquid hydrogen market by distribution, 2019 - 2023 (mt)
- TABLE 72 North America transportation liquid hydrogen market by distribution, 2024 - 2027 (mt)
- TABLE 73 North America transportation liquid hydrogen market by distribution, 2028 - 2032 (mt)
- TABLE 74 North America transportation liquid hydrogen market by distribution, 2019 - 2023 (USD Billion)
- TABLE 75 North America transportation liquid hydrogen market by distribution, 2024 - 2027 (USD Billion)
- TABLE 76 North America transportation liquid hydrogen market by distribution, 2028 - 2032 (USD Billion)
- TABLE 77 North America transportation liquid hydrogen market by production, 2019 - 2023 (mt)
- TABLE 78 North America transportation liquid hydrogen market by production, 2024 - 2027 (mt)
- TABLE 79 North America transportation liquid hydrogen market by production, 2028 - 2032 (mt)
- TABLE 80 North America transportation liquid hydrogen market by production, 2019 - 2023 (USD Billion)
- TABLE 81 North America transportation liquid hydrogen market by production, 2024 - 2027 (USD Billion)
- TABLE 82 North America transportation liquid hydrogen market by production, 2028 - 2032 (USD Billion)
- TABLE 83 U.S. transportation liquid hydrogen market, 2019 - 2023 (Volume & Revenue)
- TABLE 84 U.S. transportation liquid hydrogen market, 2024 - 2027 (Volume & Revenue)
- TABLE 85 U.S. transportation liquid hydrogen market, 2028 - 2032 (Volume & Revenue)
- TABLE 86 U.S. transportation liquid hydrogen market by distribution, 2019 - 2023 (mt)
- TABLE 87 U.S. transportation liquid hydrogen market by distribution, 2024 - 2027 (mt)
- TABLE 88 U.S. transportation liquid hydrogen market by distribution, 2028 - 2032 (mt)
- TABLE 89 U.S. transportation liquid hydrogen market by distribution, 2019 - 2023 (USD Billion)
- TABLE 90 U.S. transportation liquid hydrogen market by distribution, 2024 - 2027 (USD Billion)
- TABLE 91 U.S. transportation liquid hydrogen market by distribution, 2028 - 2032 (USD Billion)
- TABLE 92 U.S. transportation liquid hydrogen market by production, 2019 - 2023 (mt)
- TABLE 93 U.S. transportation liquid hydrogen market by production, 2024 - 2027 (mt)
- TABLE 94 U.S. transportation liquid hydrogen market by production, 2028 - 2032 (mt)
- TABLE 95 U.S. transportation liquid hydrogen market by production, 2019 - 2023 (USD Billion)
- TABLE 96 U.S. transportation liquid hydrogen market by production, 2024 - 2027 (USD Billion)
- TABLE 97 U.S. transportation liquid hydrogen market by production, 2028 - 2032 (USD Billion)
- TABLE 98 Canada transportation liquid hydrogen market, 2019 - 2023 (Volume & Revenue)
- TABLE 99 Canada transportation liquid hydrogen market, 2024 - 2027 (Volume & Revenue)
- TABLE 100 Canada transportation liquid hydrogen market, 2028 - 2032 (Volume & Revenue)
- TABLE 101 Canada transportation liquid hydrogen market by distribution, 2019 - 2023 (mt)
- TABLE 102 Canada transportation liquid hydrogen market by distribution, 2024 - 2027 (mt)
- TABLE 103 Canada transportation liquid hydrogen market by distribution, 2028 - 2032 (mt)
- TABLE 104 Canada transportation liquid hydrogen market by distribution, 2019 - 2023 (USD Billion)
- TABLE 105 Canada transportation liquid hydrogen market by distribution, 2024 - 2027 (USD Billion)
- TABLE 106 Canada transportation liquid hydrogen market by distribution, 2028 - 2032 (USD Billion)
- TABLE 107 Canada transportation liquid hydrogen market by production, 2019 - 2023 (mt)
- TABLE 108 Canada transportation liquid hydrogen market by production, 2024 - 2027 (mt)
- TABLE 109 Canada transportation liquid hydrogen market by production, 2028 - 2032 (mt)
- TABLE 110 Canada transportation liquid hydrogen market by production, 2019 - 2023 (USD Billion)
- TABLE 111 Canada transportation liquid hydrogen market by production, 2024 - 2027 (USD Billion)
- TABLE 112 Canada transportation liquid hydrogen market by production, 2028 - 2032 (USD Billion)
- TABLE 113 Europe transportation liquid hydrogen market, 2019 - 2023 (Volume & Revenue)
- TABLE 114 Europe transportation liquid hydrogen market, 2024 - 2027 (Volume & Revenue)
- TABLE 115 Europe transportation liquid hydrogen market, 2028 - 2032 (Volume & Revenue)
- TABLE 116 Europe transportation liquid hydrogen market by distribution, 2019 - 2023 (mt)
- TABLE 117 Europe transportation liquid hydrogen market by distribution, 2024 - 2027 (mt)
- TABLE 118 Europe transportation liquid hydrogen market by distribution, 2028 - 2032 (mt)
- TABLE 119 Europe transportation liquid hydrogen market by distribution, 2019 - 2023 (USD Billion)
- TABLE 120 Europe transportation liquid hydrogen market by distribution, 2024 - 2027 (USD Billion)
- TABLE 121 Europe transportation liquid hydrogen market by distribution, 2028 - 2032 (USD Billion)
- TABLE 122 Europe transportation liquid hydrogen market by production, 2019 - 2023 (mt)
- TABLE 123 Europe transportation liquid hydrogen market by production, 2024 - 2027 (mt)
- TABLE 124 Europe transportation liquid hydrogen market by production, 2028 - 2032 (mt)
- TABLE 125 Europe transportation liquid hydrogen market by production, 2019 - 2023 (USD Billion)
- TABLE 126 Europe transportation liquid hydrogen market by production, 2024 - 2027 (USD Billion)
- TABLE 127 Europe transportation liquid hydrogen market by production, 2028 - 2032 (USD Billion)
- TABLE 128 Germany transportation liquid hydrogen market, 2019 - 2023 (Volume & Revenue)
- TABLE 129 Germany transportation liquid hydrogen market, 2024 - 2027 (Volume & Revenue)
- TABLE 130 Germany transportation liquid hydrogen market, 2028 - 2032 (Volume & Revenue)
- TABLE 131 Germany transportation liquid hydrogen market by distribution, 2019 - 2023 (mt)
- TABLE 132 Germany transportation liquid hydrogen market by distribution, 2024 - 2027 (mt)
- TABLE 133 Germany transportation liquid hydrogen market by distribution, 2028 - 2032 (mt)
- TABLE 134 Germany transportation liquid hydrogen market by distribution, 2019 - 2023 (USD Billion)
- TABLE 135 Germany transportation liquid hydrogen market by distribution, 2024 - 2027 (USD Billion)
- TABLE 136 Germany transportation liquid hydrogen market by distribution, 2028 - 2032 (USD Billion)
- TABLE 137 Germany transportation liquid hydrogen market by production, 2019 - 2023 (mt)
- TABLE 138 Germany transportation liquid hydrogen market by production, 2024 - 2027 (mt)
- TABLE 139 Germany transportation liquid hydrogen market by production, 2028 - 2032 (mt)
- TABLE 140 Germany transportation liquid hydrogen market by production, 2019 - 2023 (USD Billion)
- TABLE 141 Germany transportation liquid hydrogen market by production, 2024 - 2027 (USD Billion)
- TABLE 142 Germany transportation liquid hydrogen market by production, 2028 - 2032 (USD Billion)
- TABLE 143 UK transportation liquid hydrogen market, 2019 - 2023 (Volume & Revenue)
- TABLE 144 UK transportation liquid hydrogen market, 2024 - 2027 (Volume & Revenue)
- TABLE 145 UK transportation liquid hydrogen market, 2028 - 2032 (Volume & Revenue)
- TABLE 146 UK transportation liquid hydrogen market by distribution, 2019 - 2023 (mt)
- TABLE 147 UK transportation liquid hydrogen market by distribution, 2024 - 2027 (mt)
- TABLE 148 UK transportation liquid hydrogen market by distribution, 2028 - 2032 (mt)
- TABLE 149 UK transportation liquid hydrogen market by distribution, 2019 - 2023 (USD Billion)
- TABLE 150 UK transportation liquid hydrogen market by distribution, 2024 - 2027 (USD Billion)
- TABLE 151 UK transportation liquid hydrogen market by distribution, 2028 - 2032 (USD Billion)
- TABLE 152 UK transportation liquid hydrogen market by production, 2019 - 2023 (mt)
- TABLE 153 UK transportation liquid hydrogen market by production, 2024 - 2027 (mt)
- TABLE 154 UK transportation liquid hydrogen market by production, 2028 - 2032 (mt)
- TABLE 155 UK transportation liquid hydrogen market by production, 2019 - 2023 (USD Billion)
- TABLE 156 UK transportation liquid hydrogen market by production, 2024 - 2027 (USD Billion)
- TABLE 157 UK transportation liquid hydrogen market by production, 2028 - 2032 (USD Billion)
- TABLE 158 France transportation liquid hydrogen market, 2019 - 2023 (Volume & Revenue)
- TABLE 159 France transportation liquid hydrogen market, 2024 - 2027 (Volume & Revenue)
- TABLE 160 France transportation liquid hydrogen market, 2028 - 2032 (Volume & Revenue)
- TABLE 161 France transportation liquid hydrogen market by distribution, 2019 - 2023 (mt)
- TABLE 162 France transportation liquid hydrogen market by distribution, 2024 - 2027 (mt)
- TABLE 163 France transportation liquid hydrogen market by distribution, 2028 - 2032 (mt)
- TABLE 164 France transportation liquid hydrogen market by distribution, 2019 - 2023 (USD Billion)
- TABLE 165 France transportation liquid hydrogen market by distribution, 2024 - 2027 (USD Billion)
- TABLE 166 France transportation liquid hydrogen market by distribution, 2028 - 2032 (USD Billion)
- TABLE 167 France transportation liquid hydrogen market by production, 2019 - 2023 (mt)
- TABLE 168 France transportation liquid hydrogen market by production, 2024 - 2027 (mt)
- TABLE 169 France transportation liquid hydrogen market by production, 2028 - 2032 (mt)
- TABLE 170 France transportation liquid hydrogen market by production, 2019 - 2023 (USD Billion)
- TABLE 171 France transportation liquid hydrogen market by production, 2024 - 2027 (USD Billion)
- TABLE 172 France transportation liquid hydrogen market by production, 2028 - 2032 (USD Billion)
- TABLE 173 Italy transportation liquid hydrogen market, 2019 - 2023 (Volume & Revenue)
- TABLE 174 Italy transportation liquid hydrogen market, 2024 - 2027 (Volume & Revenue)
- TABLE 175 Italy transportation liquid hydrogen market, 2028 - 2032 (Volume & Revenue)
- TABLE 176 Italy transportation liquid hydrogen market by distribution, 2019 - 2023 (mt)
- TABLE 177 Italy transportation liquid hydrogen market by distribution, 2024 - 2027 (mt)
- TABLE 178 Italy transportation liquid hydrogen market by distribution, 2028 - 2032 (mt)
- TABLE 179 Italy transportation liquid hydrogen market by distribution, 2019 - 2023 (USD Billion)
- TABLE 180 Italy transportation liquid hydrogen market by distribution, 2024 - 2027 (USD Billion)
- TABLE 181 Italy transportation liquid hydrogen market by distribution, 2028 - 2032 (USD Billion)
- TABLE 182 Italy transportation liquid hydrogen market by production, 2019 - 2023 (mt)
- TABLE 183 Italy transportation liquid hydrogen market by production, 2024 - 2027 (mt)
- TABLE 184 Italy transportation liquid hydrogen market by production, 2028 - 2032 (mt)
- TABLE 185 Italy transportation liquid hydrogen market by production, 2019 - 2023 (USD Billion)
- TABLE 186 Italy transportation liquid hydrogen market by production, 2024 - 2027 (USD Billion)
- TABLE 187 Italy transportation liquid hydrogen market by production, 2028 - 2032 (USD Billion)
- TABLE 188 Asia Pacific transportation liquid hydrogen market, 2019 - 2023 (Volume & Revenue)
- TABLE 189 Asia Pacific transportation liquid hydrogen market, 2024 - 2027 (Volume & Revenue)
- TABLE 190 Asia Pacific transportation liquid hydrogen market, 2028 - 2032 (Volume & Revenue)
- TABLE 191 Asia Pacific transportation liquid hydrogen market by distribution, 2019 - 2023 (mt)
- TABLE 192 Asia Pacific transportation liquid hydrogen market by distribution, 2024 - 2027 (mt)
- TABLE 193 Asia Pacific transportation liquid hydrogen market by distribution, 2028 - 2032 (mt)
- TABLE 194 Asia Pacific transportation liquid hydrogen market by distribution, 2019 - 2023 (USD Billion)
- TABLE 195 Asia Pacific transportation liquid hydrogen market by distribution, 2024 - 2027 (USD Billion)
- TABLE 196 Asia Pacific transportation liquid hydrogen market by distribution, 2028 - 2032 (USD Billion)
- TABLE 197 Asia Pacific transportation liquid hydrogen market by production, 2019 - 2023 (mt)
- TABLE 198 Asia Pacific transportation liquid hydrogen market by production, 2024 - 2027 (mt)
- TABLE 199 Asia Pacific transportation liquid hydrogen market by production, 2028 - 2032 (mt)
- TABLE 200 Asia Pacific transportation liquid hydrogen market by production, 2019 - 2023 (USD Billion)
- TABLE 201 Asia Pacific transportation liquid hydrogen market by production, 2024 - 2027 (USD Billion)
- TABLE 202 Asia Pacific transportation liquid hydrogen market by production, 2028 - 2032 (USD Billion)
- TABLE 203 China transportation liquid hydrogen market, 2019 - 2023 (Volume & Revenue)
- TABLE 204 China transportation liquid hydrogen market, 2024 - 2027 (Volume & Revenue)
- TABLE 205 China transportation liquid hydrogen market, 2028 - 2032 (Volume & Revenue)
- TABLE 206 China transportation liquid hydrogen market by distribution, 2019 - 2023 (mt)
- TABLE 207 China transportation liquid hydrogen market by distribution, 2024 - 2027 (mt)
- TABLE 208 China transportation liquid hydrogen market by distribution, 2028 - 2032 (mt)
- TABLE 209 China transportation liquid hydrogen market by distribution, 2019 - 2023 (USD Billion)
- TABLE 210 China transportation liquid hydrogen market by distribution, 2024 - 2027 (USD Billion)
- TABLE 211 China transportation liquid hydrogen market by distribution, 2028 - 2032 (USD Billion)
- TABLE 212 China transportation liquid hydrogen market by production, 2019 - 2023 (mt)
- TABLE 213 China transportation liquid hydrogen market by production, 2024 - 2027 (mt)
- TABLE 214 China transportation liquid hydrogen market by production, 2028 - 2032 (mt)
- TABLE 215 China transportation liquid hydrogen market by production, 2019 - 2023 (USD Billion)
- TABLE 216 China transportation liquid hydrogen market by production, 2024 - 2027 (USD Billion)
- TABLE 217 China transportation liquid hydrogen market by production, 2028 - 2032 (USD Billion)
- TABLE 218 Japan transportation liquid hydrogen market, 2019 - 2023 (Volume & Revenue)
- TABLE 219 Japan transportation liquid hydrogen market, 2024 - 2027 (Volume & Revenue)
- TABLE 220 Japan transportation liquid hydrogen market, 2028 - 2032 (Volume & Revenue)
- TABLE 221 Japan transportation liquid hydrogen market by distribution, 2019 - 2023 (mt)
- TABLE 222 Japan transportation liquid hydrogen market by distribution, 2024 - 2027 (mt)
- TABLE 223 Japan transportation liquid hydrogen market by distribution, 2028 - 2032 (mt)
- TABLE 224 Japan transportation liquid hydrogen market by distribution, 2019 - 2023 (USD Billion)
- TABLE 225 Japan transportation liquid hydrogen market by distribution, 2024 - 2027 (USD Billion)
- TABLE 226 Japan transportation liquid hydrogen market by distribution, 2028 - 2032 (USD Billion)
- TABLE 227 Japan transportation liquid hydrogen market by production, 2019 - 2023 (mt)
- TABLE 228 Japan transportation liquid hydrogen market by production, 2024 - 2027 (mt)
- TABLE 229 Japan transportation liquid hydrogen market by production, 2028 - 2032 (mt)
- TABLE 230 Japan transportation liquid hydrogen market by production, 2019 - 2023 (USD Billion)
- TABLE 231 Japan transportation liquid hydrogen market by production, 2024 - 2027 (USD Billion)
- TABLE 232 Japan transportation liquid hydrogen market by production, 2028 - 2032 (USD Billion)
- TABLE 233 South Korea transportation liquid hydrogen market, 2019 - 2023 (Volume & Revenue)
- TABLE 234 South Korea transportation liquid hydrogen market, 2024 - 2027 (Volume & Revenue)
- TABLE 235 South Korea transportation liquid hydrogen market, 2028 - 2032 (Volume & Revenue)
- TABLE 236 South Korea transportation liquid hydrogen market by distribution, 2019 - 2023 (mt)
- TABLE 237 South Korea transportation liquid hydrogen market by distribution, 2024 - 2027 (mt)
- TABLE 238 South Korea transportation liquid hydrogen market by distribution, 2028 - 2032 (mt)
- TABLE 239 South Korea transportation liquid hydrogen market by distribution, 2019 - 2023 (USD Billion)
- TABLE 240 South Korea transportation liquid hydrogen market by distribution, 2024 - 2027 (USD Billion)
- TABLE 241 South Korea transportation liquid hydrogen market by distribution, 2028 - 2032 (USD Billion)
- TABLE 242 South Korea transportation liquid hydrogen market by production, 2019 - 2023 (mt)
- TABLE 243 South Korea transportation liquid hydrogen market by production, 2024 - 2027 (mt)
- TABLE 244 South Korea transportation liquid hydrogen market by production, 2028 - 2032 (mt)
- TABLE 245 South Korea transportation liquid hydrogen market by production, 2019 - 2023 (USD Billion)
- TABLE 246 South Korea transportation liquid hydrogen market by production, 2024 - 2027 (USD Billion)
- TABLE 247 South Korea transportation liquid hydrogen market by production, 2028 - 2032 (USD Billion)
- TABLE 248 India transportation liquid hydrogen market, 2019 - 2023 (Volume & Revenue)
- TABLE 249 India transportation liquid hydrogen market, 2024 - 2027 (Volume & Revenue)
- TABLE 250 India transportation liquid hydrogen market, 2028 - 2032 (Volume & Revenue)
- TABLE 251 India transportation liquid hydrogen market by distribution, 2019 - 2023 (mt)
- TABLE 252 India transportation liquid hydrogen market by distribution, 2024 - 2027 (mt)
- TABLE 253 India transportation liquid hydrogen market by distribution, 2028 - 2032 (mt)
- TABLE 254 India transportation liquid hydrogen market by distribution, 2019 - 2023 (USD Billion)
- TABLE 255 India transportation liquid hydrogen market by distribution, 2024 - 2027 (USD Billion)
- TABLE 256 India transportation liquid hydrogen market by distribution, 2028 - 2032 (USD Billion)
- TABLE 257 India transportation liquid hydrogen market by production, 2019 - 2023 (mt)
- TABLE 258 India transportation liquid hydrogen market by production, 2024 - 2027 (mt)
- TABLE 259 India transportation liquid hydrogen market by production, 2028 - 2032 (mt)
- TABLE 260 India transportation liquid hydrogen market by production, 2019 - 2023 (USD Billion)
- TABLE 261 India transportation liquid hydrogen market by production, 2024 - 2027 (USD Billion)
- TABLE 262 India transportation liquid hydrogen market by production, 2028 - 2032 (USD Billion)
- TABLE 263 Australia transportation liquid hydrogen market, 2019 - 2023 (Volume & Revenue)
- TABLE 264 Australia transportation liquid hydrogen market, 2024 - 2027 (Volume & Revenue)
- TABLE 265 Australia transportation liquid hydrogen market, 2028 - 2032 (Volume & Revenue)
- TABLE 266 Australia transportation liquid hydrogen market by distribution, 2019 - 2023 (mt)
- TABLE 267 Australia transportation liquid hydrogen market by distribution, 2024 - 2027 (mt)
- TABLE 268 Australia transportation liquid hydrogen market by distribution, 2028 - 2032 (mt)
- TABLE 269 Australia transportation liquid hydrogen market by distribution, 2019 - 2023 (USD Billion)
- TABLE 270 Australia transportation liquid hydrogen market by distribution, 2024 - 2027 (USD Billion)
- TABLE 271 Australia transportation liquid hydrogen market by distribution, 2028 - 2032 (USD Billion)
- TABLE 272 Australia transportation liquid hydrogen market by production, 2019 - 2023 (mt)
- TABLE 273 Australia transportation liquid hydrogen market by production, 2024 - 2027 (mt)
- TABLE 274 Australia transportation liquid hydrogen market by production, 2028 - 2032 (mt)
- TABLE 275 Australia transportation liquid hydrogen market by production, 2019 - 2023 (USD Billion)
- TABLE 276 Australia transportation liquid hydrogen market by production, 2024 - 2027 (USD Billion)
- TABLE 277 Australia transportation liquid hydrogen market by production, 2028 - 2032 (USD Billion)
Charts & Figures
- FIG. 1 GMI report coverage critical research elements
- FIG. 2 Industry segmentation
- FIG. 3 Market forecasting methodology
- FIG. 4 Profile break-up of primary respondents
- FIG. 5 Transportation liquid hydrogen industry 360 degree synopsis, 2019 - 2032
- FIG. 6 Industry ecosystem analysis
- FIG. 7 Overall view of COVID- 19 effect, 2019 - 2032 (USD Billion)
- FIG. 8 Growth potential analysis
- FIG. 9 Porter's Analysis
- FIG. 10 PESTEL Analysis
- FIG. 11 SWOT analysis, Air Liquide
- FIG. 12 SWOT analysis, Air Products and Chemicals, Inc.
- FIG. 13 SWOT analysis, Iwatani Corporation
- FIG. 14 SWOT analysis, Messer
- FIG. 15 SWOT analysis, Plug Power Inc.
- FIG. 16 SWOT analysis, ENGIE
- FIG. 17 SWOT analysis, Linde plc
- FIG. 18 SWOT analysis, GE Appliances
- FIG. 19 SWOT analysis, Shell plc
- FIG. 20 SWOT anlysis, Chart Industries
- FIG. 21 SWOT analysis, Kawasaki Heavy Industries, Ltd.
- FIG. 22 SWOT analysis, INOX India limited
- FIG. 23 SWOT analysis, GenH2
- FIG. 24 SWOT analysis, Praxair Technology, Inc.
- FIG. 25 SWOT analysis, Salzburger Aluminium Group
Transportation liquid hydrogen market size is projected to expand at over 6% CAGR from 2024 to 2032. The global shift towards sustainable energy sources is increasing the interest in hydrogen as a clean fuel for transportation. For instance, in December 2023, Chinese startup Hybot launched the world's first gaseous-hydrogen-powered truck, boasting over 1,000km range, and using 8kg of H2 per 100km at high speed with a full 49-tonne cargo load.
Liquid hydrogen offers versatility in various modes of transport, including fuel cell vehicles and heavy-duty trucks. The rising government initiatives and incentives is helping in promoting hydrogen-powered transportation. The increasing focus on reducing carbon emissions and achieving decarbonization goals in the transportation sector is further fueling the demand for liquid hydrogen. Additionally, rapid advancements in hydrogen production technologies and infrastructure development will contribute to the market expansion.
The transportation liquid hydrogen market is segregated into distribution, production, and region.
Based on production, the market value from the electrolysis segment is anticipated to rise at substantial CAGR from 2024 to 2032, owing to the rising demand for green hydrogen. Electrolysis, powered by renewable energy sources, helps to produce hydrogen without carbon emissions, further aligning with sustainability goals. Moreover, the increasing investments in electrolysis infrastructure, rapid technological advancements, and rising governmental support for clean energy solutions will drive the segment growth.
Transportation liquid hydrogen market share from the pipeline distribution segment is projected to witness significant growth from 2024 to 2032. This is due to the efficiency and cost-effectiveness offered by hydrogen transportation through pipelines. The development of a robust pipeline infrastructure is facilitating the widespread distribution of liquid hydrogen. Additionally, the increasing focus on optimizing hydrogen supply chains will boost the segment expansion.
Regionally, the North America transportation liquid hydrogen industry size is projected to expand at commendable CAGR from 2024 to 2032. The growth can be attributed to the rising commitment to decarbonization, supportive government initiatives, and increasing investments in hydrogen infrastructure. The surging demand for clean and sustainable transportation solutions along with the increasing technological advancements will also fuel the regional market expansion.
Table of Contents
Chapter 1 Methodology & Scope
- 1.1 Market definitions
- 1.2 Base estimates & calculations
- 1.3 Forecast calculation
- 1.4 Data sources
- 1.4.1 Primary
- 1.4.2 Secondary
- 1.4.2.1 Paid sources
- 1.4.2.2 Unpaid sources
Chapter 2 Executive Summary
- 2.1 Business trends
- 2.2 Distribution trends
- 2.3 Production trends
- 2.4 Regional trends
Chapter 3 Transportation Liquid Hydrogen Industry Insights
- 3.1 Industry ecosystem analysis
- 3.1.1 Vendor matrix
- 3.2 Regulatory landscape
- 3.3 Industry impact forces
- 3.3.1 Growth drivers
- 3.3.1.1 Shifting focus toward decarbonization
- 3.3.1.2 Surging interest in alternative fuels
- 3.3.2 Industry pitfalls & challenges
- 3.3.2.1 Lack of network of hydrogen fuelling stations
- 3.3.1 Growth drivers
- 3.4 Growth potential analysis
- 3.5 Porter's Analysis
- 3.5.1 Bargaining power of suppliers
- 3.5.2 Bargaining power of buyers
- 3.5.3 Threat of new entrants
- 3.5.4 Threat of substitutes
- 3.6 PESTEL Analysis
Chapter 4 Competitive Benchmarking
- 4.1 Innovation & sustainability landscape
- 4.2 Competitive landscape, 2023
- 4.2.1 Strategic dashboard
Chapter 5 Transportation Liquid Hydrogen Market, By Distribution
- 5.1 Key distribution trends
- 5.2 Pipelines
- 5.3 Cryogenic tanks
Chapter 6 Transportation Liquid Hydrogen Market, By Production
- 6.1 Key production trends
- 6.2 Coal gasification
- 6.3 SMR
- 6.4 Electrolysis
Chapter 7 Transportation Liquid Hydrogen Market, By Region
- 7.1 Key regional trends
- 7.2 North America
- 7.2.1 U.S.
- 7.2.2 Canada
- 7.3 Europe
- 7.3.1 Germany
- 7.3.2 UK
- 7.3.3 France
- 7.3.4 Italy
- 7.4 Asia Pacific
- 7.4.1 China
- 7.4.2 Japan
- 7.4.3 South Korea
- 7.4.4 India
- 7.4.5 Australia
Chapter 8 Company Profiles
- 8.1 Air Liquide
- 8.2 Air Products and Chemicals, Inc.
- 8.3 Iwatani Corporation
- 8.4 Messer
- 8.5 Plug Power Inc.
- 8.6 ENGIE
- 8.7 Linde plc
- 8.8 GE Appliances
- 8.9 Shell plc
- 8.10 Chart Industries
- 8.11 Kawasaki Heavy Industries, Ltd.
- 8.12 INOX India limited
- 8.13 GenH2
- 8.14 Praxair Technology, Inc.
- 8.15 Salzburger Aluminium Group