
|
市場調査レポート
商品コード
1666582
水素エネルギー貯蔵の市場機会、成長促進要因、産業動向分析、2025年~2034年予測Hydrogen Energy Storage Market Opportunity, Growth Drivers, Industry Trend Analysis, and Forecast 2025 - 2034 |
||||||
カスタマイズ可能
|
|||||||
| 水素エネルギー貯蔵の市場機会、成長促進要因、産業動向分析、2025年~2034年予測 |
|
出版日: 2024年12月04日
発行: Global Market Insights Inc.
ページ情報: 英文 80 Pages
納期: 2~3営業日
|

全表示
- 概要
- 目次
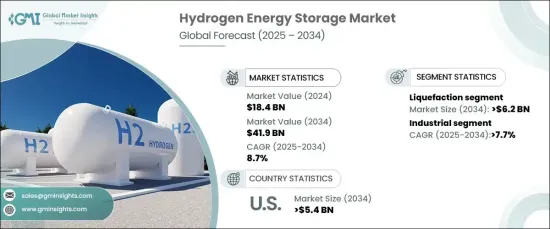
世界の水素エネルギー貯蔵市場は、2024年に184億米ドルとなり、2025年から2034年までのCAGRは8.7%と予想され、大幅な成長が見込まれています。
この成長には、太陽光や風力などの再生可能エネルギー源の導入が増加していることが大きく寄与しています。これらのエネルギー源は本質的に変動しやすく、送電網の安定性を維持する上で課題が生じる可能性があります。水素エネルギー貯蔵は、余剰の再生可能エネルギーを回収し、発電量が少ない期間に電力に変換することで、信頼できるエネルギー供給を確保する効果的なソリューションを提供します。
水素貯蔵技術の進歩は、市場の状況を一変させつつあります。圧縮水素や極低温液体水素の貯蔵方法は、その効率性と拡張性により、ますます普及しています。さらに、金属水素化物や液体有機水素キャリアを含む材料ベースの貯蔵オプションは、様々な用途に対してより安全でスペース効率の高いソリューションを提供しています。固体水素貯蔵システムやアンモニアベースの水素貯蔵システムといった新しい技術も活発に開発されており、業界をさらに多様化しています。これらの技術革新は、貯蔵密度、輸送、効率に関する重要な課題に対処し、実行可能なエネルギーキャリアとしての水素の役割を強化しています。
| 市場範囲 | |
|---|---|
| 開始年 | 2024年 |
| 予測年 | 2025年~2034年 |
| 開始金額 | 184億米ドル |
| 予測金額 | 419億米ドル |
| CAGR | 8.7% |
貯蔵方法に関しては、液化分野が大きな成長を遂げ、2034年までに62億米ドルに達すると予想されます。その魅力は、水素を高いエネルギー密度でコンパクトに貯蔵できる点にあり、大規模な用途に適しています。この方式は、世界の脱炭素化への取り組みが強化される中、クリーンなエネルギーキャリアに対する需要の増加を支えています。水素インフラへの投資拡大は、液化技術の採用をさらに後押しします。
用途の面では、産業セクターが予測期間中にCAGR7.7%以上で成長すると予測されています。産業界は、エネルギー効率を高め、排出を削減するために、水素貯蔵システムの統合にますます力を入れるようになっています。水素は様々な産業プロセスで重要な役割を果たし、世界の気候変動目標に合致し、持続可能なエネルギーソリューションへの移行を支援しています。
米国の水素エネルギー貯蔵市場は、再生可能エネルギーと脱炭素イニシアティブへの戦略的投資によって、2034年までに54億米ドルを超えると予測されています。2050年までにネットゼロエミッションを達成するという国家のコミットメントが、水素製造・貯蔵システムの開発を加速させています。再生可能エネルギーに由来するグリーン水素の重視は、同国のエネルギー転換戦略における水素の極めて重要な役割を浮き彫りにしています。
目次
第1章 調査手法と調査範囲
- 市場の定義
- 基本推定と計算
- 予測計算
- データソース
- 一次
- 二次
- 有償
- 公的
第2章 エグゼクティブサマリー
第3章 業界洞察
- 業界エコシステム分析
- 規制状況
- 業界への影響要因
- 成長促進要因
- 業界の潜在的リスク・課題
- 成長ポテンシャル分析
- ポーター分析
- 供給企業の交渉力
- 買い手の交渉力
- 新規参入業者の脅威
- 代替品の脅威
- PESTEL分析
第4章 競合情勢
- 戦略ダッシュボード
- イノベーションと持続可能性の展望
第5章 市場規模・予測:手法別、2021年~2034年
- 主要動向
- 圧縮
- 液化
- 材料ベース
第6章 市場規模・予測:用途別、2021年~2034年
- 主要動向
- 産業
- 輸送
- 据置
- その他
第7章 市場規模・予測:地域別、2021年~2034年
- 主要動向
- 北米
- 米国
- カナダ
- メキシコ
- 欧州
- ドイツ
- 英国
- フランス
- イタリア
- オランダ
- ロシア
- アジア太平洋
- 中国
- インド
- 日本
- 世界のその他の地域
第8章 企業プロファイル
- Air Liquide
- Air Products
- Cockerill Jingli Hydrogen
- Engie
- FuelCell Energy
- GKN Hydrogen
- Gravitricity
- Hydrogen in Motion
- ITM Power
- Linde
- McPhy Energy
- Nel
- SSE
The Global Hydrogen Energy Storage Market, valued at USD 18.4 billion in 2024, is poised for substantial growth, with an anticipated CAGR of 8.7% from 2025 to 2034. This growth is largely fueled by the rising adoption of renewable energy sources such as solar and wind, which are inherently variable and can create challenges in maintaining grid stability. Hydrogen energy storage offers an effective solution by capturing excess renewable energy and converting it into electricity during periods of low generation, ensuring a reliable energy supply.
Advancements in hydrogen storage technologies are transforming the market landscape. Compressed and cryogenic liquid hydrogen storage methods are becoming increasingly popular due to their efficiency and scalability. In addition, material-based storage options, including metal hydrides and liquid organic hydrogen carriers, provide safer and more space-efficient solutions for various applications. Emerging technologies such as solid-state and ammonia-based hydrogen storage systems are also under active development, further diversifying the industry. These innovations address critical challenges related to storage density, transportation, and efficiency, strengthening hydrogen's role as a viable energy carrier.
| Market Scope | |
|---|---|
| Start Year | 2024 |
| Forecast Year | 2025-2034 |
| Start Value | $18.4 Billion |
| Forecast Value | $41.9 Billion |
| CAGR | 8.7% |
In terms of storage methods, the liquefaction segment is expected to witness significant growth, reaching USD 6.2 billion by 2034. Its appeal lies in its ability to store hydrogen in a compact form with high energy density, making it suitable for large-scale applications. This method supports the increasing demand for clean energy carriers as global decarbonization efforts intensify. Expanding investments in hydrogen infrastructure further drive the adoption of liquefaction technologies.
On the application front, the industrial sector is projected to grow at a CAGR of over 7.7% during the forecast period. Industries are increasingly focusing on integrating hydrogen storage systems to enhance energy efficiency and reduce emissions. Hydrogen serves as a critical component in various industrial processes, aligning with global climate goals and supporting the transition toward sustainable energy solutions.
The U.S. hydrogen energy storage market is forecast to exceed USD 5.4 billion by 2034, driven by strategic investments in renewable energy and decarbonization initiatives. The nation's commitment to achieving net-zero emissions by 2050 has accelerated the development of hydrogen production and storage systems. The emphasis on green hydrogen, derived from renewable energy sources, highlights its pivotal role in the country's energy transition strategy.
Table of Contents
Chapter 1 Methodology & Scope
- 1.1 Market definitions
- 1.2 Base estimates & calculations
- 1.3 Forecast calculation
- 1.4 Data sources
- 1.4.1 Primary
- 1.4.2 Secondary
- 1.4.2.1 Paid
- 1.4.2.2 Public
Chapter 2 Executive Summary
- 2.1 Industry synopsis, 2021 – 2034
Chapter 3 Industry Insights
- 3.1 Industry ecosystem analysis
- 3.2 Regulatory landscape
- 3.3 Industry impact forces
- 3.3.1 Growth drivers
- 3.3.2 Industry pitfalls & challenges
- 3.4 Growth potential analysis
- 3.5 Porter's analysis
- 3.5.1 Bargaining power of suppliers
- 3.5.2 Bargaining power of buyers
- 3.5.3 Threat of new entrants
- 3.5.4 Threat of substitutes
- 3.6 PESTEL analysis
Chapter 4 Competitive landscape, 2024
- 4.1 Strategic dashboard
- 4.2 Innovation & sustainability landscape
Chapter 5 Market Size and Forecast, By Method, 2021 – 2034 (USD Million)
- 5.1 Key trends
- 5.2 Compression
- 5.3 Liquefaction
- 5.4 Material-based
Chapter 6 Market Size and Forecast, By Application, 2021 – 2034 (USD Million)
- 6.1 Key trends
- 6.2 Industrial
- 6.3 Transportation
- 6.4 Stationary
- 6.5 Others
Chapter 7 Market Size and Forecast, By Region, 2021 – 2034 (USD Million)
- 7.1 Key trends
- 7.2 North America
- 7.2.1 U.S.
- 7.2.2 Canada
- 7.2.3 Mexico
- 7.3 Europe
- 7.3.1 Germany
- 7.3.2 UK
- 7.3.3 France
- 7.3.4 Italy
- 7.3.5 Netherlands
- 7.3.6 Russia
- 7.4 Asia Pacific
- 7.4.1 China
- 7.4.2 India
- 7.4.3 Japan
- 7.5 Rest of World
Chapter 8 Company Profiles
- 8.1 Air Liquide
- 8.2 Air Products
- 8.3 Cockerill Jingli Hydrogen
- 8.4 Engie
- 8.5 FuelCell Energy
- 8.6 GKN Hydrogen
- 8.7 Gravitricity
- 8.8 Hydrogen in Motion
- 8.9 ITM Power
- 8.10 Linde
- 8.11 McPhy Energy
- 8.12 Nel
- 8.13 SSE

