|
|
市場調査レポート
商品コード
1426992
包装材料市場:材料別、製品別、最終用途別&予測 2024年~2032年Packaging Materials Market - By Materials, By Product, By End-use & Forecast, 2024 - 2032 |
||||||
|
|
|||||||
|
● お客様のご希望に応じて、既存データの加工や未掲載情報(例:国別セグメント)の追加などの対応が可能です。 詳細はお問い合わせください。 |
|||||||


| 包装材料市場:材料別、製品別、最終用途別&予測 2024年~2032年 |
|
出版日: 2024年01月08日
発行: Global Market Insights Inc.
ページ情報: 英文 300 Pages
納期: 2~3営業日
|
- 全表示
- 概要
- 図表
- 目次
包装材料市場は、eコマース活動の活発化により、2024年から2032年にかけて4.9%以上のCAGRを記録すると予測されています。
Oberloによると、2023年のデジタルバイヤーは約26億4,000万人で、2024年には27億1,000万人、2025年には27億7,000万人に達すると予想されています。消費者が買い物のニーズをオンライン・プラットフォームに求めるようになるにつれ、包装分野では、商品の輸送と保護に安全で持続可能なソリューションを提供する素材に対する需要が高まっています。
消費者は環境への影響への懸念を強めており、リサイクル可能、生分解性、再生可能な資源から作られた素材への需要が急増しています。このような環境意識は、持続可能な包装材料の採用に影響を与え、業界の成長を促進しています。
包装材料産業は、材料、製品、最終用途、地域によって分けられます。
箱・木箱部門は、物流・輸送部門の成長により、2032年まで顕著な成長を記録すると思われます。この製品は、輸送中の商品に不可欠な保護を提供し、その完全性を確保し、損傷のリスクを最小限に抑えます。eコマースの急増と、サプライ・チェーン業務における効率的な包装の必要性により、箱と木枠は好まれる選択肢となっています。
化粧品部門は、美観と持続可能性のダイナミックな相互作用によって支持され、2024~2032年の間に顕著な収益を上げると予想されています。化粧品分野では、製品の魅力と競合を高めるため、視覚に訴える革新的なパッケージが重視されています。ユニークな形状、素材、デザインは明確なブランド・アイデンティティを生み出します。同時に、化粧品業界では持続可能なパッケージング・ソリューションが重視されるようになっており、環境に優しくリサイクル可能なオプションを求める消費者の嗜好と一致しています。
この地域の厳しい規制枠組みが持続可能でリサイクル可能な包装材料の重要性を強調し、イノベーションを促進しているため、欧州の包装材料産業規模は2032年まで顕著な成長を記録すると思われます。環境意識が高まる欧州の消費者は、循環型経済の原則に沿った包装ソリューションへの需要を促進しています。プレミアム化の台頭は包装の美観と機能性への関心を高め、高品質素材の採用を促します。
目次
第1章 調査手法と調査範囲
第2章 エグゼクティブサマリー
第3章 包装材料産業洞察
- エコシステム分析
- 技術概要
- 主要ニュースと取り組み
- 提携/協力
- 合併/買収
- 投資
- 製品発表とイノベーション
- 規制状況
- 影響要因
- 促進要因
- 業界の潜在的リスク&課題
- 主要サプライヤー分析
- 潜在成長力分析
- ポーター分析
- PESTEL分析
第4章 競合情勢
- イントロダクション
- 各社の市場シェア
- 主要市場プレーヤーの競合分析
- 競合のポジショニング・マトリックス
- 戦略展望マトリックス
第5章 包装材料市場推計・予測:素材別
- 紙・段ボール
- 硬質プラスチック
- 金属
- 軟質プラスチック
- ガラス
- 木材
- 繊維
- その他
第6章 包装材料市場推計・予測:製品別
- ボトル・缶
- 容器・瓶
- バッグ、パウチ、ラップ
- 栓・蓋
- 箱・クレート
- ドラム・IBC
- その他
第7章 包装材料市場推計・予測:用途別
- 食品
- 飲料
- ヘルスケア
- 化粧品
- 家庭用品
- 化学品
- その他
第8章 包装材料市場推計・予測:地域別
- 主要動向:地域別
- 北米
- 米国
- カナダ
- 欧州
- 英国
- ドイツ
- フランス
- イタリア
- スペイン
- ロシア
- アジア太平洋
- 中国
- インド
- 日本
- 韓国
- オーストラリア
- マレーシア
- インドネシア
- ラテンアメリカ
- ブラジル
- メキシコ
- アルゼンチン
- 中東・アフリカ
- サウジアラビア
- アラブ首長国連邦
- 南アフリカ
第9章 企業プロファイル
- Amcor
- Ball Corporation
- Crown Holding
- International Paper Company
- Mondi
- Owens-Illinois
- Reynolds Group
- Sealed Air
- Stora Enso
- Berry Plastics
Data Tables
- TABLE 1. Product mapping
- TABLE 2. Market Revenue, by material (2022)
- TABLE 3. Market Revenue, by product (2022)
- TABLE 4. Market Revenue, by end-use (2022)
- TABLE 5. Market Revenue, by region (2022)
- TABLE 6. Global packaging materials market size, 2018 - 2032 (USD Billion)
- TABLE 7. Global packaging materials market size, 2018 - 2032 (kilo Tons)
- TABLE 8. Global packaging materials market size, by region, 2018 - 2032 (USD Billion)
- TABLE 9. Global packaging materials market size, by region, 2018 - 2032 (kilo Tons)
- TABLE 10. Global packaging materials market size, by material, 2018 - 2032 (USD Billion)
- TABLE 11. Global packaging materials market size, by material, 2018 - 2032 (kilo Tons)
- TABLE 12. Global packaging materials market size, by product, 2018 - 2032 (USD Billion)
- TABLE 13. Global packaging materials market size, by product, 2018 - 2032 (kilo Tons)
- TABLE 14. Global packaging materials market size, by end-use, 2018 - 2032 (USD Billion)
- TABLE 15. Global packaging materials market size, by end-use, 2018 - 2032 (kilo Tons)
- TABLE 16. Industry impact forces
- TABLE 17. North America packaging materials market size, by country, 2018 - 2032 (USD Billion)
- TABLE 18. North America packaging materials market size, by country, 2018 - 2032 (USD Billion)
- TABLE 19. North America packaging materials market size, by material, 2018 - 2032 (USD Billion)
- TABLE 20. North America packaging materials market size, by material, 2018 - 2032 (kilo Tons)
- TABLE 21. North America packaging materials market size, by end-use, 2018 - 2032 (USD Billion)
- TABLE 22. North America packaging materials market size, by end-use, 2018 - 2032 (kilo Tons)
- TABLE 23. North America packaging materials market size, by product, 2018 - 2032 (USD Billion)
- TABLE 24. North America packaging materials market size, by product, 2018 - 2032 (kilo Tons)
- TABLE 25. U.S. packaging materials market size, by material, 2018 - 2032 (USD Billion)
- TABLE 26. U.S. packaging materials market size, by material, 2018 - 2032 (kilo Tons)
- TABLE 27. U.S. packaging materials market size, by end-use, 2018 - 2032 (USD Billion)
- TABLE 28. U.S. packaging materials market size, by end-use, 2018 - 2032 (kilo Tons)
- TABLE 29. U.S. packaging materials market size, by product, 2018 - 2032 (USD Billion)
- TABLE 30. U.S. packaging materials market size, by product, 2018 - 2032 (kilo Tons)
- TABLE 31. Canada packaging materials market size, by material, 2018 - 2032 (USD Billion)
- TABLE 32. Canada packaging materials market size, by material, 2018 - 2032 (kilo Tons)
- TABLE 33. Canada packaging materials market size, by end-use, 2018 - 2032 (USD Billion)
- TABLE 34. Canada packaging materials market size, by end-use, 2018 - 2032 (kilo Tons)
- TABLE 35. Canada packaging materials market size, by product, 2018 - 2032 (USD Billion)
- TABLE 36. Canada packaging materials market size, by product, 2018 - 2032 (kilo Tons)
- TABLE 37. Europe packaging materials market size, by country, 2018 - 2032 (USD Billion)
- TABLE 38. Europe packaging materials market size, by country, 2018 - 2032 (kilo Tons)
- TABLE 39. Europe packaging materials market size, by country, 2018 - 2032 (USD Billion)
- TABLE 40. Europe packaging materials market size, by country, 2018 - 2032 (kilo Tons)
- TABLE 41. Europe packaging materials market size, by material, 2018 - 2032 (USD Billion)
- TABLE 42. Europe packaging materials market size, by material, 2018 - 2032 (kilo Tons)
- TABLE 43. Europe packaging materials market size, by end-use, 2018 - 2032 (USD Billion)
- TABLE 44. Europe packaging materials market size, by end-use, 2018 - 2032 (kilo Tons)
- TABLE 45. Europe packaging materials market size, by product, 2018 - 2032 (USD Billion)
- TABLE 46. Europe packaging materials market size, by product, 2018 - 2032 (kilo Tons)
- TABLE 47. Germany packaging materials market size, by material, 2018 - 2032 (USD Billion)
- TABLE 48. Germany packaging materials market size, by material, 2018 - 2032 (kilo Tons)
- TABLE 49. Germany packaging materials market size, by end-use, 2018 - 2032 (USD Billion)
- TABLE 50. Germany packaging materials market size, by end-use, 2018 - 2032 (kilo Tons)
- TABLE 51. Germany packaging materials market size, by product, 2018 - 2032 (USD Billion)
- TABLE 52. Germany packaging materials market size, by product, 2018 - 2032 (kilo Tons)
- TABLE 53. UK packaging materials market size, by material, 2018 - 2032 (USD Billion)
- TABLE 54. UK packaging materials market size, by material, 2018 - 2032 (kilo Tons)
- TABLE 55. UK packaging materials market size, by end-use, 2018 - 2032 (USD Billion)
- TABLE 56. UK packaging materials market size, by end-use, 2018 - 2032 (kilo Tons)
- TABLE 57. UK packaging materials market size, by product, 2018 - 2032 (USD Billion)
- TABLE 58. UK packaging materials market size, by product, 2018 - 2032 (kilo Tons)
- TABLE 59. France packaging materials market size, by material, 2018 - 2032 (USD Billion)
- TABLE 60. France packaging materials market size, by material, 2018 - 2032 (kilo Tons)
- TABLE 61. France packaging materials market size, by end-use, 2018 - 2032 (USD Billion)
- TABLE 62. France packaging materials market size, by end-use, 2018 - 2032 (kilo Tons)
- TABLE 63. France packaging materials market size, by product, 2018 - 2032 (USD Billion)
- TABLE 64. France packaging materials market size, by product, 2018 - 2032 (kilo Tons)
- TABLE 65. Spain packaging materials market size, by material, 2018 - 2032 (USD Billion)
- TABLE 66. Spain packaging materials market size, by material, 2018 - 2032 (kilo Tons)
- TABLE 67. Spain packaging materials market size, by end-use, 2018 - 2032 (USD Billion)
- TABLE 68. Spain packaging materials market size, by end-use, 2018 - 2032 (kilo Tons)
- TABLE 69. Spain packaging materials market size, by product, 2018 - 2032 (USD Billion)
- TABLE 70. Spain packaging materials market size, by product, 2018 - 2032 (kilo Tons)
- TABLE 71. Italy packaging materials market size, by material, 2018 - 2032 (USD Billion)
- TABLE 72. Italy packaging materials market size, by material, 2018 - 2032 (kilo Tons)
- TABLE 73. Italy packaging materials market size, by end-use, 2018 - 2032 (USD Billion)
- TABLE 74. Italy packaging materials market size, by end-use, 2018 - 2032 (kilo Tons)
- TABLE 75. Italy packaging materials market size, by product, 2018 - 2032 (USD Billion)
- TABLE 76. Italy packaging materials market size, by product, 2018 - 2032 (kilo Tons)
- TABLE 77. Asia Pacific packaging materials market size, by country, 2018 - 2032 (USD Billion)
- TABLE 78. Asia Pacific packaging materials market size, by country, 2018 - 2032 (kilo Tons)
- TABLE 79. Asia Pacific packaging materials market size, by material, 2018 - 2032 (USD Billion)
- TABLE 80. Asia Pacific packaging materials market size, by material, 2018 - 2032 (kilo Tons)
- TABLE 81. Asia Pacific packaging materials market size, by end-use, 2018 - 2032 (USD Billion)
- TABLE 82. Asia Pacific packaging materials market size, by end-use, 2018 - 2032 (kilo Tons)
- TABLE 83. Asia Pacific packaging materials market size, by product, 2018 - 2032 (USD Billion)
- TABLE 84. Asia Pacific packaging materials market size, by product, 2018 - 2032 (kilo Tons)
- TABLE 85. China packaging materials market size, by material, 2018 - 2032 (USD Billion)
- TABLE 86. China packaging materials market size, by material, 2018 - 2032 (kilo Tons)
- TABLE 87. China packaging materials market size, by end-use, 2018 - 2032 (USD Billion)
- TABLE 88. China packaging materials market size, by end-use, 2018 - 2032 (kilo Tons)
- TABLE 89. China packaging materials market size, by product, 2018 - 2032 (USD Billion)
- TABLE 90. China packaging materials market size, by product, 2018 - 2032 (kilo Tons)
- TABLE 91. Japan packaging materials market size, by material, 2018 - 2032 (USD Billion)
- TABLE 92. Japan packaging materials market size, by material, 2018 - 2032 (kilo Tons)
- TABLE 93. Japan packaging materials market size, by end-use, 2018 - 2032 (USD Billion)
- TABLE 94. Japan packaging materials market size, by end-use, 2018 - 2032 (kilo Tons)
- TABLE 95. Japan packaging materials market size, by product, 2018 - 2032 (USD Billion)
- TABLE 96. Japan packaging materials market size, by product, 2018 - 2032 (kilo Tons)
- TABLE 97. India packaging materials market size, by material, 2018 - 2032 (USD Billion)
- TABLE 98. India packaging materials market size, by material, 2018 - 2032 (kilo Tons)
- TABLE 99. India packaging materials market size, by end-use, 2018 - 2032 (USD Billion)
- TABLE 100. India packaging materials market size, by end-use, 2018 - 2032 (kilo Tons)
- TABLE 101. India packaging materials market size, by product, 2018 - 2032 (USD Billion)
- TABLE 102. India packaging materials market size, by product, 2018 - 2032 (kilo Tons)
- TABLE 103. Australia packaging materials market size, by material, 2018 - 2032 (USD Billion)
- TABLE 104. Australia packaging materials market size, by material, 2018 - 2032 (kilo Tons)
- TABLE 105. Australia packaging materials market size, by end-use, 2018 - 2032 (USD Billion)
- TABLE 106. Australia packaging materials market size, by end-use, 2018 - 2032 (kilo Tons)
- TABLE 107. Australia packaging materials market size, by product, 2018 - 2032 (USD Billion)
- TABLE 108. Australia packaging materials market size, by product, 2018 - 2032 (kilo Tons)
- TABLE 109. South Korea packaging materials market size, by material, 2018 - 2032 (USD Billion)
- TABLE 110. South Korea packaging materials market size, by material, 2018 - 2032 (kilo Tons)
- TABLE 111. South Korea packaging materials market size, by end-use, 2018 - 2032 (USD Billion)
- TABLE 112. South Korea packaging materials market size, by end-use, 2018 - 2032 (kilo Tons)
- TABLE 113. South Korea packaging materials market size, by product, 2018 - 2032 (USD Billion)
- TABLE 114. South Korea packaging materials market size, by product, 2018 - 2032 (kilo Tons)
- TABLE 115. Indonesia packaging materials market size, by material, 2018 - 2032 (USD Billion)
- TABLE 116. Indonesia packaging materials market size, by material, 2018 - 2032 (kilo Tons)
- TABLE 117. Indonesia packaging materials market size, by end-use, 2018 - 2032 (USD Billion)
- TABLE 118. Indonesia packaging materials market size, by end-use, 2018 - 2032 (kilo Tons)
- TABLE 119. Indonesia packaging materials market size, by product, 2018 - 2032 (USD Billion)
- TABLE 120. Indonesia packaging materials market size, by product, 2018 - 2032 (kilo Tons)
- TABLE 121. Malaysia packaging materials market size, by material, 2018 - 2032 (USD Billion)
- TABLE 122. Malaysia packaging materials market size, by material, 2018 - 2032 (kilo Tons)
- TABLE 123. Malaysia packaging materials market size, by end-use, 2018 - 2032 (USD Billion)
- TABLE 124. Malaysia packaging materials market size, by end-use, 2018 - 2032 (kilo Tons)
- TABLE 125. Malaysia packaging materials market size, by product, 2018 - 2032 (USD Billion)
- TABLE 126. Malaysia packaging materials market size, by product, 2018 - 2032 (kilo Tons)
- TABLE 127. Latin America packaging materials market size, by country, 2018 - 2032 (USD Billion)
- TABLE 128. Latin America packaging materials market size, by country, 2018 - 2032 (kilo Tons)
- TABLE 129. Latin America packaging materials market size, by material, 2018 - 2032 (USD Billion)
- TABLE 130. Latin America packaging materials market size, by material, 2018 - 2032 (kilo Tons)
- TABLE 131. Latin America packaging materials market size, by end-use, 2018 - 2032 (USD Billion)
- TABLE 132. Latin America packaging materials market size, by end-use, 2018 - 2032 (kilo Tons)
- TABLE 133. Latin America packaging materials market size, by product, 2018 - 2032 (USD Billion)
- TABLE 134. Latin America packaging materials market size, by product, 2018 - 2032 (kilo Tons)
- TABLE 135. Brazil packaging materials market size, by material, 2018 - 2032 (USD Billion)
- TABLE 136. Brazil packaging materials market size, by material, 2018 - 2032 (kilo Tons)
- TABLE 137. Brazil packaging materials market size, by end-use, 2018 - 2032 (USD Billion)
- TABLE 138. Brazil packaging materials market size, by end-use, 2018 - 2032 (kilo Tons)
- TABLE 139. Brazil packaging materials market size, by product, 2018 - 2032 (USD Billion)
- TABLE 140. Brazil packaging materials market size, by product, 2018 - 2032 (kilo Tons)
- TABLE 141. Mexico packaging materials market size, by material, 2018 - 2032 (USD Billion)
- TABLE 142. Mexico packaging materials market size, by material, 2018 - 2032 (kilo Tons)
- TABLE 143. Mexico packaging materials market size, by end-use, 2018 - 2032 (USD Billion)
- TABLE 144. Mexico packaging materials market size, by end-use, 2018 - 2032 (kilo Tons)
- TABLE 145. Mexico packaging materials market size, by product, 2018 - 2032 (USD Billion)
- TABLE 146. Mexico packaging materials market size, by product, 2018 - 2032 (kilo Tons)
- TABLE 147. Argentina packaging materials market size, by material, 2018 - 2032 (USD Billion)
- TABLE 148. Argentina packaging materials market size, by material, 2018 - 2032 (kilo Tons)
- TABLE 149. Argentina packaging materials market size, by end-use, 2018 - 2032 (USD Billion)
- TABLE 150. Argentina packaging materials market size, by end-use, 2018 - 2032 (kilo Tons)
- TABLE 151. Argentina packaging materials market size, by product, 2018 - 2032 (USD Billion)
- TABLE 152. Argentina packaging materials market size, by product, 2018 - 2032 (kilo Tons)
- TABLE 153. MEA packaging materials market size, by country, 2018 - 2032 (USD Billion)
- TABLE 154. MEA packaging materials market size, by country, 2018 - 2032 (kilo Tons)
- TABLE 155. MEA packaging materials market size, by material, 2018 - 2032 (USD Billion)
- TABLE 156. MEA packaging materials market size, by material, 2018 - 2032 (kilo Tons)
- TABLE 157. MEA packaging materials market size, by end-use, 2018 - 2032 (USD Billion)
- TABLE 158. MEA packaging materials market size, by end-use, 2018 - 2032 (kilo Tons)
- TABLE 159. MEA packaging materials market size, by product, 2018 - 2032 (USD Billion)
- TABLE 160. MEA packaging materials market size, by product, 2018 - 2032 (kilo Tons)
- TABLE 161. South Africa packaging materials market size, by material, 2018 - 2032 (USD Billion)
- TABLE 162. South Africa packaging materials market size, by material, 2018 - 2032 (kilo Tons)
- TABLE 163. South Africa packaging materials market size, by end-use, 2018 - 2032 (USD Billion)
- TABLE 164. South Africa packaging materials market size, by end-use, 2018 - 2032 (kilo Tons)
- TABLE 165. South Africa packaging materials market size, by product, 2018 - 2032 (USD Billion)
- TABLE 166. South Africa packaging materials market size, by product, 2018 - 2032 (kilo Tons)
- TABLE 167. UAE packaging materials market size, by material, 2018 - 2032 (USD Billion)
- TABLE 168. UAE packaging materials market size, by material, 2018 - 2032 (kilo Tons)
- TABLE 169. UAE packaging materials market size, by end-use, 2018 - 2032 (USD Billion)
- TABLE 170. UAE packaging materials market size, by end-use, 2018 - 2032 (kilo Tons)
- TABLE 171. UAE packaging materials market size, by product, 2018 - 2032 (USD Billion)
- TABLE 172. UAE packaging materials market size, by product, 2018 - 2032 (kilo Tons)
- TABLE 173. Saudi Arabia packaging materials market size, by material, 2018 - 2032 (USD Billion)
- TABLE 174. Saudi Arabia packaging materials market size, by material, 2018 - 2032 (kilo Tons)
- TABLE 175. Saudi Arabia packaging materials market size, by end-use, 2018 - 2032 (USD Billion)
- TABLE 176. Saudi Arabia packaging materials market size, by end-use, 2018 - 2032 (kilo Tons)
- TABLE 177. Saudi Arabia packaging materials market size, by product, 2018 - 2032 (USD Billion)
- TABLE 178. Saudi Arabia packaging materials market size, by product, 2018 - 2032 (kilo Tons)
Charts & Figures
- FIG. 1 Industry segmentation
- FIG. 2 Market estimation and forecast methodology
- FIG. 3 Breakdown of primary participants
- FIG. 4 Packaging materials industry 360 degree synopsis, 2018 - 2032
- FIG. 5 Industry landscape, 2018-2032 (USD Billion)
- FIG. 6 Growth potential analysis
- FIG. 7 Porter's analysis
- FIG. 8 PESTEL analysis
- FIG. 9 Company matrix analysis, 2023
- FIG. 10 Strategy dashboard, 2023
Packaging Materials Market is anticipated to register a CAGR of over 4.9% between 2024 and 2032, driven by the rise in e-commerce activities. According to Oberlo, there were around 2.64 billion digital buyers in 2023 and is expected to reach 2.71 billion in 2024 and 2.77 billion in 2025. As consumers increasingly turn to online platforms for their shopping needs, the packaging sector experiences heightened demand for materials that provide secure and sustainable solutions for the transportation and protection of goods.
Consumers are increasingly concerned about environmental impacts, leading to a surge in demand for materials that are recyclable, biodegradable, or made from renewable sources. This eco-consciousness influences the adoption of sustainable packaging materials, fostering the industry growth.
Packaging materials industry is divided based on material, product, end-use, and region.
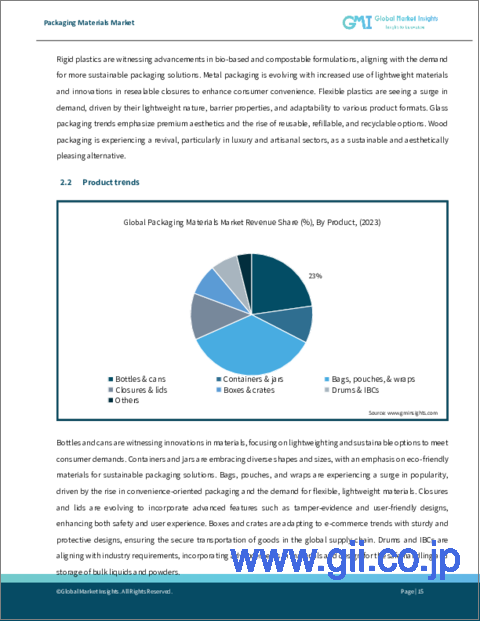
Boxes & crates segment will record a notable growth through 2032, owing to the growing logistics and transportation sector. The product provides essential protection to goods during transit, ensuring their integrity and minimizing the risk of damage. With the surge in e-commerce and the need for efficient packaging in supply chain operations, the boxes and crates become a preferred choice.
Cosmetics segment is slated to generate notable revenues during 2024-2032, favored by the dynamic interplay of aesthetics and sustainability. The cosmetics sector places a premium on visually appealing and innovative packaging to enhance product attractiveness and competitiveness. Unique shapes, materials, and designs create a distinct brand identity. Simultaneously, there's a growing emphasis on sustainable packaging solutions within the cosmetics industry, aligning with consumer preferences for eco-friendly and recyclable options.
Europe packaging materials industry size will record a notable growth through 2032, as the region's stringent regulatory framework emphasizes the importance of sustainable and recyclable packaging materials, fostering innovation. European consumers, increasingly environmentally conscious, drive demand for packaging solutions that align with circular economy principles. The rise of premiumization heightens focus on packaging aesthetics and functionality, encouraging the adoption of high-quality materials.
Table of Contents
Chapter 1 Methodology & Scope
- 1.1 Market scope & definition
- 1.2 Base estimates & calculations
- 1.3 Forecast calculation
- 1.4 Data mining sources
- 1.4.1 Primary
- 1.4.2 Secondary
- 1.4.2.1 Paid sources
- 1.4.2.2 Public sources
Chapter 2 Executive Summary
- 2.1 Packaging Materials market 360 degree synopsis, 2018 - 2032
- 2.2 Business trends
- 2.3 Regional trends
- 2.4 Material trends
- 2.5 Product trends
- 2.6 End-use trends
Chapter 3 Packaging Materials Industry Insights
- 3.1 Industry ecosystem analysis
- 3.2 Technological overview
- 3.3 Key news and initiatives
- 3.3.1 Partnership/Collaboration
- 3.3.2 Merger/Acquisition
- 3.3.3 Investment
- 3.3.4 Product launch & innovation
- 3.4 Regulatory landscape
- 3.5 Impact forces
- 3.5.1 Growth drivers
- 3.5.2 Industry pitfalls & challenges
- 3.6 Key supplier analysis
- 3.7 Growth potential analysis
- 3.8 Porter's analysis
- 3.9 PESTEL analysis
Chapter 4 Competitive Landscape, 2023
- 4.1 Introduction
- 4.2 Company market share, 2023
- 4.3 Competitive analysis of major market players, 2023
- 4.4 Competitive positioning matrix, 2023
- 4.5 Strategic outlook matrix, 2023
Chapter 5 Packaging Materials Market Estimates & Forecast, By Material, 2018-2032 (USD Billion) (Kilo Tons)
- 5.1 Paper & cardboard
- 5.2 Rigid plastics
- 5.3 Metal
- 5.4 Flexible plastics
- 5.5 Glass
- 5.6 Wood
- 5.7 Textiles
- 5.8 Others
Chapter 6 Packaging Materials Market Estimates & Forecast, By Product, 2018-2032 (USD Billion) (Kilo Tons)
- 6.1 Bottles & cans
- 6.2 Containers & jars
- 6.3 Bags, pouches, & wraps
- 6.4 Closures & lids
- 6.5 Boxes & crates
- 6.6 Drums & IBCs
- 6.7 Others
Chapter 7 Packaging Materials Market Estimates & Forecast, By End-Use, 2018-2032 (USD Billion)(Kilo Tons)
- 7.1 Food
- 7.2 Beverage
- 7.3 Healthcare
- 7.4 Cosmetics
- 7.5 Household products
- 7.6 Chemicals
- 7.7 Others
Chapter 8 Packaging Materials Market Estimates & Forecast, By Region, 2018-2032 (USD Billion)(Kilo Tons)
- 8.1 Key trends, by region
- 8.2 North America
- 8.2.1 U.S.
- 8.2.2 Canada
- 8.3 Europe
- 8.3.1 UK
- 8.3.2 Germany
- 8.3.3 France
- 8.3.4 Italy
- 8.3.5 Spain
- 8.3.6 Russia
- 8.4 Asia Pacific
- 8.4.1 China
- 8.4.2 India
- 8.4.3 Japan
- 8.4.4 South Korea
- 8.4.5 Australia
- 8.4.6 Malaysia
- 8.4.7 Indonesia
- 8.5 Latin America
- 8.5.1 Brazil
- 8.5.2 Mexico
- 8.5.3 Argentina
- 8.6 MEA
- 8.6.1 SAUDI ARABIA
- 8.6.2 UAE
- 8.6.3 South Africa
Chapter 9 Company Profiles
- 9.1 Amcor
- 9.2 Ball Corporation
- 9.3 Crown Holding
- 9.4 International Paper Company
- 9.5 Mondi
- 9.6 Owens-Illinois
- 9.7 Reynolds Group
- 9.8 Sealed Air
- 9.9 Stora Enso
- 9.10 Berry Plastics