
|
市場調査レポート
商品コード
1721619
旅客フェリーの市場機会と促進要因、産業動向分析、2025年~2034年予測Passenger Ferries Market Opportunity, Growth Drivers, Industry Trend Analysis, and Forecast 2025 - 2034 |
||||||
カスタマイズ可能
|
|||||||
| 旅客フェリーの市場機会と促進要因、産業動向分析、2025年~2034年予測 |
|
出版日: 2025年04月10日
発行: Global Market Insights Inc.
ページ情報: 英文 150 Pages
納期: 2~3営業日
|

全表示
- 概要
- 目次
世界の旅客フェリー市場は、2024年に153億米ドルと評価され、CAGR 6.2%で成長し、2034年には272億米ドルに達すると推定されています。
この増加傾向は、人口が密集し、地理的に分散している地域において、効率的で柔軟な輸送オプションに対する需要が増加していることに起因しています。旅客フェリーは、強固な陸上輸送インフラを持たないことの多い島嶼地域、沿岸都市、孤立した地域間のシームレスな接続性を提供します。人の移動と貨物の移動の両方を促進するその能力は、官民両部門からの投資の増加を促しています。政府およびフェリー運航会社は、観光、地域の連結性、持続可能な輸送ソリューションを支援するプロジェクトを優先しています。特に電気フェリーやハイブリッド・フェリーのモデルによるグリーン・モビリティの推進は、海運セクター全体に長期的成長の新たな機会をもたらしています。
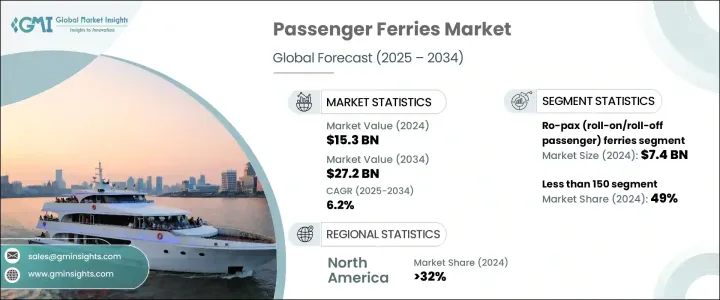
フェリーのタイプ別主要セグメントでは、Ro-Pax(ロールオン/ロールオフ旅客)フェリーが2024年の市場規模74億米ドルで市場を独占しました。これらの船舶は旅客と車両を同時に移動させることができるため、道路へのアクセスが限られた航路に最適です。一回の航行で旅行者と鉄道貨物の両方を扱うことができるため、観光と貿易を支えることができます。運航会社は、交通量の多い海上回廊のカバー率を高めるため、着実に船隊を拡大し、港湾をアップグレードしています。観光地での自家用車輸送をサポートする旅行方法への嗜好の高まりが、採用をさらに後押ししています。Ro-Paxフェリーは快適さと実用性を兼ね備えているため、週末旅行者や物流事業者にも好まれています。低燃費エンジン、ハイブリッド推進システム、空気力学に基づいた船体など、これらの船舶を近代化する取り組みが、環境規制に沿いながら運航コストを引き下げています。このシフトはまた、環境意識の高い消費者や商業顧客を引き付けており、グリーン・ファイナンスは世界中の船隊近代化の取り組みにおいて極めて重要な役割を果たしています。
| 市場範囲 | |
|---|---|
| 開始年 | 2024 |
| 予測年 | 2025-2034 |
| 開始金額 | 153億米ドル |
| 予測金額 | 272億米ドル |
| CAGR | 6.2% |
定員別では、150人未満のフェリーが2024年の市場シェアの49%を占める。これらのコンパクトな船は、大型フェリーが効率的に運航できない都市の水辺や狭い内陸水路に就航しています。サイズが小さいため、短時間での折り返し運航に適しており、都市部の通勤客や地元の観光客に魅力的です。都市部が道路の混雑を緩和するために水上輸送を模索する中、小容量のフェリーは費用対効果が高く、燃料効率の高い代替手段として採用されています。こうしたフェリーの需要は、電気推進システム、軽量建材、自動化された船内技術などの技術革新によってさらに支えられています。このため、維持費を低く抑え、排出ガスを削減しながら、頻繁に短距離を運航することが可能になっています。
技術面では、信頼性と確立されたインフラが主な理由で、ディーゼル式フェリーが2024年も優勢を維持しました。ディーゼル・フェリーは、長距離航路や高負荷航路、特に先進的なエネルギー代替手段がまだ登場していない地域で、依然として好ましい選択肢です。ディーゼル・フェリーは、航続距離が長く、燃料補給の必要性が少ないなどの運航上の利点があり、厳しい海洋環境での長距離航行に理想的です。よりクリーンな技術へのシフトにもかかわらず、多くの事業者は、その耐久性、容易なメンテナンス、費用対効果を理由にディーゼル船に依存し続けています。
北米は2024年に32%以上の最大地域シェアを占め、米国がフェリーインフラとよりクリーンな海上輸送システムへの戦略的投資を通じて地域拡大を主導しています。
旅客フェリー市場の主要企業(BC Ferries、Stena Line、Brittany Ferriesなど)は、グリーン技術と船隊の電化を通じて成長を推進しています。これらの企業は、進化する環境規制に対応するため、ハイブリッド推進システムや代替燃料に投資しています。顧客体験と運航効率を高めるため、運航会社は航路網を拡大し、船内設備をアップグレードし、デジタルチケットやリアルタイムの追跡技術を採用しています。港湾当局との協力や政府資金へのアクセスは、運航規模を拡大しサービス品質を維持する努力をさらに後押ししています。競合が多く、断片化されたこの業界では、イノベーションと持続可能性が、長期的な成功と地域拡大のための重要な戦略であり続けています。
目次
第1章 調査手法と範囲
第2章 エグゼクティブサマリー
第3章 業界考察
- エコシステム分析
- サプライヤーの情勢
- 製造業者
- サービスプロバイダー
- テクノロジープロバイダー
- 最終用途
- トランプ政権による関税への影響
- 貿易への影響
- 貿易量の混乱
- 報復措置
- 業界への影響
- 主要原材料の価格変動
- サプライチェーンの再構築
- 最終市場への価格伝達
- 主要原材料の価格変動
- 戦略的な業界対応
- サプライチェーンの再構成
- 価格設定と製品戦略
- 貿易への影響
- 利益率分析
- コスト内訳分析
- テクノロジーとイノベーションの情勢
- 主なニュースと取り組み
- 規制情勢
- 影響要因
- 促進要因
- 水上交通ソリューションの都市統合
- 海上観光とレジャー旅行の拡大
- 持続可能な海上輸送に対する政府の支援
- フェリーの設計と効率における技術的進歩
- 業界の潜在的リスク&課題
- 高い運用コストと燃料依存
- 季節的な需要変動とルートの実現可能性の問題
- 促進要因
- 成長可能性分析
- ポーターの分析
- PESTEL分析
第4章 競合情勢
- イントロダクション
- 企業の市場シェア分析
- 競合ポジショニングマトリックス
- 戦略的展望マトリックス
第5章 市場推計・予測:フェリーで、2021-2034
- 主要動向
- Ro-pax(ロールオン/ロールオフ旅客)フェリー
- 高速フェリー
- クルーズフェリー
第6章 市場推計・予測:容量別、2021-2034
- 主要動向
- 150未満
- 150~400
- 400以上
第7章 市場推計・予測:車両別、2021-2034
- 主要動向
- 従来のディーゼルフェリー
- 電気とハイブリッドのフェリー
- LNG燃料フェリー
第8章 市場推計・予測:地域別、2021-2034
- 主要動向
- 北米
- 米国
- カナダ
- 欧州
- 英国
- ドイツ
- フランス
- スペイン
- イタリア
- ロシア
- 北欧諸国
- アジア太平洋地域
- 中国
- インド
- 日本
- 韓国
- オーストラリア
- 東南アジア
- ラテンアメリカ
- ブラジル
- アルゼンチン
- メキシコ
- 中東・アフリカ
- アラブ首長国連邦
- 南アフリカ
- サウジアラビア
第9章 企業プロファイル
- Austal
- BC Ferries
- Blue Star Ferries
- Brittany Ferries
- Corsica Ferries
- Damen Shipyards Group
- DFDS Seaways
- Fjord1 ASA
- Grimaldi Lines
- Hornblower Cruises &Events
- Incat
- Irish Ferries
- Jadrolinija
- Meyer Werft
- Minoan Lines
- NY Waterway
- P&O Ferries
- Stena Line
- Tallink Grupp
- Washington State Ferries
The Global Passenger Ferries Market was valued at USD 15.3 billion in 2024 and is estimated to grow at a CAGR of 6.2% to reach USD 27.2 billion by 2034. This upward trend stems from the increasing demand for efficient and flexible transport options in densely populated and geographically scattered regions. Passenger ferries offer seamless connectivity between island territories, coastal cities, and isolated communities that often lack robust land transport infrastructure. Their ability to facilitate both human and cargo movement has encouraged rising investments from both public and private sectors. Governments and ferry operators are prioritizing projects that support tourism, regional connectivity, and sustainable transport solutions. The push toward green mobility, especially through electric and hybrid ferry models, is unlocking new opportunities for long-term growth across the maritime transport sector.
Among the key segments by ferry type, Ro-Pax (roll-on/roll-off passenger) ferries dominated the market with a value of USD 7.4 billion in 2024. These vessels allow passengers and vehicles to travel simultaneously, making them ideal for routes with limited road access. The capability to handle both travelers and rolling cargo in a single trip supports tourism and trade. Operators are steadily expanding their fleets and upgrading ports to boost coverage across high-traffic maritime corridors. The growing preference for travel methods that support personal vehicle transport at tourist spots is further driving adoption. Ro-Pax ferries combine comfort with utility, making them a favored choice for weekend travelers and logistics operators alike. Efforts to modernize these vessels with fuel-efficient engines, hybrid propulsion systems, and aerodynamic hulls are driving down operational costs while aligning with environmental regulations. This shift is also attracting eco-conscious consumers and commercial clients, with green financing playing a pivotal role in fleet modernization initiatives worldwide.
| Market Scope | |
|---|---|
| Start Year | 2024 |
| Forecast Year | 2025-2034 |
| Start Value | $15.3 Billion |
| Forecast Value | $27.2 Billion |
| CAGR | 6.2% |
By capacity, ferries accommodating fewer than 150 passengers accounted for 49% of the market share in 2024. These compact vessels serve urban waterfronts and narrow inland waterways where larger ferries cannot operate efficiently. Their smaller size makes them suitable for quick turnaround operations, appealing to city commuters and local tourists. As urban areas explore water-based transport to reduce road congestion, small-capacity ferries are being adopted as cost-effective, fuel-efficient alternatives. The demand for these ferries is further supported by innovations such as electric propulsion systems, lightweight construction materials, and automated onboard technology. This makes them viable for frequent short-distance operations while keeping maintenance costs low and reducing emissions.
In terms of technology, diesel-powered ferries continued to dominate in 2024, largely due to their reliability and established infrastructure. They remain a preferred option across long-distance and high-load routes, especially in regions where advanced energy alternatives are still emerging. Diesel ferries offer operational advantages such as longer range and minimal refueling needs, making them ideal for extended trips in challenging marine environments. Despite the shift toward cleaner technologies, many operators continue to rely on diesel vessels for their durability, easy maintenance, and cost-effectiveness.
North America held the largest regional market share at over 32% in 2024, with the United States leading the regional expansion through strategic investments in ferry infrastructure and cleaner maritime transport systems.
Leading companies in the passenger ferries market-such as BC Ferries, Stena Line, and Brittany Ferries-are driving growth through green technology and fleet electrification. These players are investing in hybrid propulsion systems and alternative fuels to meet evolving environmental regulations. To enhance customer experience and operational efficiency, operators are expanding route networks, upgrading onboard amenities, and adopting digital ticketing and real-time tracking technologies. Collaborations with port authorities and access to government funding further support their efforts to scale operations and maintain service quality. In this competitive and fragmented industry, innovation and sustainability remain key strategies for long-term success and regional expansion.
Table of Contents
Chapter 1 Methodology & Scope
- 1.1 Research design
- 1.1.1 Research approach
- 1.1.2 Data collection methods
- 1.2 Base estimates and calculations
- 1.2.1 Base year calculation
- 1.2.2 Key trends for market estimates
- 1.3 Forecast model
- 1.4 Primary research & validation
- 1.4.1 Primary sources
- 1.4.2 Data mining sources
- 1.5 Market definitions
Chapter 2 Executive Summary
- 2.1 Industry 3600 synopsis, 2021 - 2034
Chapter 3 Industry Insights
- 3.1 Industry ecosystem analysis
- 3.2 Supplier landscape
- 3.2.1 Manufacturers
- 3.2.2 Service provider
- 3.2.3 Technology provider
- 3.2.4 End use
- 3.3 Impact of trump administration tariffs
- 3.3.1 Impact on trade
- 3.3.1.1 Trade volume disruptions
- 3.3.1.2 Retaliatory measures
- 3.3.2 Impact on the Industry
- 3.3.2.1 Price volatility in key materials
- 3.3.2.1.1 Supply chain restructuring
- 3.3.2.1.2 Price transmission to end markets
- 3.3.2.1 Price volatility in key materials
- 3.3.3 Strategic industry responses
- 3.3.3.1 Supply chain reconfiguration
- 3.3.3.2 Pricing and product strategies
- 3.3.1 Impact on trade
- 3.4 Profit margin analysis
- 3.5 Cost breakdown analysis
- 3.6 Technology & innovation landscape
- 3.7 Key news & initiatives
- 3.8 Regulatory landscape
- 3.9 Impact forces
- 3.9.1 Growth drivers
- 3.9.1.1 Urban integration of water-based transit solutions
- 3.9.1.2 Expansion of maritime tourism and leisure travel
- 3.9.1.3 Government support for sustainable marine transport
- 3.9.1.4 Technological advancements in ferry design and efficiency
- 3.9.2 Industry pitfalls & challenges
- 3.9.2.1 High operating costs and fuel dependency
- 3.9.2.2 Seasonal demand fluctuations and route viability issues
- 3.9.1 Growth drivers
- 3.10 Growth potential analysis
- 3.11 Porter’s analysis
- 3.12 PESTEL analysis
Chapter 4 Competitive Landscape, 2024
- 4.1 Introduction
- 4.2 Company market share analysis
- 4.3 Competitive positioning matrix
- 4.4 Strategic outlook matrix
Chapter 5 Market Estimates & Forecast, By Ferry, 2021 - 2034 ($Mn & Fleet Size)
- 5.1 Key trends
- 5.2 Ro-pax (roll-on/roll-off passenger) ferries
- 5.3 High-speed ferries
- 5.4 Cruise ferries
Chapter 6 Market Estimates & Forecast, By Capacity, 2021 - 2034 ($Mn & Fleet Size)
- 6.1 Key trends
- 6.2 Less than 150
- 6.3 150 - 400
- 6.4 More than 400
Chapter 7 Market Estimates & Forecast, By Vehicle, 2021 - 2034 ($Mn & Fleet Size)
- 7.1 Key trends
- 7.2 Conventional diesel-powered ferries
- 7.3 Electric & hybrid ferries
- 7.4 LNG powered ferries
Chapter 8 Market Estimates & Forecast, By Region, 2021 - 2034 ($Mn & Fleet Size)
- 8.1 Key trends
- 8.2 North America
- 8.2.1 U.S.
- 8.2.2 Canada
- 8.3 Europe
- 8.3.1 UK
- 8.3.2 Germany
- 8.3.3 France
- 8.3.4 Spain
- 8.3.5 Italy
- 8.3.6 Russia
- 8.3.7 Nordics
- 8.4 Asia Pacific
- 8.4.1 China
- 8.4.2 India
- 8.4.3 Japan
- 8.4.4 South Korea
- 8.4.5 Australia
- 8.4.6 Southeast Asia
- 8.5 Latin America
- 8.5.1 Brazil
- 8.5.2 Argentina
- 8.5.3 Mexico
- 8.6 MEA
- 8.6.1 UAE
- 8.6.2 South Africa
- 8.6.3 Saudi Arabia
Chapter 9 Company Profiles
- 9.1 Austal
- 9.2 BC Ferries
- 9.3 Blue Star Ferries
- 9.4 Brittany Ferries
- 9.5 Corsica Ferries
- 9.6 Damen Shipyards Group
- 9.7 DFDS Seaways
- 9.8 Fjord1 ASA
- 9.9 Grimaldi Lines
- 9.10 Hornblower Cruises & Events
- 9.11 Incat
- 9.12 Irish Ferries
- 9.13 Jadrolinija
- 9.14 Meyer Werft
- 9.15 Minoan Lines
- 9.16 NY Waterway
- 9.17 P&O Ferries
- 9.18 Stena Line
- 9.19 Tallink Grupp
- 9.20 Washington State Ferries

