
|
市場調査レポート
商品コード
1666640
乳製品原料市場の機会、成長促進要因、産業動向分析、2025~2034年の予測Dairy Ingredients Market Opportunity, Growth Drivers, Industry Trend Analysis, and Forecast 2025 - 2034 |
||||||
カスタマイズ可能
|
|||||||
| 乳製品原料市場の機会、成長促進要因、産業動向分析、2025~2034年の予測 |
|
出版日: 2024年12月18日
発行: Global Market Insights Inc.
ページ情報: 英文 310 Pages
納期: 2~3営業日
|

全表示
- 概要
- 目次
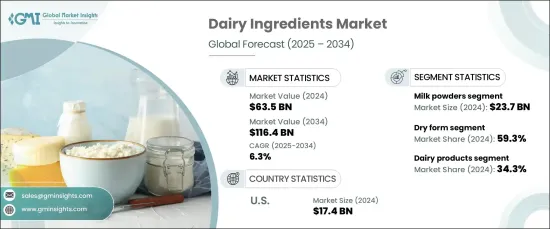
世界の乳製品原料市場は、2024年に635億米ドルとなり、2025年から2034年までのCAGRは6.3%と予測され、大きな成長が見込まれています。
この市場には、粉乳、乳清タンパク質、乳糖、カゼイン、その他の誘導体など、乳由来の製品が幅広く含まれています。この市場拡大の主な要因は、乳製品原料がもたらす栄養面での利点に対する認識が高まっていることです。消費者は、健康的な食生活を維持するために乳製品が果たす役割についてより強く意識するようになっており、飲食品セクター全体における採用率の上昇に寄与しています。乳製品原料はその汎用性の高さから、加工食品や飲食品から菓子類や飲料に至るまで、あらゆるもの定番となっています。その人気は、透明性と健康志向の選択を優先する食生活の嗜好の変化に合わせて、クリーンラベル製品や栄養強化食品への需要が高まっていることでさらに加速しています。
市場は、高タンパク食や機能性栄養食品への嗜好の高まりなど、消費者主導のいくつかの動向から恩恵を受けています。消化の改善、体重管理、運動能力の向上など、さらなる健康上のメリットをもたらす製品を求める人が増えています。その結果、乳製品原料、特にホエイタンパクやカゼインに対する需要は、スポーツ栄養や機能性食品のような業界で着実に増加しています。さらに、自然で加工を最小限に抑えた食品への関心の高まりが、健康志向の層に対応するクリーンラベルの乳製品原料ソリューションを革新し提供するようメーカーを後押ししています。
| 市場範囲 | |
|---|---|
| 開始年 | 2024 |
| 予測年 | 2025-2034 |
| 開始金額 | 635億米ドル |
| 予測金額 | 1,164億米ドル |
| CAGR | 6.3% |
製品タイプ別では、カゼインおよびカゼイネート、乳清成分、乳糖および誘導体、粉乳、その他関連製品が含まれます。2024年には、粉乳が市場を独占し、大きなシェアを占めています。保存期間が長く、輸送が容易で、様々な食品に組み込むことができるため、メーカーにとって不可欠な原料となっています。食品生産が世界的に拡大し続ける中、粉ミルクはその費用対効果と長期保存能力により、依然として最重要の選択肢となっています。
市場はまた、形態によって乾燥タイプと液体タイプに区分され、2024年の市場シェアは乾燥タイプが59.3%を占めています。粉乳、ホエイ、カゼインなどの乾燥乳製品原料は、その利便性、安定性、保存期間の長さから好まれています。こうした特徴から、乾燥乳製品原料はベーカリー製品、飲料ミックス、菓子類への使用に特に適しています。加工食品の消費の増加と、手軽で簡単なミールソリューションの需要の増加が、乾燥乳製品原料の需要をさらに押し上げています。
米国では、高タンパク機能性食品と栄養補助食品の旺盛な需要に牽引され、乳製品原料市場は2024年に174億米ドルを創出しました。市場の成長を支えているのは、スポーツ栄養、乳児用調製粉乳、クリーンラベル製品への注目が高まっていることです。乳製品加工技術の進歩により、メーカーは多様な消費者ニーズに応えるためによりカスタマイズされたソリューションを製造できるようになり、技術革新と製品品質の向上が促進されています。
目次
第1章 調査手法と調査範囲
- 市場範囲と定義
- 基本推定と計算
- 予測計算
- データソース
- 1次データ
- 2次データ
- 有料情報源
- 公的情報源
第2章 エグゼクティブサマリー
第3章 業界洞察
- エコシステム分析
- バリューチェーンに影響を与える要因
- 利益率分析
- 破壊
- 将来の展望
- メーカー
- 流通業者
- サプライヤーの状況
- 利益率分析
- 主要ニュース
- 規制状況
- 影響要因
- 促進要因
- 飲食品産業の拡大
- 機能性食品に対する消費者の需要の増加
- 業界の潜在的リスク&課題
- 植物由来の代替食品との競合
- 促進要因
- 成長可能性分析
- ポーターの分析
- PESTEL分析
第4章 競合情勢
- イントロダクション
- 企業シェア分析
- 競合のポジショニング・マトリックス
- 戦略展望マトリックス
第5章 市場規模・予測:形態別、2021~2034年
- 主要動向
- ドライ
- 液体
第6章 市場規模・予測:製品タイプ別、2021~2034年
- 主要動向
- 粉乳
- ホエイ成分
- 乳糖とその誘導体
- カゼインおよびカゼイン酸塩
- その他
第7章 市場規模・予測:用途別、2021~2034年
- 主要動向
- ベーカリー・菓子類
- 乳製品
- 乳児用調製粉乳
- スポーツ・臨床栄養
- その他
第8章 市場規模・予測:地域別、2021~2034年
- 主要動向
- 北米
- 米国
- カナダ
- 欧州
- 英国
- ドイツ
- フランス
- イタリア
- スペイン
- ロシア
- アジア太平洋
- 中国
- インド
- 日本
- 韓国
- オーストラリア
- ラテンアメリカ
- ブラジル
- メキシコ
- 中東・アフリカ
- 南アフリカ
- サウジアラビア
- アラブ首長国連邦
第9章 企業プロファイル
- Amco Proteins
- Arla Foods
- Dairy Farmers of America
- EPI Ingredients
- Fonterra
- FrieslandCampina
- Glanbia
- Ingredia
- Kerry Group
- Lactalis Group
- Saputo
- Sodiaal co-operative group
- Volac International
The Global Dairy Ingredients Market, valued at USD 63.5 billion in 2024, is poised for significant growth with a projected CAGR of 6.3% from 2025 to 2034. The market includes a broad array of milk-derived products such as milk powders, whey proteins, lactose, casein, and other derivatives. A key driver of this expansion is the increasing awareness of the nutritional benefits offered by dairy ingredients. Consumers are becoming more conscious of the role these ingredients play in maintaining a healthy diet, contributing to the rising adoption across the food and beverage sector. Dairy ingredients are celebrated for their versatility, making them a staple in everything from processed foods and bakery items to confectioneries and beverages. Their popularity is further fueled by the growing demand for clean-label products and fortified nutrition, which align with shifting dietary preferences that prioritize transparency and health-conscious choices.
The market is benefiting from several consumer-driven trends, including the rising preference for high-protein diets and functional nutrition. People are increasingly seeking products that provide additional health benefits, such as improved digestion, weight management, and enhanced athletic performance. As a result, the demand for dairy ingredients, particularly whey proteins and casein, is seeing a steady rise in industries like sports nutrition and functional food products. Moreover, the growing interest in natural, minimally processed foods has pushed manufacturers to innovate and offer clean-label dairy ingredient solutions that cater to a health-focused demographic.
| Market Scope | |
|---|---|
| Start Year | 2024 |
| Forecast Year | 2025-2034 |
| Start Value | $63.5 Billion |
| Forecast Value | $116.4 Billion |
| CAGR | 6.3% |
Segmented by product type, the market includes casein and caseinates, whey ingredients, lactose and derivatives, milk powders, and other related products. In 2024, milk powders dominated the market, capturing a significant share. Their long shelf life, ease of transport, and ability to be incorporated into various food products have made them an essential ingredient for manufacturers. As food production continues to expand globally, milk powders remain a top choice due to their cost-effectiveness and extended storage capabilities.
The market is also segmented by form into dry and liquid variants, with the dry segment accounting for 59.3% of the market share in 2024. Dry dairy ingredients, including powdered milk, whey, and casein, are preferred for their convenience, stability, and extended shelf life. These characteristics make dry dairy ingredients particularly well-suited for use in bakery goods, beverage mixes, and confectionery products. The growing consumption of processed foods, along with the increasing demand for quick and easy meal solutions, is further propelling the demand for dry dairy ingredients.
In the United States, the dairy ingredients market generated USD 17.4 billion in 2024, driven by strong demand for high-protein functional foods and nutritional supplements. The market's growth is supported by the increasing emphasis on sports nutrition, infant formula, and clean-label products. With advances in dairy processing technologies, manufacturers are now able to produce more customized solutions to cater to diverse consumer needs, driving innovation and enhancing product quality.
Table of Contents
Chapter 1 Methodology & Scope
- 1.1 Market scope & definition
- 1.2 Base estimates & calculations
- 1.3 Forecast calculation
- 1.4 Data sources
- 1.4.1 Primary
- 1.4.2 Secondary
- 1.4.2.1 Paid sources
- 1.4.2.2 Public sources
Chapter 2 Executive Summary
- 2.1 Industry synopsis, 2021-2034
Chapter 3 Industry Insights
- 3.1 Industry ecosystem analysis
- 3.1.1 Factor affecting the value chain
- 3.1.2 Profit margin analysis
- 3.1.3 Disruptions
- 3.1.4 Future outlook
- 3.1.5 Manufacturers
- 3.1.6 Distributors
- 3.2 Supplier landscape
- 3.3 Profit margin analysis
- 3.4 Key news & initiatives
- 3.5 Regulatory landscape
- 3.6 Impact forces
- 3.6.1 Growth drivers
- 3.6.1.1 Expansion of the food and beverage industry
- 3.6.1.2 Increasing consumer demand for functional foods
- 3.6.2 Industry pitfalls & challenges
- 3.6.2.1 Competition from plant-based alternatives
- 3.6.1 Growth drivers
- 3.7 Growth potential analysis
- 3.8 Porter’s analysis
- 3.9 PESTEL analysis
Chapter 4 Competitive Landscape, 2024
- 4.1 Introduction
- 4.2 Company market share analysis
- 4.3 Competitive positioning matrix
- 4.4 Strategic outlook matrix
Chapter 5 Market Size and Forecast, By Form, 2021-2034 (USD Billion, Kilo Tons)
- 5.1 Key trends
- 5.2 Dry
- 5.3 Liquid
Chapter 6 Market Size and Forecast, By Product Type, 2021-2034 (USD Billion, Kilo Tons)
- 6.1 Key trends
- 6.2 Milk powders
- 6.3 Whey ingredients
- 6.4 Lactose and derivatives
- 6.5 Casein and caseinates
- 6.6 Other
Chapter 7 Market Size and Forecast, By Application, 2021-2034 (USD Billion, Kilo Tons)
- 7.1 Key trends
- 7.2 Bakery and confectionery
- 7.3 Dairy products
- 7.4 Infant milk formula
- 7.5 Sports and clinical nutrition
- 7.6 Other
Chapter 8 Market Size and Forecast, By Region, 2021-2034 (USD Billion, Kilo Tons)
- 8.1 Key trends
- 8.2 North America
- 8.2.1 U.S.
- 8.2.2 Canada
- 8.3 Europe
- 8.3.1 UK
- 8.3.2 Germany
- 8.3.3 France
- 8.3.4 Italy
- 8.3.5 Spain
- 8.3.6 Russia
- 8.4 Asia Pacific
- 8.4.1 China
- 8.4.2 India
- 8.4.3 Japan
- 8.4.4 South Korea
- 8.4.5 Australia
- 8.5 Latin America
- 8.5.1 Brazil
- 8.5.2 Mexico
- 8.6 MEA
- 8.6.1 South Africa
- 8.6.2 Saudi Arabia
- 8.6.3 UAE
Chapter 9 Company Profiles
- 9.1 Amco Proteins
- 9.2 Arla Foods
- 9.3 Dairy Farmers of America
- 9.4 EPI Ingredients
- 9.5 Fonterra
- 9.6 FrieslandCampina
- 9.7 Glanbia
- 9.8 Ingredia
- 9.9 Kerry Group
- 9.10 Lactalis Group
- 9.11 Saputo
- 9.12 Sodiaal co-operative group
- 9.13 Volac International

