
|
市場調査レポート
商品コード
1801890
クーラーボックスの市場機会、成長促進要因、産業動向分析と2025年~2034年予測Cooler Box Market Opportunity, Growth Drivers, Industry Trend Analysis, and Forecast 2025 - 2034 |
||||||
カスタマイズ可能
|
|||||||
| クーラーボックスの市場機会、成長促進要因、産業動向分析と2025年~2034年予測 |
|
出版日: 2025年08月13日
発行: Global Market Insights Inc.
ページ情報: 英文 130 Pages
納期: 2~3営業日
|

全表示
- 概要
- 目次
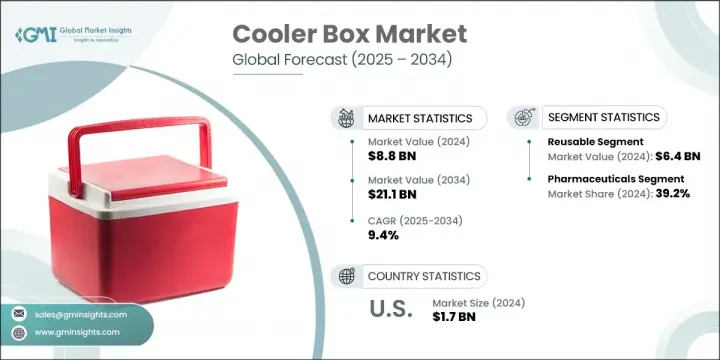
世界のクーラーボックス市場は、2024年には88億米ドルとなり、CAGR 9.4%で成長し、2034年には211億米ドルに達すると推定されています。
市場の勢いは、温度に敏感な商品に対する需要の高まりと、サステイナブル低温貯蔵ソリューションへの幅広いシフトの組み合わせによって牽引されています。低ワット数のユニットから1.5MWを超えるシステムまで、多様な冷却容量があることは、クーラーボックスが住宅、商業、工業の各セグメントに適応できることを示しています。環境責任への関心の高まりは、使い捨て容器に代わるコスト効率と耐久性に優れた再利用型クーラーボックスへの購買意欲を高めています。環境意識の高まりが購買行動に影響を与える中、再利用型クーラーボックスは消費者と企業の双方にとって廃棄物削減戦略に不可欠なものとなりつつあります。企業や産業が世界の持続可能性の目標に歩調を合わせる中、長持ちし、エコフレンドリー保冷剤市場は、今後数年間で着実に前進するものと考えられます。
温度管理された物流への依存は、製品の品質を守り、公衆衛生を確保するために不可欠となっています。コールドチェーンソリューションの不足は、重要なセグメントに影響を与え続けており、特にヘルスケアでは、予防可能な幼児の死亡の数百万人がワクチンの保管や輸送の失敗に関連しています。信頼性が高くエネルギー効率に優れた冷却システムの必要性が拡大する中、クーラーボックスは、超低温保存条件を含む可変温度範囲にわたって信頼性の高い性能を発揮する上で不可欠なものとなっています。このようなコールドチェーンロジスティクスの要件は、世界の市場の拡大を維持すると予想されます。
| 市場範囲 | |
|---|---|
| 開始年 | 2024年 |
| 予測年 | 2025~2034年 |
| 開始金額 | 88億米ドル |
| 予測金額 | 211億米ドル |
| CAGR | 9.4% |
再利用型クーラーボックスセグメントは、2024年に64億米ドルに達し市場をリードし、2025~2034年にかけてCAGR 9.8%で成長すると予測されています。使い捨て包装からの脱却が進み、長寿命設計の再利用可能モデルへの関心が高まっています。弾力性のある材料で作られたこれらのクーラーボックスは、断熱性能や構造的耐久性を損なうことなく繰り返し使用できるように設計されています。この進化は、現代のサプライチェーンのコスト効率ニーズを満たしながら、世界の持続可能性目標をサポートしています。
医薬品セグメントは2024年に34億米ドルを生み出し、39.2%のシェアを占めています。医薬品産業では、コールドチェーンの完全性が最優先事項であり続けており、厳格なコンプライアンス基準により、輸送と保管に安定した温度環境が求められています。温度制御ソリューションに対するニーズは、ワクチンの流通や温度に敏感な医薬品の規制保管に対する世界の需要によって高まっています。厳密な製薬基準を満たすように製造されたクーラーボックスは、一貫した製品の有効性と規制順守をサポートするため、強力な採用が見られます。
米国のクーラーボックス2024年の市場規模は17億米ドルで、2025~2034年にかけてCAGR 10.3%で成長すると推定されています。米国の市場成長の原動力は、冷蔵インフラに依存する産業の裾野の拡大です。食事宅配サービスから医薬品物流、食料品流通に至るまで、インフラ整備とともに需要が増加しています。また、住宅や商業地区における電力使用量の急増も、高効率冷却技術の採用を後押ししています。これらの要因から、コールドチェーンへの投資が持続的に増加し、全国的なクーラーボックス展開に有利な条件が整いつつあります。
クーラーボックスの世界市場で活動している注目すべき企業には、Cold Chain Technologies Inc.、va-Q-tec Thermal Solutions GmbH、WILD Coolers、FEURER Group GmbH、Pelican Products Inc.、Igloo Products Corp.、YETI COOLERS, LLC.、K2Coolers、Sofrigam Group、Sonoco ThermoSafe、Cool Ice Box Company、Bison Coolers、Eurobox Logistics、Blowkings、B Medical Systemなどがあります。クーラーボックス産業で事業展開する企業は、長期的な競合を構築するため、材料の革新、モジュール型製品設計、技術統合に投資しています。多くの企業は、環境問題の高まりに対応するため、再利用可能で耐久性があり、熱効率の高いクーラーボックスの生産に注力しています。ヘルスケアや食品ロジスティクスを含む多様な産業向けのカスタマイズオプションは、市場へのリーチを拡大するために拡充されています。ロジスティクスプロバイダやコールドチェーンインフラ開発企業との戦略的パートナーシップも、サプライチェーンの連結性を強化しています。大手メーカーは、スマート温度モニタリングシステムと互換性のある軽量で高性能なユニットを設計するための研究開発努力を積極的に強化しています。いくつかの企業は、地域的な製造ハブを設立することで地理的プレゼンスを高め、輸送コストを削減し、先進国市場と新興国市場の両方で地域による需要により効率的に対応できるようにしています。
目次
第1章 調査手法と範囲
第2章 エグゼクティブサマリー
第3章 産業考察
- エコシステム分析
- サプライヤーの情勢
- 利益率
- 各段階での付加価値
- バリューチェーンに影響を与える要因
- ディスラプション
- 産業への影響要因
- 促進要因
- 産業の潜在的リスク・課題
- 機会
- 成長可能性分析
- 将来の市場動向
- 技術とイノベーションの情勢
- 現在の技術動向
- 新興技術
- 価格動向
- 地域別タイプ別
- 規制の枠組み
- 規格と認証
- 環境規制
- 輸出入規制
- ポーターの分析
- PESTEL分析
- 消費者行動分析
- 購入パターン
- 嗜好分析
- 消費者行動の地域差
- eコマースが購買決定に与える影響
第4章 競合情勢
- イントロダクション
- 企業の市場シェア分析
- 地域別
- 企業マトリックス分析
- 主要市場企業の競合分析
- 競合ポジショニングマトリックス
- 合併と買収
- パートナーシップとコラボレーション
- 新製品の発売
- 拡大計画
第5章 市場推定・予測:タイプ別、2021~2034年
- 主要動向
- 再利用型
- 使い捨て
第6章 市場推定・予測:原料別、2021~2034年
- 主要動向
- 押出ポリスチレン
- 発泡スチロール
- 発泡ポリプロピレン
第7章 市場推定・予測:価格帯別、2021~2034年
- 主要動向
- 低価格(最大30米ドル)
- 中価格(30~50米ドル)
- 高価格(50米ドル以上)
第8章 市場推定・予測:最終用途別、2021~2034年
- 主要動向
- 医薬品
- 飲食品
- その他
第9章 市場推定・予測:流通チャネル別、2021~2034年
- 主要動向
- オンライン
- 企業ウェブサイト
- eコマースウェブサイト
- オフライン
- スーパーマーケットとハイパーマーケット
- アウトドア専門店
- その他
第10章 市場推定・予測:地域別、2021~2034年
- 主要動向
- 北米
- 米国
- カナダ
- 欧州
- ドイツ
- 英国
- フランス
- イタリア
- スペイン
- オランダ
- アジア太平洋
- 中国
- インド
- 日本
- 韓国
- オーストラリア
- ラテンアメリカ
- ブラジル
- メキシコ
- アルゼンチン
- 中東・アフリカ
- アラブ首長国連邦
- サウジアラビア
- 南アフリカ
第11章 企業プロファイル
- B Medical System
- Bison Coolers
- Blowkings
- Cold Chain Technologies Inc.
- Cool Ice Box Company
- Eurobox Logistics
- FEURER Group GmbH
- Igloo Products Corp.
- K2Coolers
- Pelican Products Inc.
- Sofrigam Group
- Sonoco ThermoSafe
- va-Q-tec Thermal Solutions GmbH
- WILD Coolers
- YETI COOLERS, LLC.
The Global Cooler Box Market was valued at USD 8.8 billion in 2024 and is estimated to grow at a CAGR of 9.4% to reach USD 21.1 billion by 2034. Market momentum is being driven by a combination of rising demand for temperature-sensitive goods and a broader shift toward sustainable cold storage solutions. The diverse range of cooling capacities, from low-wattage units to systems exceeding 1.5 MW, illustrates the adaptability of cooler boxes across residential, commercial, and industrial sectors. Increasing attention on environmental responsibility is also steering buyers toward reusable cooler boxes, which emerge as cost-effective, durable alternatives to disposable containers. With growing environmental awareness influencing buying behavior, reusable cooler boxes are becoming integral to waste-reduction strategies for both consumers and businesses. As companies and industries align with global sustainability goals, the market for long-lasting, eco-conscious cold storage products is set to advance steadily in the years ahead.
The dependence on temperature-controlled logistics has become essential for protecting product quality and ensuring public health. A lack of cold chain solutions continues to impact critical sectors, particularly in healthcare, where millions of preventable child deaths are linked to failures in vaccine storage and transport. As the need for dependable, energy-efficient cooling systems expands, cooler boxes are proving vital in delivering reliable performance across variable temperature ranges, including ultra-low storage conditions. These cold chain logistics requirements are expected to sustain market expansion globally.
| Market Scope | |
|---|---|
| Start Year | 2024 |
| Forecast Year | 2025-2034 |
| Start Value | $8.8 Billion |
| Forecast Value | $21.1 Billion |
| CAGR | 9.4% |
The reusable cooler box segment led the market in 2024, reaching USD 6.4 billion and is anticipated to grow at a CAGR of 9.8% between 2025 and 2034. The rising shift away from single-use packaging is fueling interest in reusable models engineered for extended service life. Built from resilient materials, these cooler boxes are designed for repeated use without compromising insulation performance or structural durability. This evolution supports global sustainability targets while meeting the cost-efficiency needs of modern supply chains.
The pharmaceuticals segment generated USD 3.4 billion in 2024 holding a 39.2% share. Cold chain integrity remains a top priority in the pharmaceutical industry, where strict compliance standards require stable thermal environments for transportation and storage. The need for temperature-controlled solutions is amplified by the global demand for vaccine distribution and regulated storage of temperature-sensitive medications. Cooler boxes built to meet exacting pharmaceutical standards are seeing strong adoption to support consistent product efficacy and regulatory adherence.
United States Cooler Box Market was valued at USD 1.7 billion in 2024 and is estimated to grow at a CAGR of 10.3% from 2025 to 2034. Market growth in the US is driven by the expanding footprint of industries that depend on cold storage infrastructure. From meal delivery services to pharmaceutical logistics and grocery distribution, demand is climbing alongside infrastructure improvements. A surge in electricity usage across residential and commercial spaces is also supporting the adoption of high-efficiency cooling technologies. These factors point to a sustained rise in cold chain investments, creating favorable conditions for cooler box deployment across the country.
Notable companies active in the Global Cooler Box Market include Cold Chain Technologies Inc., va-Q-tec Thermal Solutions GmbH, WILD Coolers, FEURER Group GmbH, Pelican Products Inc., Igloo Products Corp., YETI COOLERS, LLC., K2Coolers, Sofrigam Group, Sonoco ThermoSafe, Cool Ice Box Company, Bison Coolers, Eurobox Logistics, Blowkings, and B Medical System. Companies operating in the cooler box industry are investing in material innovation, modular product design, and technological integration to build long-term competitiveness. Many players are focusing on producing reusable, durable, and thermally efficient cooler boxes to address rising environmental concerns. Customization options for diverse industries, including healthcare and food logistics, are being expanded to enhance market reach. Strategic partnerships with logistics providers and cold chain infrastructure developers are also strengthening supply chain connectivity. Leading manufacturers are actively enhancing R&D efforts to design lightweight, high-performance units compatible with smart temperature monitoring systems. Several firms are boosting their geographic presence by establishing regional manufacturing hubs, helping reduce shipping costs and respond more efficiently to localized demand across both developed and emerging markets.
Table of Contents
Chapter 1 Methodology & Scope
- 1.1 Market scope and definition
- 1.2 Research design
- 1.2.1 Research approach
- 1.2.2 Data collection methods
- 1.3 Data mining sources
- 1.3.1 Global
- 1.3.2 Regional/Country
- 1.4 Base estimates and calculations
- 1.4.1 Base year calculation
- 1.4.2 Key trends for market estimation
- 1.5 Primary research and validation
- 1.5.1 Primary sources
- 1.6 Forecast model
- 1.7 Research assumptions and limitations
Chapter 2 Executive Summary
- 2.1 Industry 360° synopsis
- 2.2 Key market trends
- 2.2.1 Type
- 2.2.2 Raw Material
- 2.2.3 Price Range
- 2.2.4 End Use
- 2.2.5 Distribution Channel
- 2.2.6 Regional
- 2.3 CXO perspective: Strategic imperatives
- 2.3.1 Key decision points for industry executives
- 2.3.2 Critical success factors for market players
- 2.4 Future outlook and strategic recommendations
Chapter 3 Industry Insights
- 3.1 Industry ecosystem analysis
- 3.1.1 Supplier Landscape
- 3.1.2 Profit Margin
- 3.1.3 Value addition at each stage
- 3.1.4 Factor affecting the value chain
- 3.1.5 Disruptions
- 3.2 Industry Impact forces
- 3.2.1 Growth drivers
- 3.2.2 Industry pitfalls & challenges
- 3.2.3 Opportunities
- 3.3 Growth potential analysis
- 3.4 Future market trends
- 3.5 Technology and innovation landscape
- 3.5.1 Current technological trends
- 3.5.2 Emerging technologies
- 3.6 Price trends
- 3.6.1 By region and type
- 3.7 Regulatory framework
- 3.7.1 Standards and certifications
- 3.7.2 Environmental regulations
- 3.7.3 Import export regulations
- 3.8 Porter’s analysis
- 3.9 PESTEL analysis
- 3.10 Consumer behavior analysis
- 3.10.1 Purchasing patterns
- 3.10.2 Preference analysis
- 3.10.3 Regional variations in consumer behavior
- 3.10.4 Impact of e-commerce on buying decisions
Chapter 4 Competitive Landscape, 2024
- 4.1 Introduction
- 4.2 Company market share analysis
- 4.2.1 By region
- 4.2.1.1 North America
- 4.2.1.2 Europe
- 4.2.1.3 Asia Pacific
- 4.2.1.4 Latin America
- 4.2.1.5 Middle East and Africa
- 4.2.1 By region
- 4.3 Company matrix analysis
- 4.4 Competitive analysis of major market players
- 4.5 Competitive positioning matrix
- 4.6 Key developments
- 4.6.1 Mergers & acquisitions
- 4.6.2 Partnerships & collaborations
- 4.6.3 New Product Launches
- 4.6.4 Expansion Plans
Chapter 5 Market Estimates & Forecast, By Type, 2021 - 2034 (USD Billion) (Thousand Units)
- 5.1 Key trends
- 5.2 Reusable
- 5.3 Disposable
Chapter 6 Market Estimates & Forecast, By Raw Material, 2021 - 2034 (USD Billion) (Thousand Units)
- 6.1 Key trends
- 6.2 Extruded polystyrene
- 6.3 Expanded polystyrene
- 6.4 Expanded polypropylene
Chapter 7 Market Estimates & Forecast, By Price Range, 2021 - 2034, (USD Billion) (Thousand Units)
- 7.1 Key trends
- 7.2 Low (Upto USD 30)
- 7.3 Medium (USD 30 - USD 50)
- 7.4 High (Above USD 50)
Chapter 8 Market Estimates & Forecast, By End Use, 2021 - 2034, (USD Billion) (Thousand Units)
- 8.1 Key trends
- 8.2 Pharmaceuticals
- 8.3 Food & beverages
- 8.4 Other
Chapter 9 Market Estimates & Forecast, By Distribution Channel, 2021 - 2034, (USD Billion) (Thousand Units)
- 9.1 Key trends
- 9.2 Online
- 9.2.1 Company Website
- 9.2.2 E-commerce website
- 9.3 Offline
- 9.3.1.1 Supermarkets and hypermarkets
- 9.3.1.2 Specialty outdoor stores
- 9.3.1.3 Others
Chapter 10 Market Estimates & Forecast, By Region, 2021 - 2034, (USD Billion) (Thousand Units)
- 10.1 Key trends
- 10.2 North America
- 10.2.1 U.S.
- 10.2.2 Canada
- 10.3 Europe
- 10.3.1 Germany
- 10.3.2 U.K.
- 10.3.3 France
- 10.3.4 Italy
- 10.3.5 Spain
- 10.3.6 Netherlands
- 10.4 Asia Pacific
- 10.4.1 China
- 10.4.2 India
- 10.4.3 Japan
- 10.4.4 South Korea
- 10.4.5 Australia
- 10.5 Latin America
- 10.5.1 Brazil
- 10.5.2 Mexico
- 10.5.3 Argentina
- 10.6 MEA
- 10.6.1 UAE
- 10.6.2 Saudi Arabia
- 10.6.3 South Africa
Chapter 11 Company Profiles (Business Overview, Financial Data, Product Landscape, Strategic Outlook, SWOT Analysis)
- 11.1 B Medical System
- 11.2 Bison Coolers
- 11.3 Blowkings
- 11.4 Cold Chain Technologies Inc.
- 11.5 Cool Ice Box Company
- 11.6 Eurobox Logistics
- 11.7 FEURER Group GmbH
- 11.8 Igloo Products Corp.
- 11.9 K2Coolers
- 11.10 Pelican Products Inc.
- 11.11 Sofrigam Group
- 11.12 Sonoco ThermoSafe
- 11.13 va-Q-tec Thermal Solutions GmbH
- 11.14 WILD Coolers
- 11.15 YETI COOLERS, LLC.

