
BEV車載充電器市場の機会、成長促進要因、産業動向分析、2025年~2034年の予測
BEV On-Board Charger Market Opportunity, Growth Drivers, Industry Trend Analysis, and Forecast 2025 - 2034- 発行日
- ページ情報
- 英文 145 Pages
- 納期
- 2~3営業日
- 商品コード
- 1685114
- カスタマイズ可能 お客様のご希望に応じて、既存データの加工や未掲載情報(例:国別セグメント)の追加などの対応が可能です。詳細はお問い合わせください。
- 翻訳ツール提供対象 PDF対応AI翻訳ツールの無料貸し出しサービスのご利用が可能です
概要
BEV車載充電器の世界市場は、2024年に197億米ドルに達し、2025年から2034年にかけてCAGR 20.1%という異例の高成長が見込まれています。
世界の電気自動車(EV)の台頭と持続可能なエネルギーソリューションへのシフトの高まりが、この需要急増の原動力となっています。消費者が電動モビリティをますます受け入れるようになるにつれ、より高速で効率的な充電システムが急務となっています。このような状況の変化は、メーカー各社がより高い定格出力を持つ車載充電器を革新的に製造することを促し、充電時間を大幅に短縮し、ユーザーの満足度を高めています。クリーンエネルギー技術へのシフトが加速しているため、EVは環境意識の高いドライバーに好まれる選択肢となっており、その結果、利便性と待ち時間の短縮を実現する高度な充電インフラと車載充電器技術のニーズが加速しています。
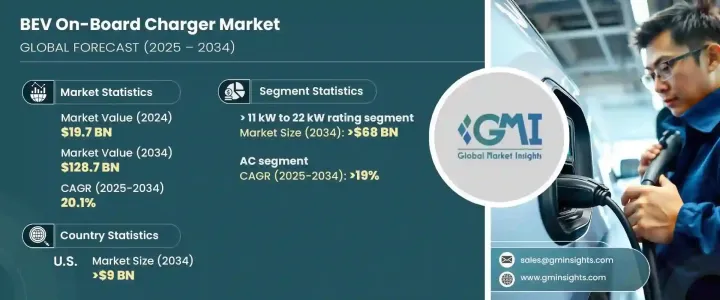
市場の主要セグメントのうち、定格出力11kW~22kWのBEV車載充電器は、2034年までに680億米ドルの市場規模になると予測されています。電気自動車の所有者がより迅速な充電ソリューションを求めているため、このセグメントは急成長が見込まれています。メーカーは、より高い出力を提供する充電器を開発することで対応しており、これによって自動車はより速く充電できるようになり、効率的で手間のかからない充電体験を求める消費者のニーズの高まりに応えています。このような高出力充電システムへのシフトは、EVの普及と充電インフラの拡大における世界の動向と一致しており、BEV市場が上昇基調を維持することを確実にしています。
| 市場規模 | |
|---|---|
| 開始年 | 2024 |
| 予測年 | 2025-2034 |
| 開始金額 | 197億米ドル |
| 予測金額 | 1,287億米ドル |
| CAGR | 20.1% |
もう一つの大きな動向は、AC(交流)EV車載充電器の台頭であり、2034年までのCAGRは19%になると予測されています。住宅地と商業地の両方でEV充電インフラの開発が進んでいることが、この成長を支えています。AC充電器はコスト効率が高く、広く普及しているため、家庭や公共の充電ステーションで電気自動車を充電したい消費者のアクセシビリティが高まっています。公共および民間の充電ネットワークの拡大に多額の投資が行われているため、AC車載充電器の需要は着実に増加しており、市場全体の成長に寄与しています。
米国のBEV車載充電器市場は、2034年までに90億米ドルに達すると予想されています。同国では電気自動車の普及が進んでおり、より高速で効率的な充電ソリューションへの需要が高まっていることが、この市場を牽引しています。メーカーは、より短い充電時間に対する消費者の期待に応えるため、11kW~22kWの充電器の生産に注力しています。充電プロセスをよりシームレスにし、異なるEVモデルや充電器間の相互運用性を高めることを目指し、充電プロトコルの標準化への取り組みも進められています。有利な政府政策に支えられた充電インフラの拡大は、米国市場とその成長の可能性をさらに後押ししています。
目次
第1章 調査手法と調査範囲
- 市場範囲と定義
- 市場推計・予測パラメータ
- 予測計算
- データソース
- 1次データ
- 2次データ
- 有料
- 公的
第2章 エグゼクティブサマリー
第3章 業界洞察
- エコシステム分析
- 規制状況
- 業界への影響要因
- 促進要因
- 業界の潜在的リスク&課題
- 成長ポテンシャル分析
- ポーター分析
- PESTEL分析
第4章 競合情勢
- イントロダクション
- 戦略的展望
- イノベーションと持続可能性の展望
第5章 市場規模・予測:定格別、2021年~2034年
- 主要動向
- 11 kW未満
- 11 kW~22 kW
- 22 kW以上
第6章 市場規模・予測:電流別、2021年~2034年
- 主要動向
- 交流
- 直流
第7章 市場規模・予測:地域別、2021~2034年
- 主要動向
- 北米
- 米国
- カナダ
- メキシコ
- 欧州
- ノルウェー
- ドイツ
- フランス
- オランダ
- 英国
- スウェーデン
- アジア太平洋
- 中国
- 日本
- インド
- 韓国
- オーストラリア
- 中東・アフリカ
- サウジアラビア
- アラブ首長国連邦
- 南アフリカ
- ラテンアメリカ
- ブラジル
- アルゼンチン
第8章 企業プロファイル
- Bel Fuse
- BorgWarner
- Brusa Elektronik
- Delta Energy Systems
- Eaton
- Ficosa Internacional
- Hyundai Motor
- Infineon Technologies
- Innolectric
- Nissan Motor
- Phinia
- Stercom Power Solutions
- STMicroelectronics
- Tesla
- Toyota Industries
- Valeo
- Xepics Italia
目次
The Global BEV On-Board Charger Market reached USD 19.7 billion in 2024 and is expected to expand at an exceptional CAGR of 20.1% from 2025 to 2034. The rise of electric vehicles (EVs) worldwide, coupled with the growing shift towards sustainable energy solutions, is driving this surge in demand. As consumers increasingly embrace electric mobility, there is an urgent need for faster and more efficient charging systems. This evolving landscape is encouraging manufacturers to innovate and produce on-board chargers with higher power ratings, reducing charging times significantly and enhancing user satisfaction. The accelerated shift to clean energy technologies is making EVs a preferred choice for eco-conscious drivers, which, in turn, accelerates the need for advanced charging infrastructure and on-board charger technologies that deliver convenience and reduced waiting times.
Among the key segments of the market, the BEV on-board chargers with power ratings ranging from 11 kW to 22 kW are projected to generate USD 68 billion by 2034. As electric vehicle owners demand quicker charging solutions, this segment is expected to grow rapidly. Manufacturers are responding by developing chargers that offer higher power outputs, allowing vehicles to charge faster and meet the growing needs of consumers who seek efficient, hassle-free charging experiences. This shift towards high-power charging systems aligns with global trends in EV adoption and charging infrastructure expansion, ensuring that the BEV market remains on an upward trajectory.
| Market Scope | |
|---|---|
| Start Year | 2024 |
| Forecast Year | 2025-2034 |
| Start Value | $19.7 Billion |
| Forecast Value | $128.7 Billion |
| CAGR | 20.1% |
Another significant trend is the rise of AC (alternating current) EV on-board chargers, which are anticipated to experience a CAGR of 19% through 2034. The increasing development of EV charging infrastructure in both residential and commercial areas is supporting this growth. AC chargers are cost-effective, and their widespread availability is enhancing accessibility for consumers looking to charge their electric vehicles at home or public charging stations. With significant investments being made in the expansion of both public and private charging networks, the demand for AC on-board chargers is steadily increasing, contributing to the market's overall growth.
The U.S. market for BEV on-board chargers is expected to generate USD 9 billion by 2034. The country's increasing adoption of electric vehicles, along with a growing demand for faster and more efficient charging solutions, is driving this market forward. Manufacturers are focusing on producing chargers within the 11 kW to 22 kW range to meet consumer expectations for quicker charge times. Efforts to standardize charging protocols are also underway, aiming to make the charging process more seamless and enhance interoperability between different EV models and chargers. The expansion of charging infrastructure, supported by favorable government policies, is further boosting the U.S. market and its growth potential.
Table of Contents
Chapter 1 Methodology & Scope
- 1.1 Market scope & definitions
- 1.2 Market estimates & forecast parameters
- 1.3 Forecast calculation
- 1.4 Data sources
- 1.4.1 Primary
- 1.4.2 Secondary
- 1.4.2.1 Paid
- 1.4.2.2 Public
Chapter 2 Executive Summary
- 2.1 Industry synopsis, 2021 - 2034
Chapter 3 Industry Insights
- 3.1 Industry ecosystem analysis
- 3.2 Regulatory landscape
- 3.3 Industry impact forces
- 3.3.1 Growth drivers
- 3.3.2 Industry pitfalls & challenges
- 3.4 Growth potential analysis
- 3.5 Porter's analysis
- 3.5.1 Bargaining power of suppliers
- 3.5.2 Bargaining power of buyers
- 3.5.3 Threat of new entrants
- 3.5.4 Threat of substitutes
- 3.6 PESTEL analysis
Chapter 4 Competitive Landscape, 2024
- 4.1 Introduction
- 4.2 Strategic outlook
- 4.3 Innovation & sustainability landscape
Chapter 5 Market Size and Forecast, By Rating, 2021 – 2034 (Units, USD Billion)
- 5.1 Key trends
- 5.2 < 11 kW
- 5.3 > 11 kW to 22 kW
- 5.4 > 22 kW
Chapter 6 Market Size and Forecast, By Current, 2021 – 2034 (Units, USD Billion)
- 6.1 Key trends
- 6.2 AC
- 6.3 DC
Chapter 7 Market Size and Forecast, By Region, 2021 – 2034 (Units, USD Billion)
- 7.1 Key trends
- 7.2 North America
- 7.2.1 U.S.
- 7.2.2 Canada
- 7.2.3 Mexico
- 7.3 Europe
- 7.3.1 Norway
- 7.3.2 Germany
- 7.3.3 France
- 7.3.4 Netherlands
- 7.3.5 UK
- 7.3.6 Sweden
- 7.4 Asia Pacific
- 7.4.1 China
- 7.4.2 Japan
- 7.4.3 India
- 7.4.4 South Korea
- 7.4.5 Australia
- 7.5 Middle East & Africa
- 7.5.1 Saudi Arabia
- 7.5.2 UAE
- 7.5.3 South Africa
- 7.6 Latin America
- 7.6.1 Brazil
- 7.6.2 Argentina
Chapter 8 Company Profiles
- 8.1 Bel Fuse
- 8.2 BorgWarner
- 8.3 Brusa Elektronik
- 8.4 Delta Energy Systems
- 8.5 Eaton
- 8.6 Ficosa Internacional
- 8.7 Hyundai Motor
- 8.8 Infineon Technologies
- 8.9 Innolectric
- 8.10 Nissan Motor
- 8.11 Phinia
- 8.12 Stercom Power Solutions
- 8.13 STMicroelectronics
- 8.14 Tesla
- 8.15 Toyota Industries
- 8.16 Valeo
- 8.17 Xepics Italia
- 発行日
- 発行
- Global Market Insights Inc.
- ページ情報
- 英文 145 Pages
- 納期
- 2~3営業日


