
|
市場調査レポート
商品コード
1685057
フィリングおよびトッピング市場の機会、成長促進要因、産業動向分析、2025年~2034年の予測Fillings and Toppings Market Opportunity, Growth Drivers, Industry Trend Analysis, and Forecast 2025 - 2034 |
||||||
カスタマイズ可能
|
|||||||
| フィリングおよびトッピング市場の機会、成長促進要因、産業動向分析、2025年~2034年の予測 |
|
出版日: 2025年01月06日
発行: Global Market Insights Inc.
ページ情報: 英文 200 Pages
納期: 2~3営業日
|

全表示
- 概要
- 目次
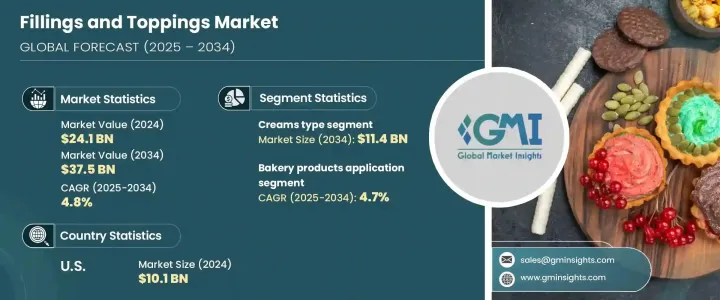
フィリングおよびトッピングの世界市場は2024年に241億米ドルと評価され、2025年から2034年までのCAGRは4.8%と予測されています。
消費者が新しい贅沢な味を求め続ける中、食品メーカーはフルーツやチョコレートからナッツまで幅広いフィリングおよびトッピングを導入することで対応しています。このような製品提供の多様化により、企業は新鮮で風味豊かな体験を求める消費者を魅了するユニークで魅力的な食品を作り出すことができます。
特にベーカリーや菓子類の分野では、より高品質で個性的な味を求める消費者が増えており、高級な職人技を駆使した製品への関心が高まっていることも、この市場の追い風となっています。さらに、オンライン食料品ショッピングやeコマース・プラットフォームの人気の拡大により、さまざまなフィリングやトッピングへのアクセスが簡素化され、需要がさらに高まっています。メーカー各社は、現代消費者の進化する嗜好に対応するために技術革新を優先しており、クリーンラベル処方と持続可能な包装に明確な重点を置いています。
| 市場範囲 | |
|---|---|
| 開始年 | 2024 |
| 予測年 | 2025-2034 |
| 開始金額 | 241億米ドル |
| 予測金額 | 375億米ドル |
| CAGR | 4.8% |
数ある製品カテゴリーの中で、クリーム分野は2024年に114億米ドルの売上が見込まれ、この数字は2034年までCAGR 4.5%で成長すると予測されています。クリームは滑らかな食感と汎用性で好まれ、デザートやケーキからペストリーに至るまで、幅広い食品用途で人気のある選択肢となっています。クリームには乳製品、非乳製品、ホイップ入りの品種があり、幅広い消費者の嗜好に対応しているため、市場での支配的地位はさらに強固なものとなっています。
用途別では、ベーカリー製品分野が最大のシェアを占め、2024年の市場規模は105億米ドルで43.5%を占める。この分野は、2025年から2034年にかけてCAGR 4.7%で成長すると予想されています。ケーキ、ペストリー、パンなどのベーカリー・アイテムには、クリーム、フルーツベースのフィリング、ペーストが頻繁に使われ、フィリングおよびトッピング市場の大きな需要を牽引しています。贅沢でありながら便利な食品オプションへの嗜好の高まりと、カスタマイズ可能な高級ベーカリー製品への欲求の高まりが、この市場の成長に寄与しています。
米国では、フィリングおよびトッピング市場は2034年までに101億米ドルに達し、2025年から2034年までのCAGRは4.5%になると予測されています。この成長の原動力となっているのは、食品の利便性とカスタマイズに対する消費者の嗜好の変化です。特にベーカリー、菓子類、乳製品業界では、消費者が高品質で個性的な製品に投資する傾向を強めているため、高級フィリングやトッピングの需要が増加しています。クリームは、その汎用性の高さと、様々なデザート、焼き菓子、ペストリーに広く使用されていることから、この地域では引き続き優位を占めています。
目次
第1章 調査手法と調査範囲
- 市場範囲と定義
- 基本推定と計算
- 予測計算
- データソース
- 1次データ
- 二次資料
- 有料情報源
- 公的情報源
第2章 エグゼクティブサマリー
第3章 業界洞察
- エコシステム分析
- バリューチェーンに影響を与える要因
- 利益率分析
- 破壊
- 将来の展望
- メーカー
- 流通業者
- サプライヤーの状況
- 利益率分析
- 主要ニュース
- 規制状況
- 影響要因
- 業界への影響要因
- 促進要因
- 加工食品とスナック菓子の需要の増加
- 高級食品および機能性食品の人気の高まり
- 飲食品産業の拡大
- 市場の課題
- 健康への懸念
- 促進要因
- 規制と市場への影響
- ポーター分析
- PESTEL分析
第4章 競合情勢
- イントロダクション
- 企業シェア分析
- 競合のポジショニング・マトリックス
- 戦略展望マトリックス
第5章 市場規模・予測:タイプ別、2021年~2034年
- 主要動向
- クリーム
- フルーツとナッツ
- フォンダン
- スプリンクル
- シロップ
- ペースト・バリエーション
第6章 市場規模・予測:フレーバー別、2021年~2034年
- 主要動向
- フルーツ
- チョコレート
- バニラ
- スパイス
- ナッツ
第7章 市場規模・予測:用途別、2021年~2034年
- 主要動向
- ベーカリー製品
- 菓子類
- 乳製品
- 冷凍製品
第8章 市場規模・予測:原材料別、2021年~2034年
- 主要動向
- フルーツ
- でんぷん
- ハイドロコロイド
- 甘味料
- 乳製品原料
- ココア
- その他
第9章 市場規模・予測:地域別、2021年~2034年
- 主要動向
- 北米
- 米国
- カナダ
- 欧州
- 英国
- ドイツ
- フランス
- イタリア
- スペイン
- ロシア
- アジア太平洋
- 中国
- インド
- 日本
- 韓国
- オーストラリア
- ラテンアメリカ
- ブラジル
- メキシコ
- 中東・アフリカ
- 南アフリカ
- サウジアラビア
- アラブ首長国連邦
第10章 企業プロファイル
- ADM
- Bakkavor Group
- Barry Callebaut
- Cargill
- CSM Bakery Ingredients
- Dawn Foods
- Fleischmann's Ingredients
- Frutarom
- Ikor Group
- Ingredion
- Kerry Group
- Nestle
- Puratos
- Sensient Technologies
- Tate &Lyle
The Global Fillings And Toppings Market was valued at USD 24.1 billion in 2024 and is projected to experience a CAGR of 4.8% from 2025 to 2034. As consumers continue to seek out new, indulgent flavors, food manufacturers are responding by introducing a broad spectrum of fillings and toppings, ranging from fruits and chocolates to nuts. This growing diversity in product offerings allows companies to create unique and appealing food items that captivate consumers looking for fresh, flavorful experiences.
The market is also benefiting from increasing consumer interest in premium, artisanal products, particularly within the bakery and confectionery sectors, as people demand higher quality and distinctive flavors. Additionally, the expanding popularity of online grocery shopping and e-commerce platforms has simplified access to a variety of fillings and toppings, further fueling demand. Manufacturers are prioritizing innovation to meet the evolving preferences of modern consumers, with a clear focus on clean-label formulations and sustainable packaging.
| Market Scope | |
|---|---|
| Start Year | 2024 |
| Forecast Year | 2025-2034 |
| Start Value | $24.1 Billion |
| Forecast Value | $37.5 Billion |
| CAGR | 4.8% |
Among the many product categories, the creams segment is expected to generate USD 11.4 billion in 2024, and this number is projected to grow at a 4.5% CAGR through 2034. Creams are favored for their smooth texture and versatility, making them a popular choice in a wide array of food applications, from desserts and cakes to pastries. Available in dairy, non-dairy, and whipped varieties, creams cater to a broad range of consumer preferences, further solidifying their dominant position in the market.
In terms of application, the bakery products sector holds the largest share, accounting for 43.5% of the market in 2024, valued at USD 10.5 billion. This segment is expected to grow at a 4.7% CAGR from 2025 to 2034. Bakery items such as cakes, pastries, and bread frequently feature creams, fruit-based fillings, and pastes, driving significant demand in the fillings and toppings market. The rising preference for indulgent yet convenient food options, combined with an increasing desire for customizable and premium bakery products, is contributing to this market growth.
In the U.S., the fillings and toppings market is forecasted to reach USD 10.1 billion by 2034, with a CAGR of 4.5% from 2025 to 2034. This growth is fueled by shifting consumer preferences toward convenience and customization in food. Particularly in the bakery, confectionery, and dairy industries, the demand for premium fillings and toppings is increasing as consumers are more inclined to invest in high-quality, unique products. Creams continue to dominate in this region due to their versatility and widespread use in various desserts, baked goods, and pastries.
Table of Contents
Chapter 1 Methodology & Scope
- 1.1 Market scope & definition
- 1.2 Base estimates & calculations
- 1.3 Forecast calculation
- 1.4 Data sources
- 1.4.1 Primary
- 1.4.2 Secondary
- 1.4.2.1 Paid sources
- 1.4.2.2 Public sources
Chapter 2 Executive Summary
- 2.1 Industry synopsis, 2021-2034
Chapter 3 Industry Insights
- 3.1 Industry ecosystem analysis
- 3.1.1 Factor affecting the value chain
- 3.1.2 Profit margin analysis
- 3.1.3 Disruptions
- 3.1.4 Future outlook
- 3.1.5 Manufacturers
- 3.1.6 Distributors
- 3.2 Supplier landscape
- 3.3 Profit margin analysis
- 3.4 Key news & initiatives
- 3.5 Regulatory landscape
- 3.6 Impact forces
- 3.7 Industry impact forces
- 3.7.1 Growth drivers
- 3.7.1.1 Increasing demand for processed foods and snacks
- 3.7.1.2 Growing popularity of premium and functional food products
- 3.7.1.3 Expanding food and beverage industry
- 3.7.2 Market challenges
- 3.7.2.1 Health concerns
- 3.7.1 Growth drivers
- 3.8 Regulations & market impact
- 3.9 Porter’s analysis
- 3.10 PESTEL analysis
Chapter 4 Competitive Landscape, 2024
- 4.1 Introduction
- 4.2 Company market share analysis
- 4.3 Competitive positioning matrix
- 4.4 Strategic outlook matrix
Chapter 5 Market Size and Forecast, By Type, 2021-2034 (USD Billion) (kilo Tons)
- 5.1 Key trends
- 5.2 Creams
- 5.3 Fruits and nuts
- 5.4 Fondants
- 5.5 Sprinkles
- 5.6 Syrups
- 5.7 Pastes and variegates
Chapter 6 Market Size and Forecast, By Flavor, 2021-2034 (USD Billion) (kilo Tons)
- 6.1 Key trends
- 6.2 Fruits
- 6.3 Chocolates
- 6.4 Vanilla
- 6.5 Spices
- 6.6 Nuts
Chapter 7 Market Size and Forecast, By Application, 2021-2034 (USD Billion) (kilo Tons)
- 7.1 Key trends
- 7.2 Bakery products
- 7.3 Confectionery products
- 7.4 Dairy products
- 7.5 Frozen products
Chapter 8 Market Size and Forecast, By Raw Material, 2021-2034 (USD Billion) (kilo Tons)
- 8.1 Key trends
- 8.2 Fruits
- 8.3 Starch
- 8.4 Hydrocolloid
- 8.5 Sweeteners
- 8.6 Dairy ingredients
- 8.7 Cocoa
- 8.8 Others
Chapter 9 Market Size and Forecast, By Region, 2021-2034 (USD Billion) (kilo Tons)
- 9.1 Key trends
- 9.2 North America
- 9.2.1 U.S.
- 9.2.2 Canada
- 9.3 Europe
- 9.3.1 UK
- 9.3.2 Germany
- 9.3.3 France
- 9.3.4 Italy
- 9.3.5 Spain
- 9.3.6 Russia
- 9.4 Asia Pacific
- 9.4.1 China
- 9.4.2 India
- 9.4.3 Japan
- 9.4.4 South Korea
- 9.4.5 Australia
- 9.5 Latin America
- 9.5.1 Brazil
- 9.5.2 Mexico
- 9.6 MEA
- 9.6.1 South Africa
- 9.6.2 Saudi Arabia
- 9.6.3 UAE
Chapter 10 Company Profiles
- 10.1 ADM
- 10.2 Bakkavor Group
- 10.3 Barry Callebaut
- 10.4 Cargill
- 10.5 CSM Bakery Ingredients
- 10.6 Dawn Foods
- 10.7 Fleischmann's Ingredients
- 10.8 Frutarom
- 10.9 Ikor Group
- 10.10 Ingredion
- 10.11 Kerry Group
- 10.12 Nestle
- 10.13 Puratos
- 10.14 Sensient Technologies
- 10.15 Tate & Lyle

