
|
市場調査レポート
商品コード
1741041
CNG車とLPG車の市場機会、成長促進要因、産業動向分析、2025~2034年予測CNG and LPG Vehicles Market Opportunity, Growth Drivers, Industry Trend Analysis, and Forecast 2025 - 2034 |
||||||
カスタマイズ可能
|
|||||||
| CNG車とLPG車の市場機会、成長促進要因、産業動向分析、2025~2034年予測 |
|
出版日: 2025年04月14日
発行: Global Market Insights Inc.
ページ情報: 英文 170 Pages
納期: 2~3営業日
|

全表示
- 概要
- 目次
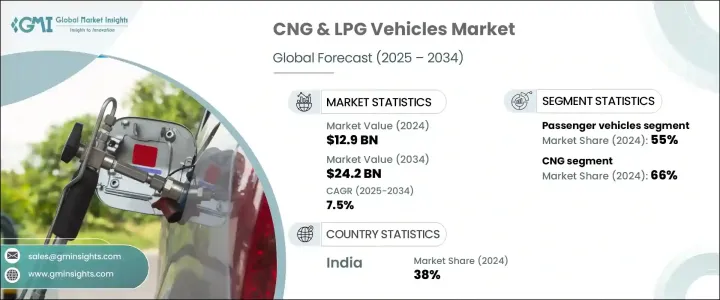
CNG車とLPG車の世界市場規模は2024年に129億米ドルとなり、CAGR 7.5%で成長し、2034年には242億米ドルに達すると推定されます。
気候変動と大気環境の悪化に対する社会的意識の高まりが、政府と消費者の双方を環境に優しいモビリティ・ソリューションへと押し上げています。エネルギー安全保障が世界的に注目される中、従来のガソリン車やディーゼル車に代わる実用的な選択肢として、大幅なコスト削減と低炭素排出を実現するCNG車とLPG車が台頭しています。世界各国は、積極的な排ガス規制を導入し、燃費基準を強化し、代替燃料の導入を奨励しており、CNG車とLPG車はますます魅力的な選択肢となっています。CNGエンジンの技術的進歩は、有害な汚染物質を大幅に削減しながら車両性能をさらに向上させ、市場を将来の力強い成長に向けて位置づけています。クリーンエネルギー・インフラ、改造ソリューション、給油ネットワークの拡大への投資は、長期的な普及を支えるエコシステムを構築しています。さらに、燃料価格の乱高下により、フリート事業者や個人消費者はより経済的で持続可能な選択肢を模索するようになり、CNG車とLPG車は将来のモビリティ動向の最前線に位置しています。
CNG車とLPG車は、各国が環境への責任と経済的な実現可能性をバランスさせた代替交通手段を推進する中、世界の持続可能性イニシアチブの重要なプレーヤーとなりつつあります。各国政府は、よりクリーンな燃料の採用を促進するために、より厳しい排出規制を実施し、税金の払い戻しや助成金などの魅力的なインセンティブを提供することで、大胆な措置を講じています。いくつかの主要市場では、車両運行会社が長期的な運行コストのメリットを実現するため、ディーゼルからCNGへの移行を進めています。手頃な価格の改造キットが入手可能であることと、費用対効果の高いソリューションを好む公共交通機関の存在感が高まっていることが相まって、コストに敏感な消費者の間でCNG車やLPG車の採用傾向が強まっています。
| 市場範囲 | |
|---|---|
| 開始年 | 2024 |
| 予測年 | 2025-2034 |
| 開始金額 | 129億米ドル |
| 予測金額 | 242億米ドル |
| CAGR | 7.5% |
乗用車セグメントは2024年に55%のシェアを占め、市場を席巻しました。購入者は手頃な価格と環境性能を優先するため、2034年までCAGR 7%で成長すると予測されます。商用車分野では、CNGを燃料とするトラックや配達用バンの台頭が、従来の車両に代わるクリーンで燃料効率の高い選択肢を提供することで、都市部の物流を再構築しています。特に都市環境における商用車は、運行効率と支援的な政策枠組みの恩恵を受けています。密集した大都市圏では、CNGやLPGで走る三輪車が急速に普及しており、短距離輸送に実用的で手頃なソリューションを提供しています。
圧縮天然ガス(CNG)セグメントは、2024年の世界市場セグメンテーションで66%の圧倒的シェアを占めました。CNGのリーダーシップは、手頃な価格、排出ガスの削減、ますます厳しくなる環境規制への対応という点で、CNGが提供する明確なメリットに起因しています。CNGは、カーボンフットプリントの削減とコスト削減により、商用車と個人消費者の両方にとって好ましい選択肢として台頭し続けています。
インドのCNG車とLPG車市場は2024年に24億米ドルを生み出し、世界市場の38%のシェアを占める。急速な都市化、従来型燃料価格のインフレ圧力、代替燃料を支持する強力な公共政策がこの成長を後押ししています。主要都市では、よりクリーンな公共交通機関へのシフトが着実に進んでおり、CNGバスやタクシーがその先頭を走っています。内燃エンジン車にCNGキットを装着することで、都市景観の移行がさらに加速しています。
トヨタ、現代自動車、マヒンドラ・アンド・マヒンドラ、タタ・モーターズ、フォード・モーター、ゼネラル・モーターズ、フォルクスワーゲン・グループ、IVECO、MAN SE、ホンダなどの主要企業は、製品革新に多額の投資を行い、CNG・LPG車のポートフォリオを拡大し、販売網を強化しています。特に新興市場では、燃料供給会社と協力して燃料補給インフラを改善しているところが多いです。ハイブリッドCNG技術、スマートビークル統合、フリートパートナーシップモデルなどの戦略は、各社が進化するCNG車とLPG車市場での足場を固めるのに役立っています。
目次
第1章 調査手法と範囲
第2章 エグゼクティブサマリー
第3章 業界考察
- エコシステム分析
- サプライヤーの情勢
- 燃料供給業者
- 部品メーカー
- 自動車メーカー(OEM)
- 改造業者とアフターマーケットサプライヤー
- 流通・小売インフラ
- 利益率分析
- トランプ政権による関税への影響
- 業界への影響
- 供給側の影響(原材料)
- 主要原材料の価格変動
- サプライチェーンの再構築
- 生産コストへの影響
- 需要側の影響(販売価格)
- 最終市場への価格伝達
- 市場シェアの動向
- 供給側の影響(原材料)
- 影響を受ける主要企業
- 業界への影響
- テクノロジーとイノベーションの情勢
- 特許分析
- 主なニュースと取り組み
- 規制情勢
- 影響要因
- 促進要因
- CNG技術の急速な進歩
- 持続可能なモビリティへの重点化
- 費用対効果の高い輸送手段に対するニーズの高まり
- ガソリン車よりもメンテナンスコストが低い
- 業界の潜在的リスク&課題
- 初期費用が高め
- ガソリン車に比べて性能が低い
- 促進要因
- 成長可能性分析
- ポーター分析
- PESTEL分析
第4章 競合情勢
- イントロダクション
- 企業の市場シェア分析
- 競合ポジショニングマトリックス
- 戦略的展望マトリックス
第5章 市場推計・予測:車両別、2021-2034
- 主要動向
- 乗用車
- ハッチバック
- セダン
- SUV
5.3三輪車
- 商用車
- 小型商用車(LCV)
- 中型商用車(MCV)
- 大型商用車(HCV)
第6章 市場推計・予測:燃料別、2021-2034
- 主要動向
- LPG
- CNG
第7章 市場推計・予測:エンジンシステム別、2021-2034
- 主要動向
- 専用システム
- バイフューエル
- デュアル燃料
第8章 市場推計・予測:フィッティング別、2021-2034
- 主要動向
- OEM
- アフターマーケット
第9章 市場推計・予測:地域別、2021-2034
- 主要動向
- 北米
- 米国
- カナダ
- 欧州
- 英国
- ドイツ
- フランス
- イタリア
- スペイン
- ロシア
- 北欧諸国
- アジア太平洋地域
- 中国
- インド
- 日本
- 韓国
- オーストラリア・ニュージーランド
- 東南アジア
- ラテンアメリカ
- ブラジル
- メキシコ
- アルゼンチン
- 中東・アフリカ
- アラブ首長国連邦
- サウジアラビア
- 南アフリカ
第10章 企業プロファイル
- Ashok Leyland
- Bajaj Auto
- Ford Motor Company
- General Motors
- Honda
- Hyundai Motor Company
- Isuzu Motors
- IVECO
- Kia Motors
- Landi Renzo
- Mahindra &Mahindra
- MAN SE
- Maruti Suzuki
- Renault
- SEAT
- Skoda Auto
- Tata Motors
- Toyota
- Volkswagen Group
- Westport Fuel Systems
The Global CNG and LPG Vehicles Market was valued at USD 12.9 billion in 2024 and is estimated to grow at a CAGR of 7.5% to reach USD 24.2 billion by 2034, driven by the surging demand for environmentally friendly and fuel-efficient vehicles. Growing public awareness about climate change and deteriorating air quality has pushed both governments and consumers toward greener mobility solutions. As energy security gains prominence worldwide, CNG and LPG vehicles are emerging as practical alternatives to traditional gasoline and diesel vehicles, offering substantial cost savings and lower carbon emissions. Countries around the world are rolling out aggressive emission norms, tightening fuel economy standards, and incentivizing alternative fuel adoption, making CNG and LPG vehicles an increasingly attractive choice. Technological advancements in CNG engines are further elevating vehicle performance while significantly cutting down harmful pollutants, positioning the market for strong future growth. Investment in clean energy infrastructure, retrofitting solutions, and the expansion of refueling networks is creating an ecosystem that supports long-term adoption. Moreover, rising fuel price volatility is pushing fleet operators and individual consumers to explore more economical and sustainable options, putting CNG and LPG vehicles at the forefront of future mobility trends.
CNG and LPG vehicles are becoming vital players in global sustainability initiatives as nations push for transportation alternatives that balance environmental responsibility with economic feasibility. Governments are taking bold steps by implementing stricter emission norms and offering attractive incentives, including tax rebates and grants, to drive the adoption of cleaner fuels. In several key markets, fleet operators are increasingly transitioning from diesel to CNG to realize long-term operational cost benefits. The availability of affordable retrofitting kits, combined with the growing presence of public transportation systems that favor cost-effective solutions, is reinforcing the trend toward CNG and LPG vehicle adoption among cost-sensitive consumers.
| Market Scope | |
|---|---|
| Start Year | 2024 |
| Forecast Year | 2025-2034 |
| Start Value | $12.9 Billion |
| Forecast Value | $24.2 Billion |
| CAGR | 7.5% |
The passenger vehicles segment dominated the market with a 55% share in 2024 and is projected to grow at a CAGR of 7% through 2034, as buyers prioritize affordability and environmental performance. On the commercial side, the rise of CNG-powered trucks and delivery vans is reshaping urban logistics by offering clean, fuel-efficient alternatives to traditional fleets. Commercial vehicles, particularly in urban environments, are benefiting from operational efficiencies and supportive policy frameworks. In dense metropolitan areas, three-wheelers running on CNG and LPG are gaining rapid traction, offering a practical and affordable solution for short-distance transportation.
The compressed natural gas (CNG) segment held a commanding 66% share of the global CNG and LPG vehicles market in 2024. Its leadership stems from the clear benefits it offers in terms of affordability, reduced emissions, and compliance with increasingly stringent environmental regulations. CNG continues to emerge as a preferred choice for both commercial fleets and individual consumers, thanks to its reduced carbon footprint and cost savings.
India's CNG and LPG Vehicles Market generated USD 2.4 billion in 2024, capturing a 38% share of the global market. Rapid urbanization, inflationary pressures on conventional fuel prices, and robust public policies favoring alternative fuels are driving this growth. Major cities are witnessing a steady shift toward cleaner public transportation options, with CNG buses and taxis leading the way. Retrofitting of internal combustion engine vehicles with CNG kits is further accelerating this transition across urban landscapes.
Leading automakers like Toyota, Hyundai Motor Company, Mahindra and Mahindra, Tata Motors, Ford Motor Company, General Motors, Volkswagen Group, IVECO, MAN SE, and Honda are heavily investing in product innovations, expanding their CNG and LPG vehicle portfolios, and strengthening their distribution networks. Many are collaborating with fuel providers to improve refueling infrastructure, especially in emerging markets. Strategies such as hybridized CNG technologies, smart vehicle integrations, and fleet partnership models are helping companies solidify their foothold in the evolving CNG and LPG vehicles market.
Table of Contents
Chapter 1 Methodology & Scope
- 1.1 Research design
- 1.1.1 Research approach
- 1.1.2 Data collection methods
- 1.2 Base estimates and calculations
- 1.2.1 Base year calculation
- 1.2.2 Key trends for market estimates
- 1.3 Forecast model
- 1.4 Primary research & validation
- 1.4.1 Primary sources
- 1.4.2 Data mining sources
- 1.5 Market definitions
Chapter 2 Executive Summary
- 2.1 Industry 3600 synopsis, 2021 - 2034
Chapter 3 Industry Insights
- 3.1 Industry ecosystem analysis
- 3.2 Supplier landscape
- 3.2.1 Fuel providers
- 3.2.2 Component manufacturers
- 3.2.3 Vehicle manufacturers (OEMs)
- 3.2.4 Retrofitters and aftermarket suppliers
- 3.2.5 Distribution and retail infrastructure
- 3.3 Profit margin analysis
- 3.4 Trump administration tariffs
- 3.4.1 Impact on the industry
- 3.4.1.1 Supply-side impact (raw materials)
- 3.4.1.1.1 Price volatility in key materials
- 3.4.1.1.2 Supply chain restructuring
- 3.4.1.1.3 Production cost implications
- 3.4.1.2 Demand-side impact (selling price)
- 3.4.1.2.1 Price transmission to end markets
- 3.4.1.2.2 Market share dynamics
- 3.4.1.1 Supply-side impact (raw materials)
- 3.4.2 Key companies impacted
- 3.4.1 Impact on the industry
- 3.5 Technology & innovation landscape
- 3.6 Patent analysis
- 3.7 Key news & initiatives
- 3.8 Regulatory landscape
- 3.9 Impact forces
- 3.9.1 Growth drivers
- 3.9.1.1 Rapid advancements in CNG technology
- 3.9.1.2 Increasing emphasis on sustainable mobility
- 3.9.1.3 Rising need for cost-effective transportation
- 3.9.1.4 Lower maintenance cost than petrol-powered vehicles
- 3.9.2 Industry pitfalls & challenges
- 3.9.2.1 Higher upfront costs
- 3.9.2.2 Reduced performance compared to petrol-powered vehicles
- 3.9.1 Growth drivers
- 3.10 Growth potential analysis
- 3.11 Porter's analysis
- 3.12 PESTEL analysis
Chapter 4 Competitive Landscape, 2024
- 4.1 Introduction
- 4.2 Company market share analysis
- 4.3 Competitive positioning matrix
- 4.4 Strategic outlook matrix
Chapter 5 Market Estimates & Forecast, By Vehicle, 2021 - 2034 ($Bn, Units)
- 5.1 Key trends
- 5.2 Passenger vehicles
- 5.2.1 Hatchback
- 5.2.2 Sedan
- 5.2.3 SUV
5.3 Three-wheelers
- 5.4 Commercial vehicles
- 5.4.1 Light Commercial Vehicles (LCV)
- 5.4.2 Medium Commercial Vehicles (MCV)
- 5.4.3 Heavy Commercial Vehicles (HCV)
Chapter 6 Market Estimates & Forecast, By Fuel, 2021 - 2034 ($Bn, Units)
- 6.1 Key trends
- 6.2 LPG
- 6.3 CNG
Chapter 7 Market Estimates & Forecast, By Engine System, 2021 - 2034 ($Bn, Units)
- 7.1 Key trends
- 7.2 Dedicated system
- 7.3 Bi-fuel
- 7.4 Dual fuel
Chapter 8 Market Estimates & Forecast, By Fitting, 2021 - 2034 ($Bn, Units)
- 8.1 Key trends
- 8.2 OEM
- 8.3 Aftermarket
Chapter 9 Market Estimates & Forecast, By Region, 2021 - 2034 ($Bn, Units)
- 9.1 Key trends
- 9.2 North America
- 9.2.1 U.S.
- 9.2.2 Canada
- 9.3 Europe
- 9.3.1 UK
- 9.3.2 Germany
- 9.3.3 France
- 9.3.4 Italy
- 9.3.5 Spain
- 9.3.6 Russia
- 9.3.7 Nordics
- 9.4 Asia Pacific
- 9.4.1 China
- 9.4.2 India
- 9.4.3 Japan
- 9.4.4 South Korea
- 9.4.5 ANZ
- 9.4.6 Southeast Asia
- 9.5 Latin America
- 9.5.1 Brazil
- 9.5.2 Mexico
- 9.5.3 Argentina
- 9.6 MEA
- 9.6.1 UAE
- 9.6.2 Saudi Arabia
- 9.6.3 South Africa
Chapter 10 Company Profiles
- 10.1 Ashok Leyland
- 10.2 Bajaj Auto
- 10.3 Ford Motor Company
- 10.4 General Motors
- 10.5 Honda
- 10.6 Hyundai Motor Company
- 10.7 Isuzu Motors
- 10.8 IVECO
- 10.9 Kia Motors
- 10.10 Landi Renzo
- 10.11 Mahindra & Mahindra
- 10.12 MAN SE
- 10.13 Maruti Suzuki
- 10.14 Renault
- 10.15 SEAT
- 10.16 Skoda Auto
- 10.17 Tata Motors
- 10.18 Toyota
- 10.19 Volkswagen Group
- 10.20 Westport Fuel Systems

