
|
市場調査レポート
商品コード
1666916
セラミックマトリックス複合材料の市場機会、成長促進要因、産業動向分析、2025年~2034年予測Ceramic Matrix Composites Market Opportunity, Growth Drivers, Industry Trend Analysis, and Forecast 2025 - 2034 |
||||||
カスタマイズ可能
|
|||||||
| セラミックマトリックス複合材料の市場機会、成長促進要因、産業動向分析、2025年~2034年予測 |
|
出版日: 2024年12月19日
発行: Global Market Insights Inc.
ページ情報: 英文 310 Pages
納期: 2~3営業日
|

全表示
- 概要
- 目次
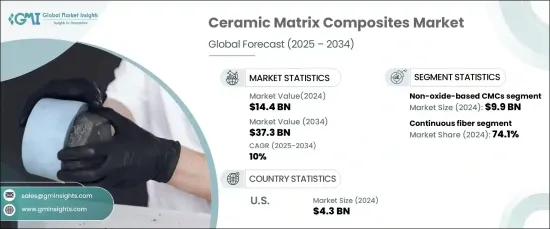
セラミックマトリックス複合材料の世界市場は力強い成長を遂げており、2024年には144億米ドルに達し、2025年から2034年までのCAGRは10%で拡大すると予測されています。
セラミックマトリックス複合材料は、その卓越した強度対重量比、優れた高温耐性、比類のない耐久性により、産業に革命をもたらしています。これらの先端材料は、航空宇宙、防衛、エネルギー分野など、過酷な条件下での性能が最重要視される用途に不可欠です。従来の金属や合金に代わる軽量で高強度な代替材料が重視されるようになったことで、CMCは燃費の向上と二酸化炭素排出量の削減を追求する上で重要な要素となっています。多様な用途で採用が進むCMCは、現代のエンジニアリングとテクノロジーにおける重要性を強調しています。
航空宇宙・防衛産業はCMC需要の最前線にあり、タービンブレード、排気システム、航空機や宇宙船の構造補強材などの高性能部品にこれらの材料を使用しています。燃料効率を高め、持続可能な目標を達成するための世界の取り組みが強化される中、CMCのユニークな特性は、不可欠な材料選択となっています。優れた機械的強度と耐熱性を維持しながら大幅な軽量化が可能なCMCは、最先端の航空・宇宙技術の厳しい要求を確実に満たします。
| 市場範囲 | |
|---|---|
| 開始年 | 2024年 |
| 予測年 | 2025年~2034年 |
| 開始金額 | 144億米ドル |
| 予測金額 | 373億米ドル |
| CAGR | 10% |
マトリックス材料の観点から、CMC市場は酸化物ベースと非酸化物ベースの複合材料に分けられます。非酸化物ベースのCMCが市場を独占し、2024年には99億米ドルの収益を生み出しました。炭化ケイ素(SiC)と炭素を主成分とするこれらの複合材料は、卓越した機械的強度、耐熱性、摩耗特性で知られています。これらの特性により、航空宇宙、自動車、エネルギーなど、性能を損なうことなく過酷な条件に耐える必要がある産業で特に重宝されています。
繊維タイプ別の市場セグメンテーションでは、連続繊維強化セラミックマトリックス複合材料(CF-CMC)が市場シェアの74.1%を占め、強く選好されていることが明らかになりました。CF-CMCは、強度、熱安定性、耐損傷性に優れているため、高い人気があります。セラミックマトリックス内にセラミックまたはカーボンの連続繊維を埋め込むことで、これらの複合材料は熱衝撃や機械的応力に対して比類のない耐性を発揮します。この弾力性により、CF-CMCは先進推進システムや重要産業の構造部品などの高性能用途に選ばれる材料となっています。
米国は北米のセラミックマトリックス複合材料市場をリードし、2024年には43億米ドルの売上を生み出します。同国の優位性は、堅調な航空宇宙・防衛分野、充実した研究開発投資、大手メーカーの存在に起因します。航空やエネルギーなどの産業で軽量かつ高強度材料への需要が高まっているため、米国市場はCMC技術の革新と採用の最前線にあり続けています。
目次
第1章 調査手法と調査範囲
- 市場範囲と定義
- 基本推定と計算
- 予測計算
- データソース
- 一次
- 二次
- 有料ソース
- 公的ソース
第2章 エグゼクティブサマリー
第3章 業界洞察
- 業界エコシステム分析
- バリューチェーンに影響を与える要因
- 利益率分析
- 変革
- 将来の展望
- メーカー
- 流通業者
- サプライヤーの状況
- 利益率分析
- 主要ニュースと取り組み
- 規制状況
- 影響要因
- 成長促進要因
- 航空宇宙・防衛分野での高い需要
- 軽量自動車部品への注目の高まり
- 再生可能エネルギー用途の成長
- 業界の潜在的リスク・課題
- 高い製造コストと材料コスト
- 代替複合材料との競合
- 成長促進要因
- 成長可能性分析
- ポーター分析
- PESTEL分析
第4章 競合情勢
- イントロダクション
- 企業市場シェア分析
- 競合のポジショニングマトリックス
- 戦略展望マトリックス
第5章 市場規模・予測:マトリックス材料別、2021年~2034年
- 主要動向
- 酸化物系CMC
- 非酸化物系CMC
第6章 市場規模・予測:繊維タイプ別、2021年~2034年
- 主要動向
- 連続繊維
- 非連続/SiCウィスカー
第7章 市場規模・予測:最終用途別、2021年~2034年
- 主要動向
- 航空宇宙・防衛
- 自動車
- エネルギー・電力
- 産業用
- その他
第8章 市場規模・予測:地域別、2021年~2034年
- 主要動向
- 北米
- 米国
- カナダ
- 欧州
- 英国
- ドイツ
- フランス
- イタリア
- スペイン
- ロシア
- アジア太平洋
- 中国
- インド
- 日本
- 韓国
- オーストラリア
- ラテンアメリカ
- ブラジル
- メキシコ
- 中東・アフリカ
- 南アフリカ
- サウジアラビア
- アラブ首長国連邦
第9章 企業プロファイル
- Applied Thin Films, Inc.
- CeramTec GmbH
- COI Ceramics, Inc.
- CoorsTek, Inc.
- General Electric Company
- Kyocera Corporation
- Lancer Systems
- Morgan Advanced Materials
- Reinhold Industries, Inc.
- Renegade Materials Corporation
- Rolls-Royce plc
The Global Ceramic Matrix Composites Market is experiencing robust growth, reaching USD 14.4 billion in 2024, with projections to expand at a CAGR of 10% from 2025 to 2034. Ceramic matrix composites are revolutionizing industries due to their exceptional strength-to-weight ratio, superior high-temperature tolerance, and unparalleled durability. These advanced materials are indispensable in applications where performance under extreme conditions is paramount, including aerospace, defense, and energy sectors. The increasing emphasis on lightweight, high-strength alternatives to traditional metals and alloys has positioned CMCs as a critical component in the quest for greater fuel efficiency and reduced carbon emissions. Their growing adoption across a diverse range of applications underscores their importance in modern engineering and technology.
The aerospace and defense industries are at the forefront of CMC demand, relying on these materials for high-performance components such as turbine blades, exhaust systems, and structural reinforcements for aircraft and spacecraft. As global efforts to enhance fuel efficiency and achieve sustainability targets intensify, the unique properties of CMCs have made them an essential material choice. Their ability to significantly reduce weight while maintaining superior mechanical strength and thermal resistance ensures they meet the stringent requirements of cutting-edge aviation and space technologies.
| Market Scope | |
|---|---|
| Start Year | 2024 |
| Forecast Year | 2025-2034 |
| Start Value | $14.4 Billion |
| Forecast Value | $37.3 Billion |
| CAGR | 10% |
In terms of matrix materials, the CMC market is divided into oxide-based and non-oxide-based composites. Non-oxide-based CMCs dominate the market, generating USD 9.9 billion in revenue in 2024. These composites, predominantly comprising silicon carbide (SiC) and carbon, are celebrated for their remarkable mechanical intensity, thermal resistivity, and wear properties. These attributes make them particularly valuable in industries such as aerospace, automotive, and energy, where materials must endure extreme conditions without compromising performance.
The market segmentation by fiber type reveals a strong preference for continuous fiber-reinforced ceramic matrix composites (CF-CMCs), which account for 74.1% of the market share. CF-CMCs are highly sought after due to their superior strength, thermal stability, and damage tolerance. By embedding continuous fibers, either ceramic or carbon, within the ceramic matrix, these composites deliver unmatched resistance to thermal shocks and mechanical stresses. This resilience positions CF-CMCs as the material of choice for high-performance applications, including advanced propulsion systems and structural components in critical industries.
The U.S. leads the North American ceramic matrix composites market, generating USD 4.3 billion in revenue in 2024. The country's dominance stems from its robust aerospace and defense sectors, substantial R&D investments, and the presence of major manufacturers. The increasing demand for lightweight, high-strength materials across industries like aviation and energy ensures that the U.S. market remains at the forefront of innovation and adoption in CMC technology.
Table of Contents
Chapter 1 Methodology & Scope
- 1.1 Market scope & definition
- 1.2 Base estimates & calculations
- 1.3 Forecast calculation
- 1.4 Data sources
- 1.4.1 Primary
- 1.4.2 Secondary
- 1.4.2.1 Paid sources
- 1.4.2.2 Public sources
Chapter 2 Executive Summary
- 2.1 Industry synopsis, 2021-2034
Chapter 3 Industry Insights
- 3.1 Industry ecosystem analysis
- 3.1.1 Factor affecting the value chain
- 3.1.2 Profit margin analysis
- 3.1.3 Disruptions
- 3.1.4 Future outlook
- 3.1.5 Manufacturers
- 3.1.6 Distributors
- 3.2 Supplier landscape
- 3.3 Profit margin analysis
- 3.4 Key news & initiatives
- 3.5 Regulatory landscape
- 3.6 Impact forces
- 3.6.1 Growth drivers
- 3.6.1.1 High demand in aerospace and defense
- 3.6.1.2 Rising focus on lightweight automotive components
- 3.6.1.3 Growth in renewable energy applications
- 3.6.2 Industry pitfalls & challenges
- 3.6.2.1 High production and material costs
- 3.6.2.2 Competition from alternative composite materials
- 3.6.1 Growth drivers
- 3.7 Growth potential analysis
- 3.8 Porter’s analysis
- 3.9 PESTEL analysis
Chapter 4 Competitive Landscape, 2024
- 4.1 Introduction
- 4.2 Company market share analysis
- 4.3 Competitive positioning matrix
- 4.4 Strategic outlook matrix
Chapter 5 Market Size and Forecast, By Matrix Material, 2021-2034 (USD Billion) (Kilo Tons)
- 5.1 Key trends
- 5.2 Oxide-based CMCs
- 5.3 Non-oxide-based CMCs
Chapter 6 Market Size and Forecast, By Fiber Type, 2021-2034 (USD Billion) (Kilo Tons)
- 6.1 Key trends
- 6.2 continuous fiber
- 6.3 Discontinuous/SiC whisker
Chapter 7 Market Size and Forecast, By End Use, 2021-2034 (USD Billion) (Kilo Tons)
- 7.1 Key trends
- 7.2 Aerospace & defense
- 7.3 Automotive
- 7.4 Energy & power
- 7.5 Industrial
- 7.6 Others
Chapter 8 Market Size and Forecast, By Region, 2021-2034 (USD Billion) (Kilo Tons)
- 8.1 Key trends
- 8.2 North America
- 8.2.1 U.S.
- 8.2.2 Canada
- 8.3 Europe
- 8.3.1 UK
- 8.3.2 Germany
- 8.3.3 France
- 8.3.4 Italy
- 8.3.5 Spain
- 8.3.6 Russia
- 8.4 Asia Pacific
- 8.4.1 China
- 8.4.2 India
- 8.4.3 Japan
- 8.4.4 South Korea
- 8.4.5 Australia
- 8.5 Latin America
- 8.5.1 Brazil
- 8.5.2 Mexico
- 8.6 MEA
- 8.6.1 South Africa
- 8.6.2 Saudi Arabia
- 8.6.3 UAE
Chapter 9 Company Profiles
- 9.1 Applied Thin Films, Inc.
- 9.2 CeramTec GmbH
- 9.3 COI Ceramics, Inc.
- 9.4 CoorsTek, Inc.
- 9.5 General Electric Company
- 9.6 Kyocera Corporation
- 9.7 Lancer Systems
- 9.8 Morgan Advanced Materials
- 9.9 Reinhold Industries, Inc.
- 9.10 Renegade Materials Corporation
- 9.11 Rolls-Royce plc

