
|
市場調査レポート
商品コード
1741006
家庭用エネルギー管理システムの市場機会、成長促進要因、産業動向分析、2025~2034年予測Home Energy Management System Market Opportunity, Growth Drivers, Industry Trend Analysis, and Forecast 2025 - 2034 |
||||||
カスタマイズ可能
|
|||||||
| 家庭用エネルギー管理システムの市場機会、成長促進要因、産業動向分析、2025~2034年予測 |
|
出版日: 2025年04月22日
発行: Global Market Insights Inc.
ページ情報: 英文 123 Pages
納期: 2~3営業日
|

全表示
- 概要
- 目次
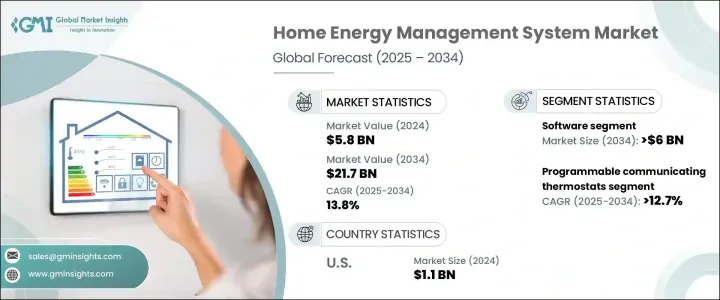
家庭用エネルギー管理システムの世界市場規模は2024年に58億米ドルとなり、スマートホーム技術の採用増加や環境持続可能性への関心の高まりを背景に、CAGR13.8%で成長し、2034年には217億米ドルに達すると予測されます。
二酸化炭素排出量削減への世界のシフト、エネルギー効率の高い技術の進歩、再生可能エネルギー源の住宅への統合など、いくつかの要因が市場拡大に拍車をかけています。IoTとAI技術の採用はHEMSの強化に重要な役割を果たしており、ユーザーは使用パターンに基づく温度設定の調整やピーク時の消費削減といった省エネアクションを自動化できます。AIを搭載したシステムは、省エネ提案をさらにパーソナライズし、システム全体の効率を向上させる。
エネルギー効率を促進する政府のプログラムや規制も、家庭用エネルギー管理ソリューションの採用を加速する上で極めて重要な役割を果たしています。世界各国の政府が提供するさまざまなインセンティブやリベートは、消費者に省エネ技術への投資を促しています。厳しいエネルギー使用規制は、野心的な気候変動目標と相まって、エネルギー消費を最適化するスマートホーム・ソリューションへの投資を消費者に促しています。
| 市場範囲 | |
|---|---|
| 開始年 | 2024 |
| 予測年 | 2025-2034 |
| 開始金額 | 58億米ドル |
| 予測金額 | 217億米ドル |
| CAGR | 13.8% |
家庭用エネルギー管理システム市場は、2024年までに58億米ドルと評価されました。光熱費の高騰と環境問題への関心の高まりが、消費者がエネルギーコストとカーボンフットプリントを削減する代替手段を求める動機となっています。サーモスタット、照明システム、電気自動車(EV)充電器などのスマートデバイスの家庭への統合が進み、HEMSの採用が加速しています。エネルギー効率に対する需要が高まり続ける中、スマートホーム技術を採用する家庭が増えています。
プログラマブル通信サーモスタット分野は、2034年までCAGR 12.7%で拡大し、大幅な成長を牽引すると予測されています。これらのサーモスタットは、プリセットスケジューリング、遠隔温度調整、リアルタイムモニタリングなどの高度な機能を備えており、エネルギー消費を大幅に削減し、光熱費を削減します。その結果、持続可能性とコスト効率を優先する消費者の間で人気が高まっています。住宅所有者が自宅の冷暖房システムをよりよく制御できるようにすることで、これらの機器はエネルギー使用を最適化し、エネルギー効率の高い住宅を目指す拡大傾向に不可欠な要素となっています。
米国家庭用エネルギー管理システム市場は2024年に11億米ドルに達し、スマートホーム技術の広範な採用により、HEMS市場の強固な基盤が形成されつつあります。スマートサーモスタット、照明制御、その他のIoT対応デバイスは、集中エネルギー管理システムにシームレスに統合され、ユーザーにエネルギー消費のリアルタイム制御を提供しています。
家庭用エネルギー管理システム世界市場の主要企業には、シーメンス、東芝、ハネウェル、シュナイダーエレクトリック、ジョンソンコントロールズなどがあります。これらの企業は、市場での存在感を高めるため、スマート技術の革新、顧客エンゲージメント戦略、戦略的パートナーシップに注力しています。また、多くの企業が持続可能なソリューションに投資し、エネルギー効率の高い住宅管理システムに対する需要の高まりに対応するため、製品ポートフォリオを拡大しています。さらに、戦略的合併、買収、提携は、市場へのリーチを拡大し、技術力を強化するための一般的な戦略です。
目次
第1章 調査手法と範囲
第2章 エグゼクティブサマリー
第3章 業界考察
- エコシステム分析
- トランプ政権の関税分析
- 貿易への影響
- 貿易量の混乱
- 報復措置
- 業界への影響
- 供給側の影響(原材料)
- 主要原材料の価格変動
- サプライチェーンの再構築
- 生産コストへの影響
- 需要側の影響(販売価格)
- 最終市場への価格伝達
- 市場シェアの動向
- 消費者の反応パターン
- 供給側の影響(原材料)
- 影響を受ける主要企業
- 戦略的な業界対応
- サプライチェーンの再構成
- 価格設定と製品戦略
- 政策関与
- 展望と今後の検討事項
- 貿易への影響
- 規制情勢
- 業界への影響要因
- 促進要因
- 業界の潜在的リスク&課題
- 成長可能性分析
- ポーター分析
- PESTEL分析
第4章 競合情勢
- 戦略的ダッシュボード
- イノベーションと持続可能性の情勢
第5章 市場規模・予測:コンポーネント別、2021-2034
- 主要動向
- 計測機器およびフィールド機器
- ハードウェア
- ソフトウェア
- ネットワークデバイス
- 制御システム
- センサー
- その他
第6章 市場規模・予測:製品別、2021-2034
- 主要動向
- 照明コントロール
- 自己監視システムとサービス
- プログラム可能な通信サーモスタット
- 高度な中央制御装置
- インテリジェント HVACコントローラー
第7章 市場規模・予測:地域別、2021-2034
- 主要動向
- 北米
- 米国
- カナダ
- メキシコ
- 欧州
- 英国
- フランス
- ドイツ
- イタリア
- ロシア
- スペイン
- アジア太平洋地域
- 中国
- オーストラリア
- インド
- 日本
- 韓国
- 中東・アフリカ
- サウジアラビア
- アラブ首長国連邦
- トルコ
- 南アフリカ
- エジプト
- ラテンアメリカ
- ブラジル
- アルゼンチン
第8章 企業プロファイル
- ABB
- Eaton
- Emerson Electric
- ENGIE Impact
- General Electric
- GridPoint
- Honeywell
- Johnson Controls
- Kenmore
- Optimum Energy
- Schneider Electric
- Siemens
- Telkonet
- Toshiba
The Global Home Energy Management System Market was valued at USD 5.8 billion in 2024 and is estimated to grow at a CAGR of 13.8% to reach USD 21.7 billion by 2034 driven by the increasing adoption of smart home technologies and growing environmental sustainability concerns. Several factors, such as the global shift toward reducing carbon emissions, advancements in energy-efficient technologies, and the integration of renewable energy sources into homes, are fueling market expansion. The adoption of IoT and AI technologies has played a significant role in enhancing HEMS, enabling users to automate energy-saving actions such as adjusting temperature settings based on usage patterns and reducing consumption during peak hours. AI-powered systems further personalize energy-saving recommendations, improving the overall system efficiency.
Government programs and regulations promoting energy efficiency have also played a pivotal role in accelerating the adoption of home energy management solutions. Various incentives and rebates offered by governments worldwide encourage consumers to invest in energy-saving technologies. Stringent energy usage regulations, coupled with ambitious climate targets, are pushing consumers toward investing in smart home solutions that optimize energy consumption.
| Market Scope | |
|---|---|
| Start Year | 2024 |
| Forecast Year | 2025-2034 |
| Start Value | $5.8 Billion |
| Forecast Value | $21.7 Billion |
| CAGR | 13.8% |
The home energy management system market was valued at USD 5.8 billion by 2024. Rising utility prices and increasing environmental concerns motivate consumers to seek alternatives that reduce energy costs and carbon footprint. The growing integration of smart devices such as thermostats, lighting systems, and electric vehicle (EV) chargers into homes accelerates the adoption of HEMS. As the demand for energy efficiency continues to rise, more households are adopting smart home technologies.
The programmable communicating thermostat segment is anticipated to drive substantial growth, expanding at a CAGR of 12.7% through 2034. These thermostats are designed with advanced features like preset scheduling, remote temperature adjustments, and real-time monitoring, which significantly reduce energy consumption and lower utility bills. As a result, they are becoming increasingly popular among consumers who are prioritizing sustainability and cost efficiency. By allowing homeowners to have better control over their home's heating and cooling systems, these devices optimize energy use, making them an integral part of the growing trend toward energy-efficient homes.
United States Home Energy Management System Market reached USD 1.1 billion in 2024 and is poised for continued growth due to the widespread adoption of smart home technologies is creating a solid foundation for the HEMS market as consumers increasingly seek interconnected solutions to manage their home's energy use more effectively. Smart thermostats, lighting controls, and other IoT-enabled devices are seamlessly integrated into centralized energy management systems, offering users real-time control over their energy consumption.
Major companies in the Global Home Energy Management System Market include Siemens, Toshiba, Honeywell, Schneider Electric, and Johnson Controls. These companies are focusing on innovations in smart technologies, customer engagement strategies, and strategic partnerships to strengthen their presence in the market. Many companies are also investing in sustainable solutions and expanding their product portfolios to meet the growing demand for energy-efficient home management systems. Additionally, strategic mergers, acquisitions, and collaborations are common strategies to expand market reach and enhance technological capabilities.
Table of Contents
Chapter 1 Methodology & Scope
- 1.1 Market definitions
- 1.2 Base estimates & calculations
- 1.3 Forecast calculation
- 1.4 Data sources
- 1.4.1 Primary
- 1.4.2 Secondary
- 1.4.2.1 Paid
- 1.4.2.2 Public
Chapter 2 Executive Summary
- 2.1 Industry synopsis, 2021 – 2034
Chapter 3 Industry Insights
- 3.1 Industry ecosystem analysis
- 3.2 Trump administration tariff analysis
- 3.2.1 Impact on trade
- 3.2.1.1 Trade volume disruptions
- 3.2.1.2 Retaliatory measures
- 3.2.2 Impact on the industry
- 3.2.2.1 Supply-side impact (raw materials)
- 3.2.2.1.1 Price volatility in key materials
- 3.2.2.1.2 Supply chain restructuring
- 3.2.2.1.3 Production cost implications
- 3.2.2.2 Demand-side impact (selling price)
- 3.2.2.2.1 Price transmission to end markets
- 3.2.2.2.2 Market share dynamics
- 3.2.2.2.3 Consumer response patterns
- 3.2.2.1 Supply-side impact (raw materials)
- 3.2.3 Key companies impacted
- 3.2.4 Strategic industry responses
- 3.2.4.1 Supply chain reconfiguration
- 3.2.4.2 Pricing and product strategies
- 3.2.4.3 Policy engagement
- 3.2.5 Outlook and future considerations
- 3.2.1 Impact on trade
- 3.3 Regulatory landscape
- 3.4 Industry impact forces
- 3.4.1 Growth drivers
- 3.4.2 Industry pitfalls & challenges
- 3.5 Growth potential analysis
- 3.6 Porter's analysis
- 3.6.1 Bargaining power of suppliers
- 3.6.2 Bargaining power of buyers
- 3.6.3 Threat of new entrants
- 3.6.4 Threat of substitutes
- 3.7 PESTEL analysis
Chapter 4 Competitive Landscape, 2024
- 4.1 Strategic dashboard
- 4.2 Innovation & sustainability landscape
Chapter 5 Market Size and Forecast, By Component, 2021 - 2034 (USD Million)
- 5.1 Key trends
- 5.2 Metering & field equipment
- 5.3 Hardware
- 5.4 Software
- 5.5 Networking device
- 5.6 Control systems
- 5.7 Sensors
- 5.8 Others
Chapter 6 Market Size and Forecast, By Product, 2021 - 2034 (USD Million)
- 6.1 Key trends
- 6.2 Lighting controls
- 6.3 Self-monitoring systems & services
- 6.4 Programmable communicating thermostats
- 6.5 Advanced central controllers
- 6.6 Intelligent HVAC controllers
Chapter 7 Market Size and Forecast, By Region, 2021 - 2034 (USD Million)
- 7.1 Key trends
- 7.2 North America
- 7.2.1 U.S.
- 7.2.2 Canada
- 7.2.3 Mexico
- 7.3 Europe
- 7.3.1 UK
- 7.3.2 France
- 7.3.3 Germany
- 7.3.4 Italy
- 7.3.5 Russia
- 7.3.6 Spain
- 7.4 Asia Pacific
- 7.4.1 China
- 7.4.2 Australia
- 7.4.3 India
- 7.4.4 Japan
- 7.4.5 South Korea
- 7.5 Middle East & Africa
- 7.5.1 Saudi Arabia
- 7.5.2 UAE
- 7.5.3 Turkey
- 7.5.4 South Africa
- 7.5.5 Egypt
- 7.6 Latin America
- 7.6.1 Brazil
- 7.6.2 Argentina
Chapter 8 Company Profiles
- 8.1 ABB
- 8.2 Eaton
- 8.3 Emerson Electric
- 8.4 ENGIE Impact
- 8.5 General Electric
- 8.6 GridPoint
- 8.7 Honeywell
- 8.8 Johnson Controls
- 8.9 Kenmore
- 8.10 Optimum Energy
- 8.11 Schneider Electric
- 8.12 Siemens
- 8.13 Telkonet
- 8.14 Toshiba
