
|
市場調査レポート
商品コード
1721515
配電自動化市場の市場機会、成長促進要因、産業動向分析、2025~2034年予測Distribution Automation Market Opportunity, Growth Drivers, Industry Trend Analysis, and Forecast 2025 - 2034 |
||||||
カスタマイズ可能
|
|||||||
| 配電自動化市場の市場機会、成長促進要因、産業動向分析、2025~2034年予測 |
|
出版日: 2025年04月02日
発行: Global Market Insights Inc.
ページ情報: 英文 128 Pages
納期: 2~3営業日
|

全表示
- 概要
- 目次
配電自動化の世界市場規模は、2024年に174億米ドルとなり、CAGR 11.4%で成長し、2034年には500億米ドルに達すると予測されています。
世界の電力会社が送電網の近代化のために先進技術を導入しているため、市場は著しい勢いを見せています。エネルギー需要の増加、再生可能エネルギー源の統合の増加、送電網の信頼性と回復力に関する懸念の高まりにより、公共部門と民間部門の両方が配電自動化ソリューションを優先するようになっています。政府や公益事業者は、停電を減らし、エネルギー効率を高め、持続可能な電力インフラをサポートするために、オートメーションへの投資を急速に進めています。
電気インフラが老朽化し、都市部でも農村部でも電化が急速に進む中、配電網の自動化は、よりスマートなエネルギーシステムへの移行における重要な柱として浮上しています。自動化はまた、リアルタイムの電力消費データの処理と資産管理能力の向上にも不可欠であり、ユーティリティ企業が障害に迅速に対応し、エネルギー供給のバランスをより効果的にとることを可能にしています。デジタルトランスフォーメーションがエネルギーインフラの形を変え続ける中、配電自動化システムは、信頼性、安全性、適応性に優れたエネルギーグリッドを構築するための世界の取り組みにおいて不可欠なものとなっています。
| 市場範囲 | |
|---|---|
| 開始年 | 2024 |
| 予測年 | 2025-2034 |
| 開始金額 | 174億米ドル |
| 予測金額 | 500億米ドル |
| CAGR | 11.4% |
送電網の近代化、スマートグリッドの導入、信頼性の高い配電へのニーズの高まりが、この市場の主な促進要因となっています。公益事業者は、効率を高め、運用コストを削減し、より安定した信頼性の高い電力供給を消費者に提供するために、自動化ソリューションにますます注目しています。配電自動化は、グリッド性能の向上と再生可能エネルギー源の統合を目指し、よりスマートで強靭なインフラへの大きな推進の一環として、世界的に牽引力を増しています。
有線通信は依然として市場の主流であり、2034年までに265億米ドルの成長が予測されています。安定性、低遅延、干渉への耐性で知られる光ファイバーとイーサネット・ネットワークは、高信頼性アプリケーションで引き続き役立っています。公益事業会社は、SCADAシステムや送電網のリアルタイム監視などの機能で有線ネットワークに大きく依存しており、重要な業務が円滑に行われるようにしています。
スマートリクローザ、自動スイッチ、故障インジケータを含むフィールドデバイス分野は、2024年に43%のシェアを占めました。これらのデバイスは、IoTやエッジコンピューティングと統合して電力網の信頼性と効率を向上させるからです。これらのデバイスは、電力網の機能性と信頼性を向上させるために不可欠です。モノのインターネット(IoT)技術やエッジコンピューティングと統合することで、これらのデバイスはリアルタイムの監視、予知保全、故障検出機能を強化します。スマート・リクローザーは、故障を自動的に検知し、一時的な停電の後に電力を復旧させ、停電時間を大幅に短縮するために特に重要です。
米国配電自動化2024年の市場規模は44億米ドル。成長の背景には、送電網システムの進歩、再生可能エネルギー源の採用、革新的技術の導入の増加があります。エネルギー効率の改善を目的とした連邦および州の政策は、監視と制御を強化するための5Gとエッジネットワークの統合とともに、この市場の拡大をさらに促進しています。人工知能とIoTベースのシステムの採用により、ユーティリティ企業はオペレーションの最適化、ダウンタイムの削減、グリッド回復力の強化を実現しています。
世界配電自動化市場の主要企業には、ランディス・ギア社、ABB社、シスコ社、イートン社、GE社、G&Wエレクトリック社、S&Cエレクトリック社、ハベル社、イトロン社、ノバテック社、シュナイダーエレクトリック社、日立製作所、シュバイツァー・エンジニアリング・ラボラトリーズ社、シーメンス社、東芝エネルギーシステム&ソリューション社、トリリアント・ホールディングス社、ザイレム社などがあります。配電自動化市場の各社は存在感を高めるため、技術革新と製品開発に注力しています。その多くは、AIベースの自動化およびIoTソリューションに投資し、グリッド管理の改善とエネルギー配給の最適化を図っています。ユーティリティ企業やエネルギー・プロバイダーとの提携も重要な戦略であり、企業は特定のニーズに合わせてソリューションをカスタマイズし、事業範囲を拡大することができます。さらに、企業は提供するサービスを多様化し、新たな地域市場に参入するために、合併や買収を模索しています。サイバーセキュリティ・ソリューションへの投資拡大も、送電網のセキュリティやデータ・プライバシーに関する懸念の高まりに対応するための重要な戦略です。
目次
第1章 調査手法と範囲
第2章 エグゼクティブサマリー
第3章 業界考察
- エコシステム分析
- 規制情勢
- 業界への影響要因
- 促進要因
- 業界の潜在的リスク&課題
- 成長可能性分析
- ポーターの分析
- 供給企業の交渉力
- 買い手の交渉力
- 新規参入業者の脅威
- 代替品の脅威
- PESTEL分析
第4章 競合情勢
- 戦略的ダッシュボード
- イノベーションと持続可能性の情勢
第5章 市場規模・予測:コミュニケーションで、2021-2034
- 主要動向
- 有線
- 無線
第6章 市場規模・予測:コンポーネント別、2021-2034
- 主要動向
- ソフトウェア
- フィールドデバイス
- サービス
第7章 市場規模・予測:用途別、2021-2034
- 主要動向
- 公益事業
- 民間ユーティリティ
第8章 市場規模・予測:地域別、2021-2034
- 主要動向
- 北米
- 米国
- カナダ
- メキシコ
- 欧州
- 英国
- ドイツ
- フランス
- スペイン
- イタリア
- アジア太平洋地域
- 中国
- オーストラリア
- 日本
- 韓国
- インド
- 中東・アフリカ
- サウジアラビア
- アラブ首長国連邦
- 南アフリカ
- ラテンアメリカ
- ブラジル
- チリ
第9章 企業プロファイル
- ABB
- Cisco
- Eaton
- GE
- G&W Electric
- Hitachi
- Hubbell
- Itron
- Landis+Gyr
- NovaTech
- Schneider Electric
- Schweitzer Engineering Laboratories
- S&C Electric Company
- Siemens
- Toshiba Energy Systems &Solutions
- Trilliant Holdings
- Xylem
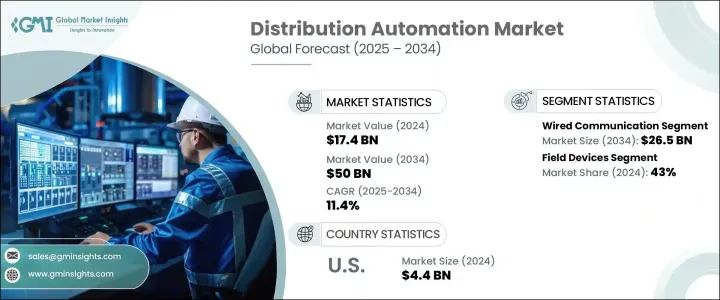
The Global Distribution Automation Market was valued at USD 17.4 billion in 2024 and is estimated to grow at a CAGR of 11.4% to reach USD 50 billion by 2034. The market is witnessing remarkable momentum as utilities worldwide embrace advanced technologies to modernize power grids. Rising energy demands, increasing integration of renewable energy sources, and heightened concerns around grid reliability and resilience are pushing both public and private sector players to prioritize distribution automation solutions. Governments and utility providers are rapidly investing in automation to reduce power outages, enhance energy efficiency, and support a sustainable electricity infrastructure.
With aging electrical infrastructure and surging electrification trends across urban and rural areas alike, automated distribution networks are emerging as a critical pillar in the transition toward smarter energy systems. Automation is also proving essential in handling real-time power consumption data and improving asset management capabilities, enabling utilities to respond faster to faults and balance energy supply more effectively. As digital transformation continues to reshape energy infrastructure, distribution automation systems are becoming indispensable in the global effort to build a reliable, secure, and adaptive energy grid.
| Market Scope | |
|---|---|
| Start Year | 2024 |
| Forecast Year | 2025-2034 |
| Start Value | $17.4 Billion |
| Forecast Value | $50 Billion |
| CAGR | 11.4% |
The growing demand for grid modernization, the implementation of smart grids, and the need for reliable power distribution are the primary drivers of this market. Utilities are increasingly turning to automation solutions to enhance efficiency, reduce operational costs, and provide a more stable and reliable power supply to consumers. Distribution automation is gaining traction globally as part of the larger push toward smarter, more resilient infrastructure, aiming to improve grid performance and support the integration of renewable energy sources.
Wired communication remains the dominant segment within the market and is projected to grow by USD 26.5 billion by 2034. Fiber optics and Ethernet networks, known for their stability, low latency, and resistance to interference, continue to help in high-reliability applications. Utility companies rely heavily on wired networks for functions like SCADA systems and real-time monitoring of the grid, ensuring that critical operations run smoothly.
The field devices segment, which includes smart reclosers, automated switches, and fault indicators, accounted for a 43% share in 2024, as these devices integrate with IoT and edge computing to improve the reliability and efficiency of power grids. These devices are essential for improving the functionality and reliability of power grids. By integrating with Internet of Things (IoT) technology and edge computing, these devices enhance real-time monitoring, predictive maintenance, and fault detection capabilities. Smart reclosers are particularly important for automatically detecting faults and restoring power after temporary disruptions, significantly reducing the duration of outages.
U.S. Distribution Automation Market generated USD 4.4 billion in 2024. The growth is attributed to advancements in grid systems, the adoption of renewable energy sources, and the increasing deployment of innovative technologies. Federal and state policies aimed at improving energy efficiency, along with the integration of 5G and edge networks for enhanced monitoring and control, are further driving the expansion of this market. The adoption of artificial intelligence and IoT-based systems is enabling utilities to optimize operations, reduce downtime, and enhance grid resilience.
Key players in the Global Distribution Automation Market include Landis+Gyr, ABB, Cisco, Eaton, GE, G&W Electric, S&C Electric Company, Hubbell, Itron, NovaTech, Schneider Electric, Hitachi, Schweitzer Engineering Laboratories, Siemens, Toshiba Energy Systems & Solutions, Trilliant Holdings, and Xylem. To strengthen their presence, companies in the distribution automation market are focusing on technological innovation and product development. Many are investing in AI-based automation and IoT solutions to improve grid management and optimize energy distribution. Partnerships with utilities and energy providers are also a significant strategy, allowing companies to tailor solutions to specific needs and expand their reach. Additionally, companies are exploring mergers and acquisitions to diversify their offerings and enter new regional markets. Increased investment in cybersecurity solutions is another key strategy to address the growing concerns related to grid security and data privacy.
Table of Contents
Chapter 1 Methodology & Scope
- 1.1 Market definitions
- 1.2 Base estimates & calculations
- 1.3 Forecast calculation
- 1.4 Data sources
- 1.4.1 Primary
- 1.4.2 Secondary
- 1.4.2.1 Paid
- 1.4.2.2 Public
Chapter 2 Executive Summary
- 2.1 Industry synopsis, 2021 - 2034
Chapter 3 Industry Insights
- 3.1 Industry ecosystem analysis
- 3.2 Regulatory landscape
- 3.3 Industry impact forces
- 3.3.1 Growth drivers
- 3.3.2 Industry pitfalls & challenges
- 3.4 Growth potential analysis
- 3.5 Porter's analysis
- 3.5.1 Bargaining power of suppliers
- 3.5.2 Bargaining power of buyers
- 3.5.3 Threat of new entrants
- 3.5.4 Threat of substitutes
- 3.6 PESTEL analysis
Chapter 4 Competitive landscape, 2024
- 4.1 Strategic dashboard
- 4.2 Innovation & sustainability landscape
Chapter 5 Market Size and Forecast, By Communication, 2021 - 2034 (USD Million)
- 5.1 Key trends
- 5.2 Wired
- 5.3 Wireless
Chapter 6 Market Size and Forecast, By Components, 2021 - 2034 (USD Million)
- 6.1 Key trends
- 6.2 Software
- 6.3 Field devices
- 6.4 Services
Chapter 7 Market Size and Forecast, By Application, 2021 - 2034 (USD Million)
- 7.1 Key trends
- 7.2 Public utility
- 7.3 Private utility
Chapter 8 Market Size and Forecast, By Region, 2021 - 2034 (USD Million)
- 8.1 Key trends
- 8.2 North America
- 8.2.1 U.S.
- 8.2.2 Canada
- 8.2.3 Mexico
- 8.3 Europe
- 8.3.1 UK
- 8.3.2 Germany
- 8.3.3 France
- 8.3.4 Spain
- 8.3.5 Italy
- 8.4 Asia Pacific
- 8.4.1 China
- 8.4.2 Australia
- 8.4.3 Japan
- 8.4.4 South Korea
- 8.4.5 India
- 8.5 Middle East & Africa
- 8.5.1 Saudi Arabia
- 8.5.2 UAE
- 8.5.3 South Africa
- 8.6 Latin America
- 8.6.1 Brazil
- 8.6.2 Chile
Chapter 9 Company Profiles
- 9.1 ABB
- 9.2 Cisco
- 9.3 Eaton
- 9.4 GE
- 9.5 G&W Electric
- 9.6 Hitachi
- 9.7 Hubbell
- 9.8 Itron
- 9.9 Landis+Gyr
- 9.10 NovaTech
- 9.11 Schneider Electric
- 9.12 Schweitzer Engineering Laboratories
- 9.13 S&C Electric Company
- 9.14 Siemens
- 9.15 Toshiba Energy Systems & Solutions
- 9.16 Trilliant Holdings
- 9.17 Xylem

