
|
市場調査レポート
商品コード
1666703
コンタクタの市場機会、成長促進要因、産業動向分析、2025年~2034年予測Contactor Market Opportunity, Growth Drivers, Industry Trend Analysis, and Forecast 2025 - 2034 |
||||||
カスタマイズ可能
|
|||||||
| コンタクタの市場機会、成長促進要因、産業動向分析、2025年~2034年予測 |
|
出版日: 2024年12月20日
発行: Global Market Insights Inc.
ページ情報: 英文 120 Pages
納期: 2~3営業日
|

全表示
- 概要
- 目次
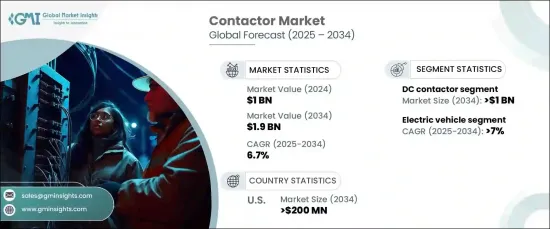
世界のコンタクタ市場は、2024年に10億米ドルとなり、2025年から2034年までのCAGRが6.7%と予測され、大幅な成長が見込まれています。
この成長の原動力は、産業、商業、住宅の各分野で自動化の導入が増加していることです。電気回路の制御とスイッチングに不可欠な部品であるコンタクタは、特にモーター、再生可能エネルギーシステム、HVACシステム、照明などの用途で需要が増加しています。エネルギー効率の高いソリューションとスマート技術への移行に伴い、メーカーは信頼性、性能、インテリジェント制御システムとの互換性を強化した高度なコンタクタの設計に注力しています。この市場の成長は、エネルギー効率の高いシステムの開拓だけでなく、シームレスな統合のために高信頼性と高耐久性のコンタクタを必要とするスマートホームや産業技術の推進によっても支えられています。
よりエネルギー効率の高い持続可能なソリューションへの需要は、コンタクタ市場の技術革新の主要な促進要因であり続けています。産業オートメーション、再生可能エネルギー発電プロジェクト、電気自動車(EV)の台頭により、企業は厳しい性能と安全基準を満たす次世代コンタクタを開発しています。産業界が操業効率を高めながらエネルギー消費量の削減に努める中、コンタクタは電気回路を効果的かつ安全に機能させる上で極めて重要な役割を果たしています。市場開拓の動向は、環境負荷の低減を重視する傾向が強まっていることを示しており、その結果、エネルギー損失を最小限に抑え、発熱を低減し、全体的なコスト削減イニシアチブをサポートするコンタクタの開発が進んでいます。これらの要因は、今後10年間の市場力学に影響を与え続けると考えられています。
| 市場範囲 | |
|---|---|
| 開始年 | 2024年 |
| 予測年 | 2025年~2034年 |
| 開始金額 | 10億米ドル |
| 予測金額 | 19億米ドル |
| CAGR | 6.7% |
また、DCコンタクタ市場は、様々な産業における電気システムの精度と信頼性へのニーズの高まりにより、2034年までに10億米ドルに達すると予想されています。DCコンタクタはモーター制御、ロボット工学、配電に不可欠で、自動化プロセスの効率維持に不可欠な精密制御を提供します。安全性とエネルギー効率が産業用アプリケーションの最優先事項であり続ける中、DCコンタクタは、省エネルギーソリューションと運用コスト削減の需要に応えるべく進化しています。設計の進歩に伴い、これらのコンタクタは信頼性の向上、エネルギー消費の低減、熱管理の改善を特徴とし、よりスマートで環境に優しい技術への世界のシフトにおける重要なコンポーネントとして位置付けられています。
電気自動車市場も重要な成長分野であり、2034年までCAGR7%で拡大すると予測されています。コンタクタは、電気自動車内の電力を管理し、さまざまな車両部品の安全で効率的な動作を保証するために不可欠です。環境問題への関心と政府の政策が電気自動車の採用を奨励し続けるにつれて、高品質のコンタクタの需要が急増すると思われます。EVの走行台数の増加によるこの市場シフトでは、エネルギー効率の高い運転をサポートしながら、高い電気負荷を管理できる堅牢なコンタクタが必要になります。
米国では、コンタクタ市場は2034年までに2億米ドルを創出する見込みです。この成長は、産業オートメーション、再生可能エネルギープロジェクト、拡大する電気自動車分野の継続的な進歩によって促進されます。産業界がエネルギー効率と持続可能性を優先する中、コンタクタはモーターシステム、ロボット工学、エネルギー分配のためのより良い電力管理と制御を提供するように設計されています。動作性能の向上、耐久性、消費電力の削減に対する需要の高まりは、この分野の技術革新を推進し続け、コンタクタが産業オートメーションとグリーンテクノロジーの将来において不可欠な役割を果たすことを確固たるものにすると考えられています。
目次
第1章 調査手法と調査範囲
- 市場範囲と定義
- 市場推計・予測パラメータ
- 予測計算
- データソース
- 一次
- 二次
- 有料
- 公的
第2章 エグゼクティブサマリー
第3章 業界洞察
- 業界エコシステム分析
- 規制状況
- 業界への影響要因
- 成長促進要因
- 業界の潜在的リスク・課題
- 成長ポテンシャル分析
- ポーター分析
- 供給企業の交渉力
- 買い手の交渉力
- 新規参入業者の脅威
- 代替品の脅威
- PESTEL分析
第4章 競合情勢
- イントロダクション
- 戦略的展望
- イノベーションと持続可能性の展望
第5章 市場規模・予測:製品別、2021年~2034年
- 主要動向
- DCコンタクタ
- ACコンタクタ
第6章 市場規模・予測:最終用途別、2021年~2034年
- 主要動向
- 電気自動車
- 航空宇宙・防衛
- 産業機械
- 再生可能エネルギー
- その他
第7章 市場規模・予測:地域別、2021年~2034年
- 主要動向
- 北米
- 米国
- カナダ
- 欧州
- ドイツ
- フランス
- 英国
- スペイン
- イタリア
- アジア太平洋
- 中国
- インド
- 日本
- 韓国
- オーストラリア
- 中東・アフリカ
- サウジアラビア
- アラブ首長国連邦
- 南アフリカ
- ラテンアメリカ
- ブラジル
- アルゼンチン
第8章 企業プロファイル
- ABB
- Carlo Gavazzi
- Curtiss-Wright
- Eaton
- Fuji Electric
- Geya
- Kunshan GuoLi Electronic Technology
- KA Schmersal
- Lovato Electric
- LS Electric
- Mitsubishi Electric
- Rockwell Automation
- Schaltbau
- Schneider Electric
- Sensata Technologies
- Siemens
- TE Connectivity
- Toshiba
The Global Contactor Market, valued at USD 1 billion in 2024, is expected to witness substantial growth, with a projected CAGR of 6.7% from 2025 to 2034. The driving force behind this growth is the rising adoption of automation across industrial, commercial, and residential sectors. As essential components for controlling and switching electrical circuits, contactors are experiencing increasing demand, particularly for their applications in motors, renewable energy systems, HVAC systems, and lighting. With the transition toward energy-efficient solutions and smart technologies, manufacturers are focusing on designing advanced contactors that provide enhanced reliability, performance, and compatibility with intelligent control systems. This market growth is not only supported by the development of energy-efficient systems but also by the push for smart home and industrial technologies, which require highly reliable and durable contactors for seamless integration.
The demand for more energy-efficient and sustainable solutions continues to be a major driver for innovation in the contactor market. With the rise of industrial automation, renewable energy projects, and electric vehicles (EVs), companies are creating next-generation contactors that meet stringent performance and safety standards. As industries strive to lower energy consumption while increasing operational efficiency, contactors play a pivotal role in ensuring electrical circuits function effectively and safely. Market trends indicate a growing emphasis on reducing environmental impact, resulting in the development of contactors that minimize energy losses, reduce heat generation, and support overall cost-saving initiatives. These factors will continue to influence market dynamics over the coming decade.
| Market Scope | |
|---|---|
| Start Year | 2024 |
| Forecast Year | 2025-2034 |
| Start Value | $1 Billion |
| Forecast Value | $1.9 Billion |
| CAGR | 6.7% |
In addition, the DC contactor market is expected to reach USD 1 billion by 2034, driven by the growing need for precision and reliability in electrical systems across various industries. DC contactors are crucial for motor control, robotics, and power distribution, offering precise control that is essential for maintaining efficiency in automated processes. As safety and energy efficiency remain top priorities for industrial applications, DC contactors are evolving to meet the demand for energy-saving solutions and reduced operational costs. With advancements in design, these contactors now feature improved reliability, lower energy consumption, and better heat management, positioning them as a key component in the global shift toward smarter, greener technologies.
The electric vehicle market is another significant growth area, projected to expand at a CAGR of 7% through 2034. Contactors are vital for managing electrical power within EVs, ensuring the safe and efficient operation of various vehicle components. As environmental concerns and government policies continue to encourage the adoption of electric vehicles, the demand for high-quality contactors will surge. This market shift, driven by a rising number of EVs on the road, will require robust contactors capable of managing high electrical loads while supporting energy-efficient driving experiences.
In the U.S., the contactor market is poised to generate USD 200 million by 2034. This growth is fueled by ongoing advancements in industrial automation, renewable energy projects, and the expanding electric vehicle sector. As industries prioritize energy efficiency and sustainability, contactors are being designed to provide better power management and control for motor systems, robotics, and energy distribution. The increasing demand for improved operational performance, durability, and reduced power consumption will continue to drive innovations in the sector, solidifying contactors' essential role in the future of industrial automation and green technologies.
Table of Contents
Chapter 1 Methodology & Scope
- 1.1 Market scope & definitions
- 1.2 Market estimates & forecast parameters
- 1.3 Forecast calculation
- 1.4 Data sources
- 1.4.1 Primary
- 1.4.2 Secondary
- 1.4.2.1 Paid
- 1.4.2.2 Public
Chapter 2 Executive Summary
- 2.1 Industry synopsis, 2021 - 2034
Chapter 3 Industry Insights
- 3.1 Industry ecosystem analysis
- 3.2 Regulatory landscape
- 3.3 Industry impact forces
- 3.3.1 Growth drivers
- 3.3.2 Industry pitfalls & challenges
- 3.4 Growth potential analysis
- 3.5 Porter's analysis
- 3.5.1 Bargaining power of suppliers
- 3.5.2 Bargaining power of buyers
- 3.5.3 Threat of new entrants
- 3.5.4 Threat of substitutes
- 3.6 PESTEL analysis
Chapter 4 Competitive Landscape, 2024
- 4.1 Introduction
- 4.2 Strategic outlook
- 4.3 Innovation & sustainability landscape
Chapter 5 Market Size and Forecast, By Product, 2021 – 2034 (USD Billion)
- 5.1 Key trends
- 5.2 DC contactor
- 5.3 AC contactor
Chapter 6 Market Size and Forecast, By End Use, 2021 – 2034 (USD Billion)
- 6.1 Key trends
- 6.2 Electric vehicles
- 6.3 Aerospace & defense
- 6.4 Industrial machinery
- 6.5 Renewable energy
- 6.6 Others
Chapter 7 Market Size and Forecast, By Region, 2021 – 2034 (USD Billion)
- 7.1 Key trends
- 7.2 North America
- 7.2.1 U.S.
- 7.2.2 Canada
- 7.3 Europe
- 7.3.1 Germany
- 7.3.2 France
- 7.3.3 UK
- 7.3.4 Spain
- 7.3.5 Italy
- 7.4 Asia Pacific
- 7.4.1 China
- 7.4.2 India
- 7.4.3 Japan
- 7.4.4 South Korea
- 7.4.5 Australia
- 7.5 Middle East & Africa
- 7.5.1 Saudi Arabia
- 7.5.2 UAE
- 7.5.3 South Africa
- 7.6 Latin America
- 7.6.1 Brazil
- 7.6.2 Argentina
Chapter 8 Company Profiles
- 8.1 ABB
- 8.2 Carlo Gavazzi
- 8.3 Curtiss-Wright
- 8.4 Eaton
- 8.5 Fuji Electric
- 8.6 Geya
- 8.7 Kunshan GuoLi Electronic Technology
- 8.8 KA Schmersal
- 8.9 Lovato Electric
- 8.10 LS Electric
- 8.11 Mitsubishi Electric
- 8.12 Rockwell Automation
- 8.13 Schaltbau
- 8.14 Schneider Electric
- 8.15 Sensata Technologies
- 8.16 Siemens
- 8.17 TE Connectivity
- 8.18 Toshiba

