
|
市場調査レポート
商品コード
1844347
酢の市場機会、成長促進要因、産業動向分析、2025年~2034年の予測Vinegar Market Opportunity, Growth Drivers, Industry Trend Analysis, and Forecast 2025 - 2034 |
||||||
カスタマイズ可能
|
|||||||
| 酢の市場機会、成長促進要因、産業動向分析、2025年~2034年の予測 |
|
出版日: 2025年09月26日
発行: Global Market Insights Inc.
ページ情報: 英文 292 Pages
納期: 2~3営業日
|

概要
酢の世界市場規模は2024年に117億米ドルとなり、CAGR 3.8%で成長し、2034年には172億米ドルに達すると予測されています。
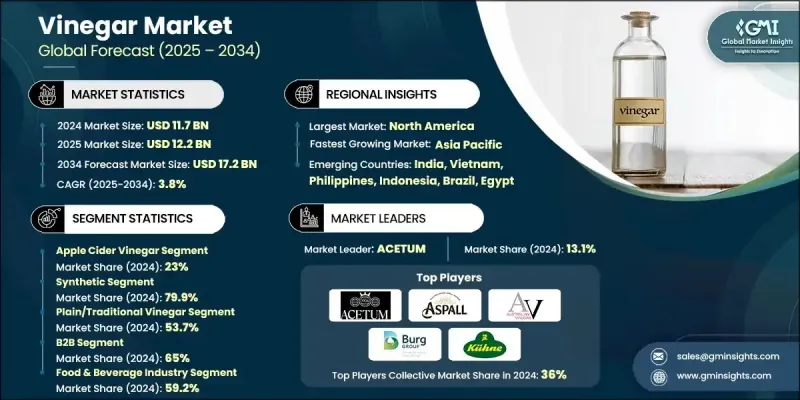
酢は、自然食品、有機食品、機能性食品に対する消費者の関心の高まりに後押しされ、カテゴリーとして進化し続けています。伝統的にエタノールを酢酸に発酵させて作られる酢は、現在では料理用、食品保存用、健康食品用、さらには工業用など、さまざまな用途に利用されています。消費者の嗜好の変化により、クリーンラベル商品や持続可能性に特に注目した特殊品種への需要が急速に高まっています。市場では、健康志向の消費者や独特の風味を求める消費者向けに、ハーブや機能性成分で風味を高めた有機ビネガーや果実入りビネガーが大きな人気を集めています。消費者がワンランク上の調理体験を求めるようになり、プレミアム製品やグルメ製品に対する需要が高まっています。この動向は、カジュアル・ダイニングから高級レストランまで、フードサービス・メニューへの採用が進むとともに、製品のイノベーションと小売チャネルにおける棚の存在感に影響を及ぼしています。酢の機能性、健康、風味を融合させる能力により、酢はキッチンだけでなく、個人のウェルネス・ルーティンの定番となっており、市場は長期的に安定した成長の見通しを持っています。
| 市場規模 | |
|---|---|
| 開始年 | 2024 |
| 予測年 | 2025-2034 |
| 市場規模 | 117億米ドル |
| 予測金額 | 172億米ドル |
| CAGR | 3.8% |
アップルサイダー酢分野は2024年に23%を占め、2034年までのCAGRは3.1%と予測されます。同分野の優位性は、自然な健康効果との強い結びつきと、ダイエット用途での多目的な使用によるものです。消費者はウェルネスに焦点を当てた成分への関心を高め続けており、食品とサプリメントの両方の形態でアップルサイダー酢の需要を煽っています。消化器系の健康や血糖値のサポートに役立つと認識されていることから、健康志向の買い物客に愛用され、天然酢の分野での主導的地位をさらに強固なものにしています。
合成酢分野の2024年のシェアは79.9%で、2034年までのCAGRは3.6%と予想されます。合成洗剤は手頃な価格で広く入手できるため、工業用や家庭用の洗浄用途で最も選ばれています。製造コストが低いため積極的な価格設定が可能で、バルクや非食品用途では高い競争力を発揮します。しかし、消費者食品分野では、天然代替物に対する認識と嗜好の高まりが、合成酢の長期的な足跡拡大を制限する可能性があります。
米国の酢市場は2024年に17億米ドルとなり、製品イノベーションと消費者導入が85%のシェアを占める。オーガニック、プロバイオティクス強化、グルメビネガーへの需要の高まりが市場浸透を加速。健康動向とクリーンラベル製品への関心が購買パターンに大きな影響を与え、無濾過アップルサイダーや風味付きバルサミコ酢のような品種の売上を牽引しています。これと並行して、米国の外食産業は、職人によるブレンドを含む高級酢の需要も高まっています。
世界の酢市場を形成する主要企業には、De Nigris、Aspall Cyder、Galletti、Shanxi Shuita酢、Mizkan America、Burg Groep、Castelo Alimentos、Carl Kuhne、The Kraft Heinz Company、Marukan酢、ACETUM、Eden Foods、Fleischmann's酢、Charbonneaux-Brabant、Australian酢などがあります。酢セクターの企業は、その地位を強化するため、オーガニック認証、クリーンラベル原料、新しいフレーバー・インフュージョンなどを通じて、製品の革新と差別化に注力しています。多くのブランドは、消費者の嗜好の変化に対応するため、ナチュラル&スペシャリティの酢ポートフォリオの拡大に投資しています。その戦略には、持続可能な生産方法を拡大することや、透明性のある表示や健康志向のブランディングを通じて酢の健康特性を促進することなどが含まれます。
よくあるご質問
目次
第1章 調査手法と範囲
第2章 エグゼクティブサマリー
第3章 業界考察
- エコシステム分析
- サプライヤーの情勢
- 利益率
- 各段階での付加価値
- バリューチェーンに影響を与える要因
- ディスラプション
- 業界への影響要因
- 促進要因
- 自然食品やオーガニック製品に対する消費者の関心の高まり
- 食品保存や料理用途での使用が増加
- 消費者の健康意識
- 落とし穴と課題:
- 原材料価格の変動
- 合成代替品との競合
- 消費者の代替調味料への移行
- 促進要因
- 成長可能性分析
- 規制情勢
- 北米
- 欧州
- アジア太平洋地域
- ラテンアメリカ
- 中東・アフリカ
- ポーターの分析
- PESTEL分析
- 価格動向
- 地域別
- 製品別
- 将来の市場動向
- テクノロジーとイノベーションの情勢
- 現在の技術動向
- 新興技術
- 特許情勢
- 貿易統計(HSコード)(注:貿易統計は主要国のみ提供されます)
- 主要輸入国
- 主要輸出国
- 持続可能性と環境側面
- 持続可能な実践
- 廃棄物削減戦略
- 生産におけるエネルギー効率
- 環境に優しい取り組み
- カーボンフットプリントの考慮
第4章 競合情勢
- イントロダクション
- 企業の市場シェア分析
- 地域別
- 北米
- 欧州
- アジア太平洋地域
- ラテンアメリカ
- 中東・アフリカ
- 地域別
- 企業マトリックス分析
- 主要市場企業の競合分析
- 競合ポジショニングマトリックス
- 主な発展
- 合併と買収
- パートナーシップとコラボレーション
- 新製品の発売
- 拡張計画
第5章 市場推計・予測:製品タイプ別、2021年~2034年
- 主要動向
- 白酢
- アップルサイダー酢
- バルサミコ酢
- 赤ワイン酢
- 米酢
- 寿司酢
- その他
第6章 市場推計・予測:供給源別、2021年~2034年
- 主要動向
- オーガニック
- 合成
第7章 市場推計・予測:フレーバー別、2021年~2034年
- 主要動向
- プレーン/トラディショナル酢
- ハーブを注入した酢
- フルーツ風味の酢
- その他
第8章 市場推計・予測:流通チャネル別、2021年~2034年
- 主要動向
- B2B
- 卸売業者およびバルクサプライヤー
- 食品メーカー
- 産業用および商業用清掃業者
- B2C
- スーパーマーケットとハイパーマーケット
- コンビニエンスストア
- オンライン小売
- その他
第9章 市場推計・予測:用途別、2021年~2034年
- 主要動向
- 食品・飲料業界
- 家庭用
- 医療・医薬品
- 化粧品・パーソナルケア
- その他
第10章 市場推計・予測:地域別、2021年~2034年
- 主要動向
- 北米
- 米国
- カナダ
- 欧州
- ドイツ
- 英国
- フランス
- スペイン
- イタリア
- その他欧州地域
- アジア太平洋地域
- 中国
- インド
- 日本
- オーストラリア
- 韓国
- その他アジア太平洋地域
- ラテンアメリカ
- ブラジル
- メキシコ
- アルゼンチン
- その他ラテンアメリカ地域
- 中東・アフリカ
- サウジアラビア
- 南アフリカ
- アラブ首長国連邦
- その他中東・アフリカ地域
第11章 企業プロファイル
- ACETUM
- Aspall Cyder
- Australian Vinegar
- Burg Groep
- Carl Kuhne
- Castelo Alimentos
- Charbonneaux-Brabant
- De Nigris
- Eden Foods
- Fleischmann's Vinegar
- Galletti
- Marukan Vinegar
- Mizkan America
- Shanxi Shuita Vinegar
- The Kraft Heinz Company

