
|
市場調査レポート
商品コード
1666636
電気自動車車載充電器市場の機会、成長促進要因、産業動向分析、2025~2034年の予測Electric Vehicle On-Board Charger Market Opportunity, Growth Drivers, Industry Trend Analysis, and Forecast 2025 - 2034 |
||||||
カスタマイズ可能
|
|||||||
| 電気自動車車載充電器市場の機会、成長促進要因、産業動向分析、2025~2034年の予測 |
|
出版日: 2024年12月27日
発行: Global Market Insights Inc.
ページ情報: 英文 120 Pages
納期: 2~3営業日
|

全表示
- 概要
- 目次
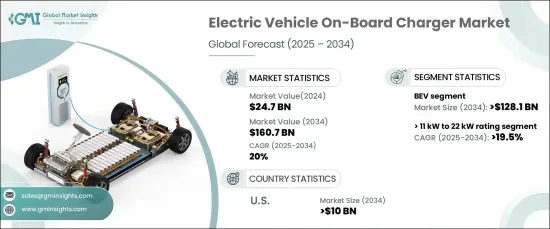
世界の電気自動車車載充電器市場は著しい成長を遂げており、2024年には247億米ドルに達し、2025年から2034年にかけてのCAGRは20%になると予測されています。
この急拡大は、環境問題への関心、クリーンエネルギーを推進する政府の政策、技術の進歩に後押しされたEVの世界の普及の急増を反映しています。世界中の消費者は、環境に優しい利点とコスト効率の高さからEVをますます受け入れており、最先端の充電ソリューションに対する大きな需要を生み出しています。充電プロセスを合理化し、ダウンタイムを削減する高性能車載充電器の開発は、この成長を促進する極めて重要な要因です。この業界は、充電プロトコルの標準化とインフラの強化に取り組んでおり、ユーザーの利便性と互換性を高め、電気モビリティへのシームレスな移行を可能にしています。
メーカーは、充電時間を大幅に短縮し、全体的な運転体験を向上させるよう設計された、より高い定格電力を持つ車載充電器を革新することで、EV需要の高まりに対応しています。より高速で効率的な充電システムへの取り組みは、消費者の期待の高まりと一致しており、EVエコシステムの発展における技術進歩の重要性を強調しています。
| 市場範囲 | |
|---|---|
| 開始年 | 2024 |
| 予測年 | 2025-2034 |
| 開始金額 | 247億米ドル |
| 予測金額 | 1,607億米ドル |
| CAGR | 20% |
バッテリー電気自動車(BEV)用車載充電器市場は、2034年までに1,281億米ドルに達すると予測されます。バッテリーに蓄積された電気エネルギーのみを動力源とするBEVは、温室効果ガスの排出削減と大気汚染対策に積極的に貢献するゼロ・エミッション・ソリューションです。充電技術とインフラの進歩に加え、持続可能な選択肢に対する消費者の関心の高まりが、BEVとその車載充電器がかつてない成長を遂げる道を開いています。公共充電ネットワークの利用可能性の向上と政府のインセンティブは、消費者のエコカーへの移行をさらに促し、市場の勢いを強めています。
定格出力11kW~22kWの車載充電器は、2034年までCAGR19.5%で成長すると予測され、より高速で強力な充電ソリューションに対する消費者の嗜好の明確な変化を反映しています。これらの充電器は、時間に敏感なユーザーの要求に応えるよう設計されており、より迅速かつ効率的なエネルギー補給を保証し、EVをより多くの人々にとって実用的な選択肢にしています。これに応えるため、各メーカーは技術革新の限界に課題し、進化するニーズに対応する高出力充電器を提供しています。
米国のEV車載充電器市場だけでも、2034年までに100億米ドルの市場規模が見込まれています。連邦および州レベルのインセンティブ、消費者の意識、双方向充電機能のような技術の進歩といった要因が、この成長の主な要因です。排出削減とクリーンな輸送の促進を目標とする政策は、EVの導入に向けた強力な基盤を築き、米国を電動モビリティへの世界的シフトにおける重要なプレーヤーとして位置づけています。
目次
第1章 調査手法と調査範囲
- 市場範囲と定義
- 市場推計・予測パラメータ
- 予測計算
- データソース
- 1次データ
- 2次データ
- 有料
- 公的
第2章 エグゼクティブサマリー
第3章 業界洞察
- エコシステム分析
- 規制状況
- 業界への影響要因
- 促進要因
- 業界の潜在的リスク&課題
- 成長可能性分析
- ポーターの分析
- 供給企業の交渉力
- 買い手の交渉力
- 新規参入業者の脅威
- 代替品の脅威
- PESTEL分析
第4章 競合情勢
- イントロダクション
- 戦略的展望
- イノベーションと持続可能性の展望
第5章 市場規模・予測:推進力別、2021年~2034年
- 主要動向
- BEV
- PHEV
- その他
第6章 市場規模・予測:定格別、2021年~2034年
- 主要動向
- 11 kW未満
- 11 kW以上~22 kW
- 22 kW以上
第7章 市場規模・予測:地域別、2021年~2034年
- 主要動向
- 北米
- 米国
- カナダ
- メキシコ
- 欧州
- ノルウェー
- ドイツ
- フランス
- オランダ
- 英国
- スウェーデン
- アジア太平洋
- 中国
- 日本
- インド
- 韓国
- オーストラリア
- 中東・アフリカ
- サウジアラビア
- アラブ首長国連邦
- 南アフリカ
- ラテンアメリカ
- ブラジル
- アルゼンチン
第8章 企業プロファイル
- Bel Fuse
- BorgWarner
- Brusa Elektronik
- Delta Energy Systems
- Eaton
- Ficosa Internacional
- Hyundai Motor
- Infineon Technologies
- Innolectric
- Nissan Motor
- Phinia
- Stercom Power Solutions
- STMicroelectronics
- Tesla
- Toyota Industries
- Valeo
- Xepics Italia
The Global Electric Vehicle On-Board Charger Market is experiencing remarkable growth, reaching USD 24.7 billion in 2024, with projections indicating a CAGR of 20% between 2025 and 2034. This rapid expansion reflects a global surge in EV adoption, driven by environmental concerns, government policies promoting clean energy, and technological advancements. Consumers worldwide are increasingly embracing EVs for their eco-friendly benefits and cost efficiency, creating significant demand for cutting-edge charging solutions. The development of high-performance on-board chargers, which streamline charging processes and reduce downtime, is a pivotal factor in driving this growth. The industry is further bolstered by efforts to standardize charging protocols and enhance infrastructure, enabling greater convenience and compatibility for users, thus ensuring a seamless transition to electric mobility.
Manufacturers are responding to rising EV demand by innovating on-board chargers with higher power ratings, designed to drastically reduce charging times and enhance the overall driving experience. The commitment to faster, more efficient charging systems aligns with growing consumer expectations and underscores the importance of technological progress in advancing the EV ecosystem.
| Market Scope | |
|---|---|
| Start Year | 2024 |
| Forecast Year | 2025-2034 |
| Start Value | $24.7 Billion |
| Forecast Value | $160.7 Billion |
| CAGR | 20% |
The on-board charger market for battery electric vehicles (BEVs) is expected to reach USD 128.1 billion by 2034. BEVs, powered exclusively by electric energy stored in batteries, represent a zero-emission solution that actively contributes to reducing greenhouse gas emissions and combating air pollution. Advances in charging technologies and infrastructure, alongside a surge in consumer interest in sustainable alternatives, are paving the way for BEVs and their on-board chargers to achieve unprecedented growth. The increasing availability of public charging networks and government incentives further incentivize consumers to transition to these eco-friendly vehicles, strengthening market momentum.
On-board chargers in the 11 kW to 22 kW power rating category are forecasted to grow at a CAGR of 19.5% through 2034, reflecting a clear shift in consumer preferences for faster, more powerful charging solutions. These chargers, designed to meet the demands of time-conscious users, ensure quicker and more efficient energy replenishment, making EVs a practical choice for a broader audience. In response, manufacturers are pushing the boundaries of innovation to deliver higher-powered chargers that meet these evolving needs.
The U.S. EV on-board charger market alone is poised to generate USD 10 billion by 2034, driven by a nationwide emphasis on electrification and sustainable transportation. Factors such as federal and state-level incentives, consumer awareness, and technological advancements-like bidirectional charging capabilities-are key contributors to this growth. Policies targeting emissions reduction and promoting clean transportation are laying a strong foundation for the adoption of EVs, positioning the U.S. as a critical player in the global shift toward electric mobility.
Table of Contents
Chapter 1 Methodology & Scope
- 1.1 Market scope & definitions
- 1.2 Market estimates & forecast parameters
- 1.3 Forecast calculation
- 1.4 Data sources
- 1.4.1 Primary
- 1.4.2 Secondary
- 1.4.2.1 Paid
- 1.4.2.2 Public
Chapter 2 Executive Summary
- 2.1 Industry synopsis, 2021 - 2034
Chapter 3 Industry Insights
- 3.1 Industry ecosystem analysis
- 3.2 Regulatory landscape
- 3.3 Industry impact forces
- 3.3.1 Growth drivers
- 3.3.2 Industry pitfalls & challenges
- 3.4 Growth potential analysis
- 3.5 Porter's analysis
- 3.5.1 Bargaining power of suppliers
- 3.5.2 Bargaining power of buyers
- 3.5.3 Threat of new entrants
- 3.5.4 Threat of substitutes
- 3.6 PESTEL analysis
Chapter 4 Competitive Landscape, 2024
- 4.1 Introduction
- 4.2 Strategic outlook
- 4.3 Innovation & sustainability landscape
Chapter 5 Market Size and Forecast, By Propulsion, 2021 – 2034 (Units, USD Billion)
- 5.1 Key trends
- 5.2 BEV
- 5.3 PHEV
- 5.4 Others
Chapter 6 Market Size and Forecast, By Rating, 2021 – 2034 (Units, USD Billion)
- 6.1 Key trends
- 6.2 < 11 kW
- 6.3 > 11 kW to 22 kW
- 6.4 > 22 kW
Chapter 7 Market Size and Forecast, By Region, 2021 – 2034 (Units, USD Billion)
- 7.1 Key trends
- 7.2 North America
- 7.2.1 U.S.
- 7.2.2 Canada
- 7.2.3 Mexico
- 7.3 Europe
- 7.3.1 Norway
- 7.3.2 Germany
- 7.3.3 France
- 7.3.4 Netherlands
- 7.3.5 UK
- 7.3.6 Sweden
- 7.4 Asia Pacific
- 7.4.1 China
- 7.4.2 Japan
- 7.4.3 India
- 7.4.4 South Korea
- 7.4.5 Australia
- 7.5 Middle East & Africa
- 7.5.1 Saudi Arabia
- 7.5.2 UAE
- 7.5.3 South Africa
- 7.6 Latin America
- 7.6.1 Brazil
- 7.6.2 Argentina
Chapter 8 Company Profiles
- 8.1 Bel Fuse
- 8.2 BorgWarner
- 8.3 Brusa Elektronik
- 8.4 Delta Energy Systems
- 8.5 Eaton
- 8.6 Ficosa Internacional
- 8.7 Hyundai Motor
- 8.8 Infineon Technologies
- 8.9 Innolectric
- 8.10 Nissan Motor
- 8.11 Phinia
- 8.12 Stercom Power Solutions
- 8.13 STMicroelectronics
- 8.14 Tesla
- 8.15 Toyota Industries
- 8.16 Valeo
- 8.17 Xepics Italia

