
モバイル決済の市場機会、成長要因、業界動向分析、および2026年~2035年の予測
Mobile Payment Market Opportunity, Growth Drivers, Industry Trend Analysis, and Forecast 2026 - 2035- 発行日
- ページ情報
- 英文 260 Pages
- 納期
- 2~3営業日
- 商品コード
- 2038470
- カスタマイズ可能 お客様のご希望に応じて、既存データの加工や未掲載情報(例:国別セグメント)の追加などの対応が可能です。詳細はお問い合わせください。
- 翻訳ツール提供対象 PDF対応AI翻訳ツールの無料貸し出しサービスのご利用が可能です
世界のモバイル決済市場は、2025年に599億米ドルと評価され、CAGR 13.9%で成長し、2035年までに2,180億米ドルに達すると予測されています。
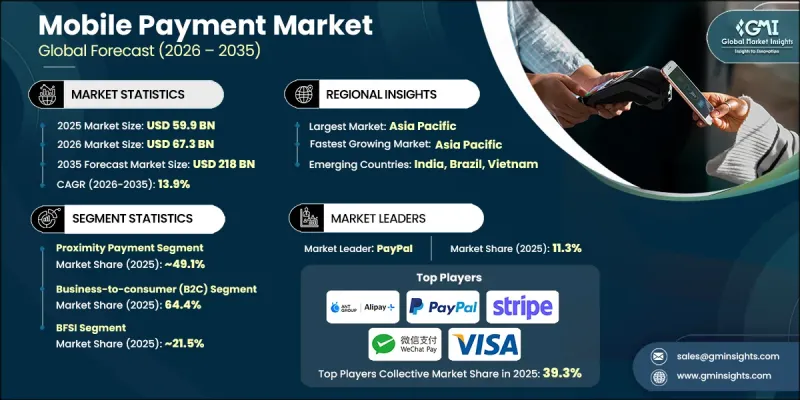
この市場は、金融サービスにおける急速なデジタルトランスフォーメーションと、キャッシュレス取引に対する消費者の嗜好の高まりに牽引され、勢いを増しています。スマートフォンの普及率の上昇、インターネット接続環境の拡大、そしてデジタルウォレットの広範な普及により、先進国および新興国を問わず、決済行動が再構築されつつあります。消費者は、特に小売やオンラインコマースの環境において、より迅速で便利かつ安全な決済方法へとますます移行しています。高度な暗号化技術や安全な決済ゲートウェイの統合により、取引の信頼性とユーザーの安心感はさらに向上しています。さらに、政府や金融機関は、金融包摂を促進し、現金取引への依存度を低減させるため、デジタル決済エコシステムを積極的に推進しています。複数のプラットフォームにまたがるシームレスでリアルタイムな決済体験への需要の高まりも、モバイル決済インフラのイノベーションを加速させています。非接触技術の普及拡大に加え、デジタルファーストのビジネスモデルの拡大により、世界各地域における市場の長期的な見通しは引き続き強固なものとなっています。
| 市場範囲 | |
|---|---|
| 開始年 | 2025年 |
| 予測期間 | 2026年~2035年 |
| 開始時の市場規模 | 599億米ドル |
| 予測額 | 2,180億米ドル |
| CAGR | 13.9% |
2025年、近距離決済セグメントは市場シェアの49.1%を占め、約305億米ドルの市場規模を生み出しました。このセグメントは、迅速な取引処理、最小限のユーザー操作、そして最新のスマートデバイスとの互換性により、広く利用されています。その用途は従来の小売取引を超えて拡大しており、アクセス認証、チケット発行、駐車料金の支払いなどの統合機能をサポートすることで、業務の効率化とユーザーの利便性向上に貢献しています。
BtoC(企業対消費者)セグメントは、2025年に64.4%のシェアを占め、386億米ドルの市場規模となりました。このセグメントの力強い成長は、eコマース活動の拡大、サブスクリプション型デジタルサービス、ギグエコノミープラットフォーム、および実店舗におけるモバイル決済システムの導入増加によって牽引されています。デジタル決済手段に対する消費者の親しみやすさが高まっていることも、このカテゴリー全体の取引量をさらに押し上げています。
米国のモバイル決済市場は2025年に149億米ドルに達し、2035年までCAGR12.3%で成長すると予想されています。同国における市場の成長は、決済インフラの継続的な進歩、スマートフォンの普及、そして堅調な消費者の購買力によって支えられています。非接触型およびリアルタイム決済システムの導入拡大も、市場の持続的な拡大に寄与しています。
よくあるご質問
目次
第1章 調査手法
第2章 エグゼクティブサマリー
第3章 業界考察
- エコシステム分析
- サプライヤーの情勢
- 利益率
- コスト構造
- 各段階における付加価値
- バリューチェーンに影響を与える要因
- ディスラプション
- 業界への影響要因
- 促進要因
- スマートフォンの普及率およびインターネット接続環境の拡大
- キャッシュレス経済に向けた政府の取り組み
- 拡大するEコマースおよびMコマースの普及
- 強化された決済セキュリティ機能
- 業界の潜在的リスク&課題
- 新興市場におけるインフラの制約
- セキュリティおよびプライバシーに関する懸念
- 市場機会
- NFCおよび非接触技術の統合
- 新興市場における拡大
- 不正防止のためのAIおよび機械学習
- 促進要因
- 技術およびイノベーションの動向
- 現在の技術
- 近距離無線通信(NFC)
- QRコード決済
- トークン化
- 新興技術
- ブロックチェーン
- 中央銀行デジタル通貨(CBDC)
- 不正検知における人工知能
- 5G
- 現在の技術
- 成長可能性分析
- 規制情勢
- 北米
- 米国- 消費者金融保護局(CFPB)
- カナダ-FINTRAC
- 欧州
- EU-欧州中央銀行(ECB)
- 英国- 金融行動監視機構(FCA)
- アジア太平洋地域
- 中国- 中国人民銀行(PBoC)
- インド- インド準備銀行(RBI)
- ラテンアメリカ
- ブラジル- ブラジル中央銀行
- メキシコ- メキシコ銀行
- 中東・アフリカ
- UAE-アラブ首長国連邦中央銀行(CBUAE)
- 南アフリカ- 南アフリカ準備銀行(SARB)
- 北米
- ポーター分析
- PESTEL分析
- 特許動向(1次調査に基づく)
- 加盟店による導入と決済インフラ[カスタム]
- 加盟店獲得率およびコンバージョン指標
- 地域別のPOS/QRコード導入密度
- 事業者規模およびカテゴリー別の導入ギャップ
- 統合上の課題と技術的障壁
- 不正防止・検知システム
- 認証技術と導入率
- 不正検知メカニズムとAIを活用したソリューション
- チャージバック率と紛争解決システム
- セキュリティインフラへの投資とベストプラクティス
- AIおよび生成AIが市場に与える影響
- AIによる既存ビジネスモデルの変革
- セグメント別のジェネレーティブAIの使用事例と導入ロードマップ
- リスク、制約、および規制上の考慮事項
- 予測の前提条件およびシナリオ分析(1次調査に基づく)
- ベースケース-CAGRを牽引する主要なマクロ経済および業界変数
- 楽観的シナリオ- マクロ経済および業界における追い風
- 悲観シナリオ- マクロ経済の減速または業界の逆風
第4章 競合情勢
- イントロダクション
- 企業の市場シェア分析
- 北米
- 欧州
- アジア太平洋地域
- ラテンアメリカ
- 中東・アフリカ(MEA)
- 主要市場企業の競合分析
- 競合ポジショニングマトリックス
- 主な発展
- 合併・買収
- パートナーシップおよび提携
- 新製品の発売
- 事業拡大計画と資金調達
- 企業のティア別ベンチマーク
- ティア分類基準および選定基準
- 売上高、地域、イノベーション別のティア位置付けマトリックス
第5章 市場推計・予測:決済技術別、2022-2035
- 近距離決済
- 近距離無線通信(NFC)
- QRコード決済
- リモート決済
- モバイルウォレット/デジタルウォレット
- モバイルコマース(Mコマース)
- モバイル直接課金
- SMS決済
- その他
第6章 市場推計・予測:用途別、2022-2035
- 企業間取引(B2B)
- 企業対消費者(B2C)
- 企業対政府(B2G)
- その他
第7章 市場推計・予測:最終用途別、2022-2035
- BFSI
- 小売・Eコマース
- ヘルスケア
- IT・通信
- メディア・エンターテインメント
- 交通機関
- 旅行・ホスピタリティ
- エネルギー・公益事業
- その他
第8章 市場推計・予測:地域別、2022-2035
- 北米
- 米国
- カナダ
- 欧州
- ドイツ
- 英国
- フランス
- イタリア
- スペイン
- ロシア
- オランダ
- ノルウェー
- アジア太平洋地域
- 中国
- 日本
- 韓国
- インド
- オーストラリア
- タイ
- インドネシア
- シンガポール
- ベトナム
- ラテンアメリカ
- ブラジル
- メキシコ
- アルゼンチン
- チリ
- 中東・アフリカ(MEA)
- 南アフリカ
- サウジアラビア
- アラブ首長国連邦
第9章 企業プロファイル
- 世界企業
- PayPal
- Apple
- Alphabet
- Samsung Electronics
- Adyen
- Stripe
- Visa
- Mastercard
- American Express
- Block
- Amazon
- PayU
- 地域企業
- Klarna Bank
- Ant Group
- Tencent
- One97 Communications
- PhonePe
- MercadoLibre
- 新興企業
- Revolut
- N26 Bank
- 発行日
- 発行
- Global Market Insights Inc.
- ページ情報
- 英文 260 Pages
- 納期
- 2~3営業日


