
|
市場調査レポート
商品コード
1666644
乾式変流器市場の機会、成長促進要因、産業動向分析、2025~2034年の予測Dry Type Current Transformer Market Opportunity, Growth Drivers, Industry Trend Analysis, and Forecast 2025 - 2034 |
||||||
カスタマイズ可能
|
|||||||
| 乾式変流器市場の機会、成長促進要因、産業動向分析、2025~2034年の予測 |
|
出版日: 2024年12月17日
発行: Global Market Insights Inc.
ページ情報: 英文 80 Pages
納期: 2~3営業日
|

全表示
- 概要
- 目次
乾式変流器の世界市場は2024年に5億5,880万米ドルとなり、2025年から2034年にかけてCAGR 7.7%の堅調な成長が予測されています。
同市場は、エネルギー効率の高いソリューションに対する需要の増加、再生可能エネルギーの導入に向けた世界の動向、送電網インフラの近代化など、いくつかの重要な要因によって活性化しています。都市化が急ピッチで進む中、より安全で持続可能な変圧器へのニーズはかつてないほど高まっています。
乾式変流器は、非油絶縁システムにより、画期的な変圧器であることが証明されつつあります。これらの変圧器は火災の危険性を軽減し、環境汚染のリスクを低減するため、安全性が最優先される屋内設備や繊細な環境に最適です。環境への影響を低減し、送電網の信頼性を高めることに世界の重点が移りつつある中、乾式変圧器は、より安全で効率的な配電システムに対する需要の高まりに応える完璧なソリューションを提供しています。
| 市場範囲 | |
|---|---|
| 開始年 | 2024 |
| 予測年 | 2025-2034 |
| 開始金額 | 5億5,880万米ドル |
| 予測金額 | 12億米ドル |
| CAGR | 7.7% |
乾式変流器市場の革新的開発は、メーカーが時代の先端を行くのに役立っています。エポキシ樹脂のような高度な絶縁材料を統合する傾向が高まっており、熱性能を高めるだけでなく、耐湿性や耐汚染性も向上しています。さらに、スマート・モニタリング・システムの台頭は、変圧器の管理方法に革命をもたらしています。これらのシステムは、リアルタイムのデータ収集と予知保全を可能にし、エネルギー管理のデジタル化と電力網の近代化という広範な傾向に合致しています。このようなインテリジェントシステムへの注目の高まりは、運転効率の向上とダウンタイムの短縮に役立ち、これはエネルギーの信頼性にとって極めて重要です。
巻線式変流器市場は、この業界の主要セグメントであり、2034年までに4億7,640万米ドルの市場規模が見込まれています。このセグメントは、配電ネットワークにおける正確で信頼性の高い電流測定に対するニーズの高まりから利益を得ています。巻線タイプの変圧器は、通常、送電システムや変電所などの高電圧用途で使用され、優れた精度、効率、費用対効果を提供します。特にハイエンドの磁性体や保護コーティングなどの材料において、その進歩が続いており、耐久性と全体的な性能がさらに向上しています。
配電部門に関しては、2034年までのCAGRが6.8%になると予測されています。スマートグリッドに対する需要の高まりと、グリッド近代化の継続的な進化が、この成長を後押ししています。乾式変流器は、このような高度な配電システムにおいて正確な電流測定と監視を行う上で極めて重要です。乾式変流器は、より複雑な送電網の管理を可能にし、エネルギー配給の効率と信頼性を保証します。
米国では、乾式変流器市場は2034年までに9,250万米ドルを創出すると予想されています。この成長は、同国が送電網の近代化に注力し続けていること、再生可能エネルギー源の統合が進んでいること、環境に優しく安全な配電ソリューションへの需要が高まっていることが主な要因です。乾式変圧器は、電力系統の精度と信頼性を確保する上で極めて重要であり、米国の電力網の安定性と性能の維持に貢献しています。
目次
第1章 調査手法と調査範囲
- 市場の定義
- 基本推定と計算
- 予測計算
- データソース
- 1次データ
- 2次データ
- 有償
- 公的
第2章 エグゼクティブサマリー
第3章 業界洞察
- エコシステム分析
- 規制状況
- 業界への影響要因
- 促進要因
- 業界の潜在的リスク&課題
- 成長可能性分析
- ポーターの分析
- 供給企業の交渉力
- 買い手の交渉力
- 新規参入業者の脅威
- 代替品の脅威
- PESTEL分析
第4章 競合情勢
- 戦略ダッシュボード
- イノベーションと持続可能性の展望
第5章 市場規模・予測:製品別、2021年~2034年
- 主要動向
- 巻線タイプ
- トロイダル
- バータイプ
- その他
第6章 市場規模・予測:定格電圧別、2021年~2034年
- 主要動向
- 33 kV以下
- 33 kV~66 kV未満
- 66 kV以上
第7章 市場規模・予測:用途別、2021~2034年
- 主要動向
- 配電
- 製造業
- その他
第8章 市場規模・予測:地域別、2021年~2034年
- 主要動向
- 北米
- 米国
- カナダ
- メキシコ
- 欧州
- 英国
- フランス
- ドイツ
- イタリア
- ロシア
- スペイン
- アジア太平洋
- 中国
- オーストラリア
- インド
- 日本
- 韓国
- 中東・アフリカ
- サウジアラビア
- アラブ首長国連邦
- トルコ
- 南アフリカ
- エジプト
- ラテンアメリカ
- ブラジル
- アルゼンチン
第9章 企業プロファイル
- ABB
- Amran
- ARTECHE
- Automatic Electric
- Dalian Huayi Electric Power Electric Appliances
- General Electric
- Guangdong Sihui Instrument Transformer Works
- Hitachi Energy
- Instrument Transformers
- Macroplast
- Peak Demand
- Siemens Energy
- TWB
- Wenzhou Unisun Electric
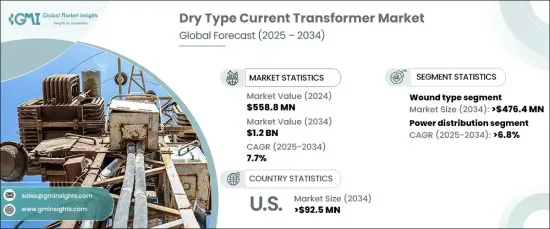
The Global Dry Type Current Transformer Market was valued at USD 558.8 million in 2024 and is projected to grow at a robust CAGR of 7.7% from 2025 to 2034. The market is being fueled by several key factors, including the increasing demand for energy-efficient solutions, the global trend toward renewable energy adoption, and the modernization of power grid infrastructures. With urbanization continuing at a rapid pace, the need for safer and more sustainable transformers is greater than ever.
Dry-type current transformers, with their non-oil insulation systems, are proving to be a game-changer. These transformers mitigate fire hazards and reduce the risk of environmental contamination, making them ideal for indoor installations and sensitive environments where safety is a top priority. As the global emphasis shifts towards reducing environmental impact and enhancing grid reliability, dry-type transformers provide the perfect solution to meet the growing demand for safer, more efficient power distribution systems.
| Market Scope | |
|---|---|
| Start Year | 2024 |
| Forecast Year | 2025-2034 |
| Start Value | $558.8 Million |
| Forecast Value | $1.2 Billion |
| CAGR | 7.7% |
Innovative developments in the dry-type current transformer market are helping manufacturers stay ahead of the curve. There is a growing trend of integrating advanced insulation materials, such as epoxy resin, which not only enhances the thermal performance but also improves moisture and contaminant resistance. Additionally, the rise of smart monitoring systems is revolutionizing the way transformers are managed. These systems allow real-time data collection and predictive maintenance, aligning with the broader trend of digitalizing energy management and modernizing electrical grids. The increasing focus on these intelligent systems will help improve operational efficiency and reduce downtime, which is crucial for energy reliability.
The wound-type current transformer market, a key segment within the industry, is expected to generate USD 476.4 million by 2034. This segment benefits from the growing need for precise and reliable current measurements in power distribution networks. Wound-type transformers, typically used in high-voltage applications such as power transmission systems and substations, offer exceptional accuracy, efficiency, and cost-effectiveness. Their ongoing advancement, particularly in materials such as high-end magnetic substances and protective coatings, is further enhancing their durability and overall performance.
As for the power distribution sector, it's projected to experience a CAGR of 6.8% through 2034. The rising demand for smart grids and the continuing evolution of grid modernization are driving this growth. Dry-type current transformers are pivotal in providing accurate current measurement and monitoring within these advanced power distribution systems. They enable the management of more complex grids, ensuring efficiency and reliability in energy distribution.
In the U.S., the dry-type current transformer market is expected to generate USD 92.5 million by 2034. This growth is largely attributed to the country's ongoing focus on modernizing its electrical grid, the increasing integration of renewable energy sources, and a growing demand for environmentally friendly and secure power distribution solutions. Dry-type transformers are crucial in ensuring the accuracy and reliability of power systems, helping to maintain the stability and performance of the U.S. power grid.
Table of Contents
Chapter 1 Methodology & Scope
- 1.1 Market definitions
- 1.2 Base estimates & calculations
- 1.3 Forecast calculation
- 1.4 Data sources
- 1.4.1 Primary
- 1.4.2 Secondary
- 1.4.2.1 Paid
- 1.4.2.2 Public
Chapter 2 Executive Summary
- 2.1 Industry synopsis, 2021 – 2034
Chapter 3 Industry Insights
- 3.1 Industry ecosystem analysis
- 3.2 Regulatory landscape
- 3.3 Industry impact forces
- 3.3.1 Growth drivers
- 3.3.2 Industry pitfalls & challenges
- 3.4 Growth potential analysis
- 3.5 Porter's analysis
- 3.5.1 Bargaining power of suppliers
- 3.5.2 Bargaining power of buyers
- 3.5.3 Threat of new entrants
- 3.5.4 Threat of substitutes
- 3.6 PESTEL analysis
Chapter 4 Competitive landscape, 2024
- 4.1 Strategic dashboard
- 4.2 Innovation & sustainability landscape
Chapter 5 Market Size and Forecast, By Product, 2021 – 2034 (‘000 Units & USD Million)
- 5.1 Key trends
- 5.2 Wound type
- 5.3 Toroidal
- 5.4 Bar type
- 5.5 Others
Chapter 6 Market Size and Forecast, By Voltage Rating, 2021 – 2034 (‘000 Units & USD Million)
- 6.1 Key trends
- 6.2 ≤ 33 kV
- 6.3 > 33 kV to ≤ 66 kV
- 6.4 > 66 kV
Chapter 7 Market Size and Forecast, By Application, 2021 – 2034 (‘000 Units & USD Million)
- 7.1 Key trends
- 7.2 Power distribution
- 7.3 Manufacturing
- 7.4 Others
Chapter 8 Market Size and Forecast, By Region, 2021 – 2034 (‘000 Units & USD million)
- 8.1 Key trends
- 8.2 North America
- 8.2.1 U.S.
- 8.2.2 Canada
- 8.2.3 Mexico
- 8.3 Europe
- 8.3.1 UK
- 8.3.2 France
- 8.3.3 Germany
- 8.3.4 Italy
- 8.3.5 Russia
- 8.3.6 Spain
- 8.4 Asia Pacific
- 8.4.1 China
- 8.4.2 Australia
- 8.4.3 India
- 8.4.4 Japan
- 8.4.5 South Korea
- 8.5 Middle East & Africa
- 8.5.1 Saudi Arabia
- 8.5.2 UAE
- 8.5.3 Turkey
- 8.5.4 South Africa
- 8.5.5 Egypt
- 8.6 Latin America
- 8.6.1 Brazil
- 8.6.2 Argentina
Chapter 9 Company Profiles
- 9.1 ABB
- 9.2 Amran
- 9.3 ARTECHE
- 9.4 Automatic Electric
- 9.5 Dalian Huayi Electric Power Electric Appliances
- 9.6 General Electric
- 9.7 Guangdong Sihui Instrument Transformer Works
- 9.8 Hitachi Energy
- 9.9 Instrument Transformers
- 9.10 Macroplast
- 9.11 Peak Demand
- 9.12 Siemens Energy
- 9.13 TWB
- 9.14 Wenzhou Unisun Electric

