
|
市場調査レポート
商品コード
1685079
ボトルウォーターパッケージング市場の機会、成長促進要因、産業動向分析、2025年~2034年の予測Bottled Water Packaging Market Opportunity, Growth Drivers, Industry Trend Analysis, and Forecast 2025 - 2034 |
||||||
カスタマイズ可能
|
|||||||
| ボトルウォーターパッケージング市場の機会、成長促進要因、産業動向分析、2025年~2034年の予測 |
|
出版日: 2025年01月07日
発行: Global Market Insights Inc.
ページ情報: 英文 210 Pages
納期: 2~3営業日
|

全表示
- 概要
- 目次
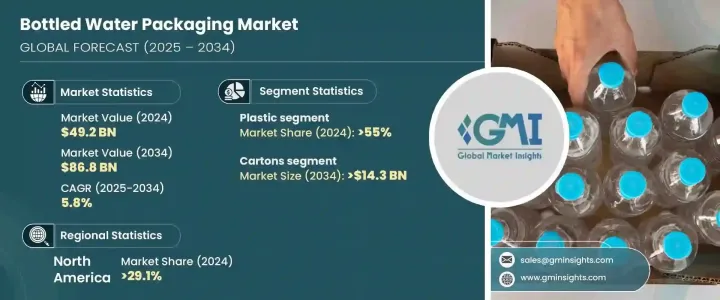
世界のボトルウォーターパッケージング市場は2024年に492億米ドルに達し、2025年から2034年にかけて5.8%のCAGRを示すと予想されています。
この目覚ましい成長は主に、飲料業界における便利で携帯可能、持続可能なパッケージング・ソリューションに対する消費者需要の高まりによるものです。ボトル入り飲料水の消費量が世界的に拡大し続ける中、利便性と環境責任を両立させた製品への消費者の嗜好が大きく変化しています。
メーカー各社は、こうした需要の変化を敏感に察知し、機能性と持続可能性の両方の要件を満たすためにパッケージング・ソリューションを革新することで対応しています。このようなイノベーションは、単にパッケージデザインにとどまらず、環境フットプリントを削減する素材の選択や生産工程にも及んでいます。持続可能性は、規制の変化や環境意識の高い購買者の行動に業界が適応するにつれ、生産者と消費者の双方にとって中心的な焦点となっています。環境問題に対する消費者の意識が高まり続ける中、包装は購買決定に影響を与える重要な役割を担っており、市場で優位に立ちたい企業にとって重要な分野となっています。
| 市場範囲 | |
|---|---|
| 開始年 | 2024 |
| 予測年 | 2025-2034 |
| 開始金額 | 492億米ドル |
| 予測金額 | 868億米ドル |
| CAGR | 5.8% |
ボトルウォーターパッケージング市場は、包装材料別にプラスチック、ガラス、金属、その他の材料に区分され、2024年にはプラスチックが55%のシェアを占めて市場を独占します。プラスチック分野は顕著な変革期を迎えており、軽量化・薄型化の傾向が強まっています。こうした技術革新は、耐久性や利便性を損なうことなく材料使用量を削減することを目的としています。さらに、持続可能性を重視するあまり、多くの企業が製品にリサイクルPET(rPET)の割合を高め、環境への影響を効果的に最小化しつつ、消費者に高品質で便利なソリューションを提供しています。
包装タイプ別では、ボトル、缶、カートン、パウチ、その他があります。カートン・セグメントはCAGR 6.5%で堅調に成長し、2034年までに143億米ドルを創出すると予測されています。カートンは、再生可能、リサイクル可能、持続可能という性質から人気が高まっています。薄いプラスチックの裏地が付いた板紙で作られることが多いカートンは、従来のペットボトルに代わる、より環境に優しい代替品を提供し、プラスチック廃棄物に対する懸念に対処しています。消費者は、二酸化炭素排出量の削減と、生産に関わる環境に配慮したプロセスにより、これらのソリューションに傾倒しています。
北米はボトルウォーターパッケージング市場で大きなシェアを占めており、2024年のシェアは29.1%です。この地域の需要は、便利で革新的なパッケージング・オプションへの嗜好によって大きく左右されています。これを受けて、メーカーは生分解性素材や再生プラスチック製の軽量ボトルなど、最先端のソリューションを導入しています。持続可能性に対する消費者の意識が高まる中、環境意識の高い価値観に沿ったパッケージングに対する需要は、今後も市場拡大を牽引していくと予想されます。さらに、プレミアムで機能的な水製品への関心の高まりは、ブランドが健康志向で環境意識の高い消費者にアピールしようとするため、パッケージデザインの限界を押し広げています。
目次
第1章 調査手法と調査範囲
- 市場範囲と定義
- 基本推定と計算
- 予測計算
- データソース
第2章 エグゼクティブサマリー
第3章 業界洞察
- エコシステム分析
- バリューチェーンに影響を与える要因
- ディスラプション
- 将来の展望
- メーカー
- 流通業者
- 利益率分析
- 主なニュースと取り組み
- 規制状況
- 影響要因
- 促進要因
- プライベートブランド飲料水ブランドの成長
- アルミ缶入りプレミアム機能性飲料の拡大
- 消費者の健康志向の高まり
- 便利で持ち運びに便利なパッケージへの需要の高まり
- 清潔な飲料水に対する意識の高まり
- 業界の潜在的リスク&課題
- 廃棄物管理の慣行と政策の世界のばらつき
- プラスチック廃棄物が環境に与える影響
- 促進要因
- 成長可能性分析
- ポーター分析
- PESTEL分析
第4章 競合情勢
- イントロダクション
- 企業シェア分析
- 競合のポジショニング・マトリックス
- 戦略展望マトリックス
第5章 市場推計・予測:包装材料別、2021年~2034年
- 主要動向
- プラスチック
- ガラス
- 金属
- その他
第6章 市場推計・予測:包装タイプ別、2021年~2034年
- 主要動向
- ボトル
- 缶
- カートン
- パウチ
- その他
第7章 市場推計・予測:容量別、2021年~2034年
- 主要動向
- 500mL未満
- 500mL~1L
- 1L~2.5L
- 2.5L以上
第8章 市場推計・予測:用途別、2021年~2034年
- 主要動向
- スティルウォーター
- 炭酸水
- フレーバーウォーター
- 機能性ウォーター
- その他
第9章 市場推計・予測:地域別、2021年~2034年
- 主要動向
- 北米
- 米国
- カナダ
- 欧州
- 英国
- ドイツ
- フランス
- イタリア
- スペイン
- ロシア
- アジア太平洋
- 中国
- インド
- 日本
- 韓国
- オーストラリア
- ラテンアメリカ
- ブラジル
- メキシコ
- 中東・アフリカ
- 南アフリカ
- サウジアラビア
- アラブ首長国連邦
第10章 企業プロファイル
- Alpla
- Amcor
- Aquafina
- Ball
- Crystal Geyser
- Gerolsteiner
- Graham Packaging
- Greif
- Ice Mountain
- Kinley
- Nestle Waters
- O-I Glass
- Sabic
- Sidel
- Tetra Pak
- Vetropack
- Vidrala
- Westrock
The Global Bottled Water Packaging Market reached USD 49.2 billion in 2024 and is expected to exhibit a CAGR of 5.8% from 2025 to 2034. This impressive growth is primarily driven by the increasing consumer demand for convenient, portable, and sustainable packaging solutions in the beverage industry. As the world's consumption of bottled water continues to expand, there's a significant shift in consumer preferences toward products that offer both convenience and environmental responsibility.
Manufacturers are keenly aware of these evolving demands and are responding by innovating their packaging solutions to meet both functional and sustainability requirements. These innovations are not just limited to packaging design but also encompass material choices and production processes that reduce the environmental footprint. Sustainability has become a central focus for both producers and consumers alike as the industry adapts to shifting regulations and eco-conscious buyer behavior. As consumer awareness about environmental issues continues to rise, packaging plays a critical role in influencing purchasing decisions, making it a key area of focus for businesses looking to stay ahead in the market.
| Market Scope | |
|---|---|
| Start Year | 2024 |
| Forecast Year | 2025-2034 |
| Start Value | $49.2 Billion |
| Forecast Value | $86.8 Billion |
| CAGR | 5.8% |
By packaging material, the bottled water packaging market is segmented into plastic, glass, metal, and other materials, with plastic dominating the market, holding a 55% share in 2024. The plastic segment is undergoing a notable transformation, with a growing trend toward lightweight and thinner bottle designs. These innovations aim to reduce material usage without compromising on durability or convenience. Furthermore, the emphasis on sustainability has led many companies to incorporate higher percentages of recycled PET (rPET) in their products, effectively minimizing environmental impact while still providing a high-quality, convenient solution for consumers.
In terms of packaging type, the market includes bottles, cans, cartons, pouches, and others. The cartons segment is projected to grow at a robust CAGR of 6.5% and generate USD 14.3 billion by 2034. Cartons have garnered increasing popularity due to their renewable, recyclable, and sustainable nature. Often made from paperboard with a thin plastic lining, cartons provide a more eco-friendly alternative to traditional plastic bottles, addressing concerns over plastic waste. Consumers are leaning more towards these solutions for their reduced carbon footprint and the environmentally responsible processes involved in their production.
North America holds a substantial share of the bottled water packaging market, with a 29.1% share in 2024. The region's demand is largely driven by a preference for convenient, innovative packaging options. In response, manufacturers are introducing cutting-edge solutions, including biodegradable materials and lightweight bottles made from recycled plastics. With growing consumer awareness about sustainability, the demand for packaging that aligns with eco-conscious values is expected to continue driving the market expansion. Moreover, the rising interest in premium and functional water products is pushing the boundaries of packaging design as brands seek to appeal to health-conscious and eco-aware consumers.
Table of Contents
Chapter 1 Methodology & Scope
- 1.1 Market scope & definitions
- 1.2 Base estimates & calculations
- 1.3 Forecast calculations
- 1.4 Data sources
- 1.4.1 Primary
- 1.4.2 Secondary
- 1.4.2.1 Paid sources
- 1.4.2.2 Public sources
Chapter 2 Executive Summary
- 2.1 Industry synopsis, 2021-2034
Chapter 3 Industry Insights
- 3.1 Industry ecosystem analysis
- 3.1.1 Factor affecting the value chain
- 3.1.2 Disruptions
- 3.1.3 Future outlook
- 3.1.4 Manufacturers
- 3.1.5 Distributors
- 3.2 Profit margin analysis
- 3.3 Key news & initiatives
- 3.4 Regulatory landscape
- 3.5 Impact forces
- 3.5.1 Growth drivers
- 3.5.1.1 Growth in private label bottled water brands
- 3.5.1.2 Expansion of premium functional hydration in aluminum cans
- 3.5.1.3 Increasing health consciousness among consumers
- 3.5.1.4 Rising demand for convenience and on-the-go packaging
- 3.5.1.5 Rising awareness about clean drinking water
- 3.5.2 Industry pitfalls & challenges
- 3.5.2.1 Global variation in waste management practices and policies
- 3.5.2.2 Environmental impact of plastic waste
- 3.5.1 Growth drivers
- 3.6 Growth potential analysis
- 3.7 Porter’s analysis
- 3.8 PESTEL analysis
Chapter 4 Competitive Landscape, 2024
- 4.1 Introduction
- 4.2 Company market share analysis
- 4.3 Competitive positioning matrix
- 4.4 Strategic outlook matrix
Chapter 5 Market Estimates & Forecast, By Packaging Material, 2021-2034 (USD Billion & Kilo Tons)
- 5.1 Key trends
- 5.2 Plastic
- 5.3 Glass
- 5.4 Metal
- 5.5 Others
Chapter 6 Market Estimates & Forecast, By Packaging Type, 2021-2034 (USD Billion & Kilo Tons)
- 6.1 Key trends
- 6.2 Bottles
- 6.3 Cans
- 6.4 Cartons
- 6.5 Pouches
- 6.6 Others
Chapter 7 Market Estimates & Forecast, By Capacity, 2021-2034 (USD Billion & Kilo Tons)
- 7.1 Key trends
- 7.2 Below 500 ml
- 7.3 500 ml to 1 liter
- 7.4 1 liter to 2.5 liters
- 7.5 Above 2.5 liters
Chapter 8 Market Estimates & Forecast, By Application, 2021-2034 (USD Billion & Kilo Tons)
- 8.1 Key trends
- 8.2 Still water
- 8.3 Carbonated water
- 8.4 Flavored water
- 8.5 Functional water
- 8.6 Others
Chapter 9 Market Estimates & Forecast, By Region, 2021-2034 (USD Billion & Kilo Tons)
- 9.1 Key trends
- 9.2 North America
- 9.2.1 U.S.
- 9.2.2 Canada
- 9.3 Europe
- 9.3.1 UK
- 9.3.2 Germany
- 9.3.3 France
- 9.3.4 Italy
- 9.3.5 Spain
- 9.3.6 Russia
- 9.4 Asia Pacific
- 9.4.1 China
- 9.4.2 India
- 9.4.3 Japan
- 9.4.4 South Korea
- 9.4.5 Australia
- 9.5 Latin America
- 9.5.1 Brazil
- 9.5.2 Mexico
- 9.6 MEA
- 9.6.1 South Africa
- 9.6.2 Saudi Arabia
- 9.6.3 UAE
Chapter 10 Company Profiles
- 10.1 Alpla
- 10.2 Amcor
- 10.3 Aquafina
- 10.4 Ball
- 10.5 Crystal Geyser
- 10.6 Gerolsteiner
- 10.7 Graham Packaging
- 10.8 Greif
- 10.9 Ice Mountain
- 10.10 Kinley
- 10.11 Nestle Waters
- 10.12 O-I Glass
- 10.13 Sabic
- 10.14 Sidel
- 10.15 Tetra Pak
- 10.16 Vetropack
- 10.17 Vidrala
- 10.18 Westrock

