
|
市場調査レポート
商品コード
1666949
液化石油ガス貯蔵の市場機会、成長促進要因、産業動向分析、2025年~2034年予測Liquefied Petroleum Gas Storage Market Opportunity, Growth Drivers, Industry Trend Analysis, and Forecast 2025 - 2034 |
||||||
カスタマイズ可能
|
|||||||
| 液化石油ガス貯蔵の市場機会、成長促進要因、産業動向分析、2025年~2034年予測 |
|
出版日: 2024年12月30日
発行: Global Market Insights Inc.
ページ情報: 英文 110 Pages
納期: 2~3営業日
|

全表示
- 概要
- 目次
世界の液化石油ガス貯蔵市場は、2024年に830億米ドルとなり、2025年から2034年にかけてCAGR1.7%で安定的に成長すると予想されています。
急速な都市化と、環境への影響を最小限に抑えるためのクリーンで効率的な代替燃料への需要の高まりが、市場を前進させる主な要因となっています。世界各国の政府がLPGへのアクセス拡大を推進する中、LPGの利用可能性を高めるための様々な取り組みが導入され、市場の拡大をさらに後押ししています。こうした取り組みは、環境の持続可能性に対する関心の高まりとともに、LPG貯蔵市場を大きく後押ししています。
さらに、各国政府はより厳しい規制と安全プロトコルを施行し、より高度なLPG貯蔵ソリューションへの投資につながっています。政府も民間セクターも、漏れ検知システムや圧力監視などの安全機能を統合した最先端の貯蔵技術に投資しており、これが市場をさらに強化しています。エネルギー効率、安全性、持続可能性への注目の高まりは、LPG需要の増加に対応するために設計された革新的な貯蔵技術の開発を促進しています。
| 市場範囲 | |
|---|---|
| 開始年 | 2024年 |
| 予測年 | 2025年~2034年 |
| 開始金額 | 830億米ドル |
| 予測金額 | 975億米ドル |
| CAGR | 1.7% |
加圧タンク分野は、2034年までに850億米ドルを超えると予測されています。これらのタンクはLPGの安全な貯蔵と流通に重要な役割を果たしており、加圧下でガスを液体の状態に維持し、高いエネルギー密度と効率的な輸送オプションを提供します。加圧タンクは、コンパクトなスペースに大量のLPGを貯蔵するのに非常に効果的で、住宅用にも産業用にも理想的です。その適応性と、耐腐食性材料の改良、断熱材、統合監視システムなどの新技術が相まって、今後数年間、この分野の成長を牽引すると思われます。
米国では、LPG貯蔵市場は2034年までに405億米ドルを超えると予測されています。同国には豊富なシェールガスが存在し、人口増加とエネルギー消費の増加によるLPG需要の高まりと相まって、LPG生産の増加が促進されています。さらに、よりクリーンなエネルギー源へのシフトが、家庭での調理、暖房、産業部門にわたってLPGの使用を拡大し、貯蔵・流通システムの強化につながっています。スマートモニタリングとオートメーションシステムは、LPG貯蔵の運用効率と安全性の向上に不可欠な役割を果たしています。
よりクリーンなエネルギーと温室効果ガス排出の削減を促進する政府のインセンティブ、義務付け、政策の実施は、引き続き市場を形成しています。こうした規制は成長の機会をさらにもたらし、さまざまな地域におけるLPG貯蔵インフラの開発をさらに後押ししています。
目次
第1章 調査手法と調査範囲
- 市場の定義
- 基本推定と計算
- 予測計算
- データソース
- 一次
- 二次
- 有償
- 公的
第2章 エグゼクティブサマリー
第3章 業界洞察
- 業界エコシステム分析
- 規制状況
- 業界への影響要因
- 成長促進要因
- 業界の潜在的リスク・課題
- 成長ポテンシャル分析
- ポーター分析
- 供給企業の交渉力
- 買い手の交渉力
- 新規参入業者の脅威
- 代替品の脅威
- PESTEL分析
第4章 競合情勢
- イントロダクション
- 戦略ダッシュボード
- イノベーションと持続可能性の展望
第5章 市場規模・予測:貯蔵タイプ別、2021年~2034年
- 主要動向
- 加圧タンク
- 冷蔵タンク
第6章 市場規模・予測:地域別、2021年~2034年
- 主要動向
- 北米
- 米国
- カナダ
- 欧州
- スペイン
- ロシア
- 英国
- イタリア
- フランス
- ドイツ
- アジア太平洋
- 中国
- 日本
- 韓国
- インド
- オーストラリア
- 中東・アフリカ
- サウジアラビア
- アラブ首長国連邦
- トルコ
- 南アフリカ
- モロッコ
- ラテンアメリカ
- ブラジル
- メキシコ
- アルゼンチン
第7章 企業プロファイル
- AmeriGas
- China Petroleum
- CIMC ENRIC
- CLW Group
- Emirates Gas
- Energy Transfer
- Flogas
- Modern Welding
- Omera
- Oiltanking
- Pertamina
- Petredec
- Royal Vopak
- TotalEnergies
- TransTech Energy
- Vitol
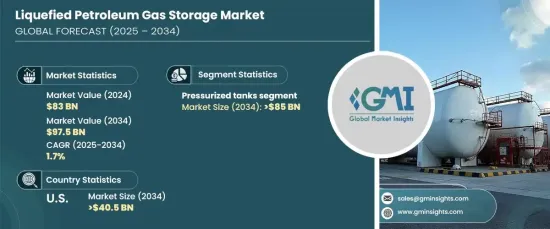
The Global Liquefied Petroleum Gas Storage Market was valued at USD 83 billion in 2024 and is expected to grow steadily at a CAGR of 1.7% from 2025 to 2034. Rapid urbanization and the increasing demand for clean, efficient fuel alternatives to minimize environmental impact are key drivers propelling the market forward. As governments worldwide push for broader access to LPG, various initiatives have been introduced to enhance its availability, further boosting market expansion. These efforts, along with rising concerns over environmental sustainability, have given a significant push to the LPG storage market.
Additionally, governments are enforcing stricter regulations and safety protocols, leading to investments in more advanced LPG storage solutions. Both government and private sectors are investing in state-of-the-art storage technologies, integrating safety features such as leak detection systems and pressure monitoring, which further strengthens the market. The growing focus on energy efficiency, safety, and sustainability is fostering the development of innovative storage technologies designed to meet the growing demand for LPG.
| Market Scope | |
|---|---|
| Start Year | 2024 |
| Forecast Year | 2025-2034 |
| Start Value | $83 Billion |
| Forecast Value | $97.5 Billion |
| CAGR | 1.7% |
The pressurized tanks segment is predicted to surpass USD 85 billion by 2034. These tanks play a crucial role in the safe storage and distribution of LPG, as they maintain the gas in its liquid state under pressure, offering high energy density and efficient transport options. Pressurized tanks are highly effective in holding large quantities of LPG in compact spaces, making them ideal for both residential and industrial use. Their adaptability, combined with new technologies such as improved corrosion-resistant materials, insulation, and integrated monitoring systems, will drive the growth of this segment in the coming years.
In the United States, the LPG storage market is projected to exceed USD 40.5 billion by 2034. The country's abundance of shale gas, coupled with a rising demand for LPG driven by population growth and higher energy consumption, is fostering increased LPG production. Moreover, the shift toward cleaner energy sources has expanded the use of LPG across residential cooking, heating, and industrial sectors, leading to enhanced storage and distribution systems. Smart monitoring and automation systems are playing an essential role in improving operational efficiency and safety in LPG storage.
The implementation of government incentives, mandates, and policies promoting cleaner energy and reducing greenhouse gas emissions continues to shape the market. These regulations are providing additional opportunities for growth, further supporting the development of LPG storage infrastructure across various regions.
Table of Contents
Chapter 1 Methodology & Scope
- 1.1 Market definitions
- 1.2 Base estimates & calculations
- 1.3 Forecast calculation
- 1.4 Data sources
- 1.4.1 Primary
- 1.4.2 Secondary
- 1.4.2.1 Paid
- 1.4.2.2 Public
Chapter 2 Executive Summary
- 2.1 Industry synopsis, 2021 - 2034
Chapter 3 Industry Insights
- 3.1 Industry ecosystem analysis
- 3.2 Regulatory landscape
- 3.3 Industry impact forces
- 3.3.1 Growth drivers
- 3.3.2 Industry pitfalls & challenges
- 3.4 Growth potential analysis
- 3.5 Porter's analysis
- 3.5.1 Bargaining power of suppliers
- 3.5.2 Bargaining power of buyers
- 3.5.3 Threat of new entrants
- 3.5.4 Threat of substitutes
- 3.6 PESTEL analysis
Chapter 4 Competitive Landscape, 2024
- 4.1 Introduction
- 4.2 Strategic dashboard
- 4.3 Innovation & sustainability landscape
Chapter 5 Market Size and Forecast, By Storage Type, 2021 – 2034 (USD Billion, Million Barrels)
- 5.1 Key trends
- 5.2 Pressurized tanks
- 5.3 Refrigerated tanks
Chapter 6 Market Size and Forecast, By Region, 2021 – 2034 (USD Billion, Million Barrels)
- 6.1 Key trends
- 6.2 North America
- 6.2.1 U.S.
- 6.2.2 Canada
- 6.3 Europe
- 6.3.1 Spain
- 6.3.2 Russia
- 6.3.3 UK
- 6.3.4 Italy
- 6.3.5 France
- 6.3.6 Germany
- 6.4 Asia Pacific
- 6.4.1 China
- 6.4.2 Japan
- 6.4.3 South Korea
- 6.4.4 India
- 6.4.5 Australia
- 6.5 Middle East & Africa
- 6.5.1 Saudi Arabia
- 6.5.2 UAE
- 6.5.3 Turkey
- 6.5.4 South Africa
- 6.5.5 Morocco
- 6.6 Latin America
- 6.6.1 Brazil
- 6.6.2 Mexico
- 6.6.3 Argentina
Chapter 7 Company Profiles
- 7.1 AmeriGas
- 7.2 China Petroleum
- 7.3 CIMC ENRIC
- 7.4 CLW Group
- 7.5 Emirates Gas
- 7.6 Energy Transfer
- 7.7 Flogas
- 7.8 Modern Welding
- 7.9 Omera
- 7.10 Oiltanking
- 7.11 Pertamina
- 7.12 Petredec
- 7.13 Royal Vopak
- 7.14 TotalEnergies
- 7.15 TransTech Energy
- 7.16 Vitol

