
飲料パッケージング市場のビジネスチャンス、成長要因、業界動向分析、および2026年~2035年の予測
Beverage Packaging Market Opportunity, Growth Drivers, Industry Trend Analysis, and Forecast 2026 - 2035- 発行日
- ページ情報
- 英文 180 Pages
- 納期
- 2~3営業日
- 商品コード
- 1982365
- カスタマイズ可能 お客様のご希望に応じて、既存データの加工や未掲載情報(例:国別セグメント)の追加などの対応が可能です。詳細はお問い合わせください。
- 翻訳ツール提供対象 PDF対応AI翻訳ツールの無料貸し出しサービスのご利用が可能です
世界の飲料包装市場は、2025年に1,747億米ドルと評価され、CAGR 5.6%で成長し、2035年までに2,953億米ドルに達すると推定されています。
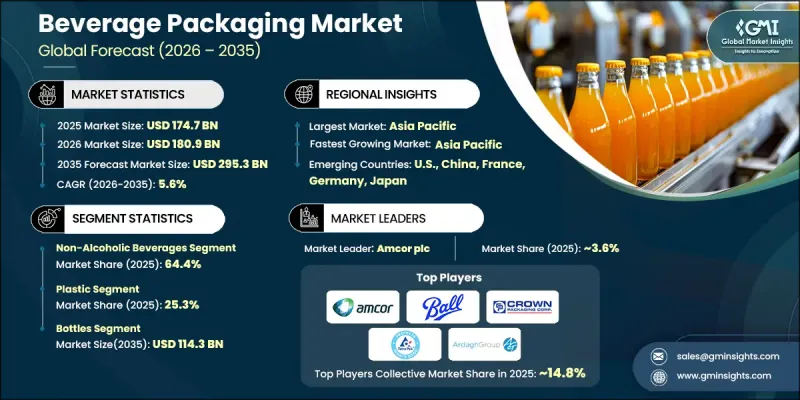
この力強い成長は、先進国および新興国におけるパッケージ飲料の消費拡大に牽引されています。急速な都市化、忙しい消費者のライフスタイル、そして便利で1回分用、持ち運び可能な飲料形態への嗜好の高まりが、軽量ボトル、缶、紙パック、フレキシブルパウチの需要を加速させています。ボトル入り飲料水、炭酸飲料、即飲用ティー・コーヒー、健康志向飲料の販売拡大が、市場の持続的な勢いを支えています。メーカー各社は、製品の安全性を高め、保存期間を延長し、ブランドの認知度を向上させるパッケージデザインに注力しています。同時に、素材や製造プロセスにおける技術の進歩により、効率化とコスト最適化が進んでいます。プレミアム化、カスタマイズ化、機能性飲料の提供へのシフトは、引き続きパッケージングの革新を促進しています。小売市場への浸透が進み、現代的な流通チャネルが拡大していることも、世界の需要をさらに強めています。全体として、飲料パッケージング業界は、消費者の嗜好の変化、規制動向、およびバリューチェーン全体での継続的な素材の革新に支えられ、安定した1桁台半ばの成長が見込まれています。
| 市場範囲 | |
|---|---|
| 開始年 | 2025 |
| 予測期間 | 2026年~2035年 |
| 開始時の市場規模 | 1,747億米ドル |
| 予測額 | 2,953億米ドル |
| CAGR | 5.6% |
環境の持続可能性は、飲料パッケージング市場情勢を再構築する上で極めて重要な役割を果たしています。環境への影響に関する規制の強化や消費者の意識の高まりにより、企業はリサイクル可能、生分解性、低排出のパッケージング素材の採用を促進しています。Amcor plc、Ball Corporation、Tetra Pak International S.A.などの業界リーダーは、持続可能性の目標に沿うため、循環型経済の取り組み、軽量化ソリューション、および再生素材の含有率向上に投資しています。並行して、スマートでコネクテッドな包装技術も注目を集めています。デジタルラベリング、トレーサビリティツール、インタラクティブな包装形式といった機能は、サプライチェーンの透明性を高め、特にプレミアム飲料カテゴリーにおいて消費者のエンゲージメントを強化しています。さらに、EコマースやD2C(消費者直販)流通モデルの急速な台頭により、メーカーは輸送中の耐久性、構造的強度、および保存期間の性能を向上させた包装の設計を迫られています。
アルコール飲料セグメントは、2026年から2035年にかけてCAGR4.7%で成長すると予想されています。プレミアムアルコール飲料や、手軽に飲める即飲形式への需要の高まりが、ガラス製およびリサイクル可能な金属製パッケージソリューションの革新を牽引しています。可処分所得の増加、消費パターンの変化、そして美的魅力のあるパッケージへの需要が、このセグメントの成長に寄与しています。持続可能で軽量なパッケージ形態に加え、オンライン小売流通の拡大が、消費者志向かつ環境に配慮したパッケージデザインへの投資を促進しています。
プラスチックセグメントは、2025年に25.3%のシェアを占めました。その成長は、コスト効率、軽量性、およびPET素材が高速生産ラインと互換性があることによって支えられています。プラスチック包装は、世界中でボトル入り飲料水、ソフトドリンク、機能性飲料のカテゴリーにおいて広く使用され続けています。使用済みリサイクル素材の利用拡大とリサイクル技術の進歩により、持続可能性のパフォーマンスが強化されています。また、進行中の軽量化の取り組みにより、原材料の消費量が削減され、輸送効率が最適化されています。
2025年、北米の飲料包装市場は21.3%のシェアを占めました。地域的な拡大は、持続可能でリサイクル可能な包装形態への嗜好の高まりに加え、利便性の高い持ち運び用飲料ソリューションへの強い需要によって牽引されています。高度な製造能力と継続的な製品のプレミアム化が、市場の発展を後押ししています。軽量PETボトル、アルミ缶、およびスマート包装技術への投資は、業務効率と消費者との関わりを向上させています。機能性飲料や即飲型製品の成長は、米国、カナダ、メキシコ全域において、パッケージングの革新をさらに加速させています。
よくあるご質問
目次
第1章 調査手法と範囲
第2章 エグゼクティブサマリー
第3章 業界考察
- エコシステム分析
- サプライヤーの情勢
- 利益率分析
- コスト構造
- 各段階における付加価値
- バリューチェーンに影響を与える要因
- ディスラプション
- 業界への影響要因
- 促進要因
- サステナビリティと環境に優しいパッケージングへの需要の高まり
- 即飲(RTD)飲料の消費拡大
- プレミアム飲料に対する消費者の嗜好の高まり
- 独自のブランディングとパーソナライズされたパッケージングへの注力
- 都市化の進展とライフスタイルの変化
- 業界の潜在的リスク&課題
- 原材料コストの上昇
- 世界のリサイクル能力の不均一性
- 市場機会
- 循環型経済およびクローズドループ・ソリューションの導入
- スマートかつインタラクティブなパッケージング技術の統合
- 促進要因
- 規制情勢
- ポーター分析
- PESTEL分析
- 技術とイノベーションの動向
- 現在の技術動向
- 新興技術
- 新興ビジネスモデル
- コンプライアンス要件
- 特許および知的財産分析
- 地政学的および貿易の動向
第4章 競合情勢
- イントロダクション
- 企業の市場シェア分析
- 地域別
- 主要企業の競合ベンチマーキング
- 財務実績の比較
- 売上高
- 利益率
- 研究開発(R&D)
- 製品ポートフォリオの比較
- 製品ラインナップの幅
- 技術
- イノベーション
- 地域展開の比較
- 世界展開の分析
- サービスネットワークのカバー範囲
- 地域別市場浸透率
- 競合ポジショニングマトリックス
- リーダー
- チャレンジャー
- フォロワー
- ニッチプレイヤー
- 戦略的展望マトリックス
- 財務実績の比較
- 主な発展, 2022-2025
- 合併・買収
- パートナーシップおよび提携
- 技術的進歩
- 事業拡大および投資戦略
- デジタルトランスフォーメーションの取り組み
- 新興/スタートアップ競合企業の動向
第5章 市場推計・予測:包装タイプ別、2022-2035
- 硬質包装
- 半硬質包装
- フレキシブル包装
第6章 市場推計・予測:製品タイプ別、2022-2035
- ボトル
- 缶
- カートン
- パウチ・サシェ
- 樽・バレル
- その他
第7章 市場推計・予測:材料別、2022-2035
- プラスチック
- ガラス
- 金属
- 紙・板紙
- その他
第8章 市場推計・予測:飲料種別、2022-2035
- ノンアルコール飲料
- アルコール飲料
第9章 市場推計・予測:エンドユーザー産業別、2022-2035
- 無菌包装
- ホットフィル包装
- 低温充填および従来型包装
第10章 市場推計・予測:地域別、2022-2035
- 北米
- 米国
- カナダ
- 欧州
- ドイツ
- 英国
- フランス
- スペイン
- イタリア
- オランダ
- アジア太平洋地域
- 中国
- インド
- 日本
- オーストラリア
- 韓国
- ラテンアメリカ
- ブラジル
- メキシコ
- アルゼンチン
- 中東・アフリカ
- 南アフリカ
- サウジアラビア
- アラブ首長国連邦
第11章 企業プロファイル
- Amcor plc
- Ardagh Group S.A.
- Ball Corporation
- CANPACK
- CCL Container
- CPMC Holdings
- Crown
- Graham Packaging
- Graphic Packaging International, LLC
- Novelis
- Plastipak Holdings, Inc.
- SIG.
- Silgan Plastics
- Smurfit Westrock
- Stora Enso
- Tetra Pak International S.A.
- Visy
- 発行日
- 発行
- Global Market Insights Inc.
- ページ情報
- 英文 180 Pages
- 納期
- 2~3営業日


