
キャップとクロージャーの市場機会と促進要因、業界動向分析、2025年~2034年予測
Caps and Closures Market Opportunity, Growth Drivers, Industry Trend Analysis, and Forecast 2025 - 2034- 発行日
- ページ情報
- 英文 140 Pages
- 納期
- 2~3営業日
- 商品コード
- 1721573
- カスタマイズ可能 お客様のご希望に応じて、既存データの加工や未掲載情報(例:国別セグメント)の追加などの対応が可能です。詳細はお問い合わせください。
- 翻訳ツール提供対象 PDF対応AI翻訳ツールの無料貸し出しサービスのご利用が可能です
概要
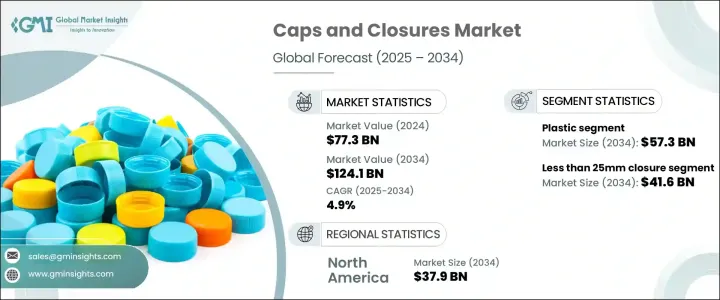
世界のキャップとクロージャー市場は、2024年に773億米ドルと評価され、CAGR 4.9%で成長し、2034年には1,241億米ドルに達すると推定されています。
この上昇動向は、業界全体で安全で持続可能なパッケージングソリューションの重要性が高まっていることを反映しています。包装産業が進化を続ける中、キャップとクロージャーは製品の完全性を確保し、保存期間を延ばし、消費者の利便性を高める上で極めて重要な役割を果たしています。世界人口の着実な増加、都市化、工業化に伴い、変化する消費者ニーズを満たす革新的なパッケージングへの需要は新たな高みに達しています。市場参入企業は、使いやすさ、製品保護、環境責任を確保するスマートなデザインや素材に投資することで、こうしたシフトに対応しています。消費者が携帯用、リシーラブル、タンパーエビデントパッケージングに傾倒するにつれ、キャップとクロージャーは飲食品、パーソナルケア、医薬品、家庭用品などの分野で不可欠なものとなってきています。外出の多いライフスタイルの普及とeコマースの急増は、耐久性と機能性を兼ね備えた包装部品へのニーズをさらに高めています。企業が革新を続け、新たな市場の需要に応えることで、この業界は大きく発展する態勢を整えています。
包装分野は、多様な食品や飲食品の消費増に後押しされ、この成長に大きく貢献しています。キャップとクロージャーは、開封や再封が容易な使いやすい機能を提供することで、包装において重要な役割を果たしています。鮮度を維持し、製品の品質を保ち、内容物を腐敗、汚染、外的要因から守る気密バリアを提供します。特に消耗品において安全性と衛生への懸念が高まるにつれ、高性能クロージャーの重要性はより顕著になっています。
| 市場範囲 | |
|---|---|
| 開始年 | 2024 |
| 予測年 | 2025-2034 |
| 開始金額 | 773億米ドル |
| 予測金額 | 1,241億米ドル |
| CAGR | 4.9% |
市場は素材タイプ別に区分され、プラスチックが最も優勢な素材カテゴリーとして浮上しています。2024年のプラスチック分野の売上高は350億米ドルで、2034年には573億米ドルに達すると予測されています。プラスチック製クロージャーは、その費用対効果、軽量性、優れた密封性により広く支持されています。高密度ポリエチレン(HDPE)や低密度ポリエチレン(LDPE)のような素材は、透湿性が低く、湿気やガスを効果的に遮断して製品の完全性を維持するため、広く使用されています。
クロージャーのサイズのうち、「25mm未満」のカテゴリーは2024年に238億米ドルを占めました。この分野は主に、食品、飲食品、パーソナルケア用品全般にわたって、コンパクトで1回分の包装に対する消費者の嗜好の高まりによって牽引されています。このような小型のクロージャーは、利便性、ポーションコントロール、移動性をサポートし、現代的でペースの速いライフスタイルに適しています。
北米キャップとクロージャー市場は2024年に262億米ドルを生み出し、2034年には379億米ドルに達すると予測されています。同地域の可処分所得の高さ、包装商品への需要、包装技術革新への注力などが、この着実な拡大を後押ししています。
世界のキャップとクロージャー市場の主要企業には、Crown Holdings Inc.、Amcor plc、AptarGroup Inc.、Silgan Holdings Inc.、Guala Closures Group、Berry Global Group Inc.、Plastipak Packaging Inc.、Kaufman Container、Nova-Pack、Pont Packaging、RPC Group、Frapak Packaging、Nippon Closures Co Ltd.、Pano Cap、Uchiyama Manufacturing Corp.などがあります。主要企業は、進化する消費者と環境の期待に応えるため、リサイクル可能な素材や生分解性素材を製品ラインに組み込むことで、イノベーション、持続可能性、ポートフォリオの多様化を優先しています。
目次
第1章 調査手法と範囲
第2章 エグゼクティブサマリー
第3章 業界考察
- エコシステム分析
- バリューチェーンに影響を与える要因
- 利益率分析
- ディスラプション
- 将来の展望
- サプライヤーの情勢
- 製造業者
- 販売代理店
- 小売業者
- テクノロジーとイノベーションの情勢
- 主なニュースと取り組み
- 規制情勢
- 影響要因
- 促進要因
- 利便性とパッケージソリューションの需要の高まり
- 食品・飲料業界の成長
- 持続可能で環境に優しい包装の採用
- 医薬品および栄養補助食品部門の拡大
- 業界の潜在的リスク&課題
- 原材料価格の変動
- プラスチックに関する環境問題
- 促進要因
- 成長可能性分析
- 価格分析
- ポーターの分析
- PESTEL分析
第4章 競合情勢
- イントロダクション
- 企業の市場シェア分析
- 競合ポジショニングマトリックス
- 戦略的展望マトリックス
第5章 市場推計・予測:材料別、2021-2034
- 主要動向
- プラスチック
- 金属
- ゴム
- コルク
- ガラス
- その他
第6章 市場推計・予測:クロージャーサイズ別、2021-2034
- 主要動向
- 25mm未満
- 25mmから49mm
- 50mmから69mm
- 70mmから99mm
- 100mm以上
第7章 市場推計・予測:最終用途別、2021-2034
- 主要動向
- 医薬品および栄養補助食品
- 飲食品
- 消費財
- パーソナルケアと化粧品
- その他
第8章 市場推計・予測:流通チャネル別、2021-2034
- 主要動向
- 直接販売
- 間接販売
第9章 市場推計・予測:地域別、2021-2034
- 主要動向
- 北米
- 米国
- カナダ
- 欧州
- 英国
- ドイツ
- フランス
- イタリア
- スペイン
- ロシア
- アジア太平洋地域
- 中国
- インド
- 日本
- 韓国
- オーストラリア
- ラテンアメリカ
- ブラジル
- メキシコ
- 中東・アフリカ
- 南アフリカ
- サウジアラビア
- アラブ首長国連邦
第10章 企業プロファイル
- Amcor plc
- Crown Holdings Inc
- AptarGroup Inc.
- Berry Global Group Inc
- Silgan Holdings Inc
- Guala Closures Group
- Plastipak Packaging Inc
- Kaufman Container
- RPC Group
- Nova-Pack
- Pont Packaging
- Frapak Packaging
- Pano Cap
- Nippon Closures Co Ltd
- Uchiyama Manufacturing Corp
目次
The Global Caps and Closures Market was valued at USD 77.3 billion in 2024 and is estimated to grow at a CAGR of 4.9% to reach USD 124.1 billion by 2034. This upward trend reflects the increasing importance of secure and sustainable packaging solutions across industries. As the packaging industry continues to evolve, caps and closures are playing a pivotal role in ensuring product integrity, extending shelf life, and enhancing consumer convenience. With the steady rise in global population, urbanization, and industrialization, the demand for innovative packaging that meets changing consumer needs is reaching new heights. Market participants are aligning with these shifts by investing in smart designs and materials that ensure ease of use, product protection, and environmental responsibility. As consumers lean more towards portable, resealable, and tamper-evident packaging, caps and closures are becoming indispensable in sectors like food and beverage, personal care, pharmaceuticals, and household goods. The growing prevalence of on-the-go lifestyles and the surge in e-commerce are further bolstering the need for packaging components that are both durable and functional. This industry is poised for significant advancement as companies continue to innovate and cater to emerging market demands.
The packaging sector has been a major contributor to this growth, fueled by the rising consumption of diverse food and beverage products. Caps and closures serve a crucial function in packaging by offering user-friendly features that allow easy opening and resealing. They help maintain freshness, preserve product quality, and offer an airtight barrier that safeguards contents from spoilage, contamination, and external elements. As safety and hygiene concerns mount, particularly in consumables, the relevance of high-performance closures becomes more pronounced.
| Market Scope | |
|---|---|
| Start Year | 2024 |
| Forecast Year | 2025-2034 |
| Start Value | $77.3 Billion |
| Forecast Value | $124.1 Billion |
| CAGR | 4.9% |
The market is segmented by material type, with plastic emerging as the most dominant material category. In 2024, the plastic segment generated USD 35 billion and is forecast to reach USD 57.3 billion by 2034. Plastic closures are widely favored due to their cost-effectiveness, lightweight nature, and excellent sealing properties. Materials like High-Density Polyethylene (HDPE) and Low-Density Polyethylene (LDPE) are extensively used for their low permeability, effectively blocking moisture and gases to maintain product integrity.
Among closure sizes, the "less than 25mm" category accounted for USD 23.8 billion in 2024. This segment is primarily driven by growing consumer preference for compact, single-serve packaging across food, beverages, and personal care items. These smaller closures support convenience, portion control, and mobility-traits that resonate well with modern, fast-paced lifestyles.
The North America Caps and Closures Market generated USD 26.2 billion in 2024 and is expected to hit USD 37.9 billion by 2034. The region's high disposable income, demand for packaged goods, and focus on packaging innovation are driving this steady expansion.
Key players in the global caps and closures market include Crown Holdings Inc., Amcor plc, AptarGroup Inc., Silgan Holdings Inc., Guala Closures Group, Berry Global Group Inc., Plastipak Packaging Inc., Kaufman Container, Nova-Pack, Pont Packaging, RPC Group, Frapak Packaging, Nippon Closures Co Ltd, Pano Cap, and Uchiyama Manufacturing Corp. Leading companies are prioritizing innovation, sustainability, and portfolio diversification by integrating recyclable and biodegradable materials into their product lines to meet evolving consumer and environmental expectations.
Table of Contents
Chapter 1 Methodology & Scope
- 1.1 Research design
- 1.1.1 Research approach
- 1.1.2 Data collection methods
- 1.2 Base estimates and calculations
- 1.2.1 Base year calculation
- 1.2.2 Key trends for market estimates
- 1.3 Forecast model
- 1.4 Primary research & validation
- 1.4.1 Primary sources
- 1.4.2 Data mining sources
- 1.4.2.1 Market definitions
Chapter 2 Executive Summary
- 2.1 Industry 3600 synopsis, 2021-2034
Chapter 3 Industry Insights
- 3.1 Industry ecosystem analysis
- 3.1.1 Factors affecting the value chain
- 3.1.2 Profit margin analysis
- 3.1.3 Disruptions
- 3.1.4 Future outlook
- 3.1.5 Supplier landscape
- 3.1.6 Manufacturers
- 3.1.7 Distributors
- 3.1.8 Retailers
- 3.1.9 Technology & innovation landscape
- 3.1.10 Key news & initiatives
- 3.1.11 Regulatory landscape
- 3.2 Impact forces
- 3.2.1 Growth drivers
- 3.2.1.1 Growing demand for convenience and packaging solutions
- 3.2.1.2 Growth in the food and beverage industry
- 3.2.1.3 Adoption of sustainable and eco-friendly packaging
- 3.2.1.4 Expansion of pharmaceuticals and nutraceuticals sector
- 3.2.2 Industry pitfalls & challenges
- 3.2.2.1 Fluctuations in raw material prices
- 3.2.2.2 Environmental concerns related to plastics
- 3.2.1 Growth drivers
- 3.3 Growth potential analysis
- 3.4 Pricing analysis
- 3.5 Porter’s analysis
- 3.6 PESTEL analysis
Chapter 4 Competitive Landscape, 2024
- 4.1 Introduction
- 4.2 Company market share analysis
- 4.3 Competitive positioning matrix
- 4.4 Strategic outlook matrix
Chapter 5 Market Estimates & Forecast, By Material, 2021-2034 (USD Billion) (Million Units)
- 5.1 Key trends
- 5.2 Plastic
- 5.3 Metal
- 5.4 Rubber
- 5.5 Cork
- 5.6 Glass
- 5.7 Others
Chapter 6 Market Estimates & Forecast, By Closure Size, 2021-2034 (USD Billion) (Million Units)
- 6.1 Key trends
- 6.2 Less than 25mm
- 6.3 25mm to 49mm
- 6.4 50mm to 69mm
- 6.5 70mm to 99mm
- 6.6 100mm & above
Chapter 7 Market Estimates & Forecast, By End Use, 2021-2034 (USD Billion) (Million Units)
- 7.1 Key trends
- 7.2 Pharmaceuticals and nutraceuticals
- 7.3 Food and beverages
- 7.4 Consumer goods
- 7.5 Personal care and cosmetics
- 7.6 Others
Chapter 8 Market Estimates & Forecast, By Distribution Channel, 2021-2034 (USD Billion) (Million Units)
- 8.1 Key trends
- 8.2 Direct sales
- 8.3 Indirect sales
Chapter 9 Market Estimates & Forecast, By Region, 2021-2034 (USD Billion) (Million Units)
- 9.1 Key trends
- 9.2 North America
- 9.2.1 U.S.
- 9.2.2 Canada
- 9.3 Europe
- 9.3.1 UK
- 9.3.2 Germany
- 9.3.3 France
- 9.3.4 Italy
- 9.3.5 Spain
- 9.3.6 Russia
- 9.4 Asia Pacific
- 9.4.1 China
- 9.4.2 India
- 9.4.3 Japan
- 9.4.4 South Korea
- 9.4.5 Australia
- 9.5 Latin America
- 9.5.1 Brazil
- 9.5.2 Mexico
- 9.6 MEA
- 9.6.1 South Africa
- 9.6.2 Saudi Arabia
- 9.6.3 UAE
Chapter 10 Company Profiles
- 10.1 Amcor plc
- 10.2 Crown Holdings Inc
- 10.3 AptarGroup Inc.
- 10.4 Berry Global Group Inc
- 10.5 Silgan Holdings Inc
- 10.6 Guala Closures Group
- 10.7 Plastipak Packaging Inc
- 10.8 Kaufman Container
- 10.9 RPC Group
- 10.10 Nova-Pack
- 10.11 Pont Packaging
- 10.12 Frapak Packaging
- 10.13 Pano Cap
- 10.14 Nippon Closures Co Ltd
- 10.15 Uchiyama Manufacturing Corp
- 発行日
- 発行
- Global Market Insights Inc.
- ページ情報
- 英文 140 Pages
- 納期
- 2~3営業日