
|
市場調査レポート
商品コード
1666529
エネルギー管理システムの市場機会、成長促進要因、産業動向分析、2025年~2034年予測Energy Management Systems Market Opportunity, Growth Drivers, Industry Trend Analysis, and Forecast 2025 - 2034 |
||||||
カスタマイズ可能
|
|||||||
| エネルギー管理システムの市場機会、成長促進要因、産業動向分析、2025年~2034年予測 |
|
出版日: 2024年12月10日
発行: Global Market Insights Inc.
ページ情報: 英文 100 Pages
納期: 2~3営業日
|

全表示
- 概要
- 目次
世界のエネルギー管理システム市場は、2024年に411億米ドルとなり、2025年から2034年にかけてCAGR6.2%で成長すると予測されています。
この成長の背景には、世界のエネルギー需要の増加、環境政策の厳格化、業界全体におけるエネルギー効率向上への注目の高まりがあります。企業は、エネルギー使用を合理化し、運用経費を削減し、環境への影響を最小限に抑えるために、EMSソリューションに注目しています。IoT統合、AI主導の分析、クラウドベースのプラットフォームなどの先進技術は、EMSの能力をさらに向上させ、リアルタイムのモニタリングと予知保全を可能にしています。
世界各国の政府は、さまざまな取り組みを通じて持続可能性を推進し、ISO 50001のような規格への準拠を奨励しています。こうした取り組みにより、商業、工業、公益事業などのセクターでEMSの導入が加速しています。再生可能エネルギーの統合が進み、スマートグリッドアプリケーションが拡大していることも、市場の成長を後押ししています。さらに、アジア太平洋の新興経済圏と先進経済圏における分散型エネルギー資源(DER)の普及がEMSの需要を押し上げ、エネルギー効率と持続可能性を達成するための礎石としての役割を確固たるものにしています。
| 市場範囲 | |
|---|---|
| 開始年 | 2024 |
| 予測年 | 2025年~2034年 |
| 開始金額 | 411億米ドル |
| 予測金額 | 763億米ドル |
| CAGR | 6.2% |
サービス分野では、産業用エネルギー管理システム(IEMS)市場が2034年までに330億米ドルを超えると予想されています。IEMSは、エネルギー消費を監視、制御、最適化するツールを提供するため、エネルギー集約型産業では不可欠なものとなっています。これらのソリューションは、コスト削減と業務効率の向上に役立つと同時に、カーボンフットプリントを最小限に抑えることで持続可能性への取り組みを支援します。産業活動が世界的に拡大するにつれて、IEMSの採用は着実に拡大すると予測されます。
EMS市場のソフトウェアコンポーネントは、2034年までCAGR7.3%以上で成長すると見られています。ビッグデータ分析とリアルタイムモニタリング技術の急速な採用により、高度なEMSソフトウェアの需要が増加しています。これらのツールにより、企業はエネルギーデータを収集、分析、可視化し、より良い意思決定とエネルギー使用の改善を行うことができます。人工知能(AI)と機械学習(ML)の革新は、エネルギー管理手法をさらに変革しており、EMSソフトウェアを現代のエネルギー戦略に不可欠な要素にしています。
米国では、EMS市場は2034年までに187億米ドルを超えると予測されています。エネルギー効率と持続可能性を促進する規制措置が、企業にEMSソリューションの採用を促しています。国や州レベルの政策が省エネルギー技術の普及を後押しし、コンプライアンスを保証して産業全体の成長を促進しています。
目次
第1章 調査手法と調査範囲
- 市場の定義
- 基本推定と計算
- 予測計算
- データソース
- 一次
- 二次
- 有償
- 公的
第2章 エグゼクティブサマリー
第3章 業界洞察
- 業界エコシステム分析
- 規制状況
- 業界への影響要因
- 成長促進要因
- 業界の潜在的リスク・課題
- 成長ポテンシャル分析
- ポーター分析
- 供給企業の交渉力
- 買い手の交渉力
- 新規参入業者の脅威
- 代替品の脅威
- PESTEL分析
第4章 競合情勢
- 戦略ダッシュボード
- イノベーションと持続可能性の展望
第5章 市場規模・予測:サービス別、2021年~2034年
- 主要動向
- IEMS
- BEMS
- HEMS
第6章 市場規模・予測:コンポーネント別、2021年~2034年
- 主要動向
- 計測・フィールド機器
- ハードウェア
- ソフトウェア
- ネットワーク機器
- 制御システム
- センサー
- その他
第7章 市場規模・予測:用途別、2021年~2034年
- 主要動向
- 電力・エネルギー
- IT関連
- 製造業
- エンタープライズ
- ヘルスケア
- その他
第8章 市場規模・予測:地域別、2021年~2034年
- 主要動向
- 北米
- 米国
- カナダ
- メキシコ
- 欧州
- 英国
- フランス
- ドイツ
- イタリア
- ロシア
- スペイン
- アジア太平洋
- 中国
- オーストラリア
- インド
- 日本
- 韓国
- 中東・アフリカ
- サウジアラビア
- アラブ首長国連邦
- トルコ
- 南アフリカ
- エジプト
- ラテンアメリカ
- ブラジル
- アルゼンチン
第9章 企業プロファイル
- ABB
- C3.ai
- Dexma Sensors
- Eaton
- Emerson Electric
- ENGIE Impact
- eSight Energy
- General Electric
- GridPoint
- Honeywell
- IBM
- Ingersoll Rand
- Johnson Controls
- Mitsubishi Heavy Industries
- NX Technologies
- Optimum Energy
- Rockwell Automation
- Schneider Electric
- Siemens
- SkyFoundry
- Telkonet
- Toshiba
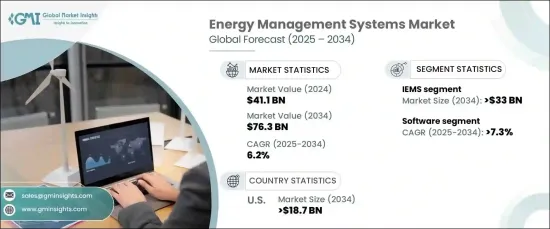
The Global Energy Management Systems Market, valued at USD 41.1 billion in 2024, is anticipated to grow at a CAGR of 6.2% between 2025 and 2034. This growth is fueled by increasing global energy needs, stricter environmental policies, and a growing focus on enhancing energy efficiency across industries. Companies are turning to EMS solutions to streamline energy usage, lower operational expenses, and minimize environmental impact. Advanced technologies, including IoT integration, AI-driven analytics, and cloud-based platforms, have further improved EMS capabilities, allowing for real-time monitoring and predictive maintenance.
Governments worldwide are promoting sustainability through various initiatives and encouraging adherence to standards like ISO 50001. These efforts are accelerating EMS adoption across sectors such as commercial, industrial, and utilities. The rising integration of renewable energy and the expansion of smart grid applications are also driving market growth. Additionally, emerging economies in Asia-Pacific and the widespread use of distributed energy resources (DERs) in advanced economies are bolstering demand for EMS, solidifying its role as a cornerstone for achieving energy efficiency and sustainability.
| Market Scope | |
|---|---|
| Start Year | 2024 |
| Forecast Year | 2025-2034 |
| Start Value | $41.1 Billion |
| Forecast Value | $76.3 Billion |
| CAGR | 6.2% |
In the services segment, the industrial energy management systems (IEMS) market is expected to exceed USD 33 billion by 2034. IEMS has become indispensable in energy-intensive industries as it offers tools to monitor, control, and optimize energy consumption. These solutions help reduce costs and enhance operational efficiency while supporting sustainability efforts by minimizing carbon footprints. As industrial operations expand globally, the adoption of IEMS is predicted to grow steadily.
The software component of the EMS market is set to grow at a CAGR of over 7.3% through 2034. The demand for advanced EMS software is increasing due to the rapid adoption of big data analytics and real-time monitoring technologies. These tools enable businesses to collect, analyze, and visualize energy data for better decision-making and improved energy usage. Innovations in artificial intelligence (AI) and machine learning (ML) are further transforming energy management practices, making EMS software a vital component of modern energy strategies.
In the U.S., the EMS market is projected to surpass USD 18.7 billion by 2034. Regulatory measures promoting energy efficiency and sustainability are encouraging businesses to adopt EMS solutions. National and state-level policies have driven widespread implementation of energy-saving technologies, ensuring compliance and fostering growth across industries.
Table of Contents
Chapter 1 Methodology & Scope
- 1.1 Market definitions
- 1.2 Base estimates & calculations
- 1.3 Forecast calculation
- 1.4 Data sources
- 1.4.1 Primary
- 1.4.2 Secondary
- 1.4.2.1 Paid
- 1.4.2.2 Public
Chapter 2 Executive Summary
- 2.1 Industry synopsis, 2021 - 2034
Chapter 3 Industry Insights
- 3.1 Industry ecosystem analysis
- 3.2 Regulatory landscape
- 3.3 Industry impact forces
- 3.3.1 Growth drivers
- 3.3.2 Industry pitfalls & challenges
- 3.4 Growth potential analysis
- 3.5 Porter's analysis
- 3.5.1 Bargaining power of suppliers
- 3.5.2 Bargaining power of buyers
- 3.5.3 Threat of new entrants
- 3.5.4 Threat of substitutes
- 3.6 PESTEL analysis
Chapter 4 Competitive landscape, 2024
- 4.1 Strategic dashboard
- 4.2 Innovation & sustainability landscape
Chapter 5 Market Size and Forecast, By Service, 2021 – 2034 (USD Million)
- 5.1 Key trends
- 5.2 IEMS
- 5.3 BEMS
- 5.4 HEMS
Chapter 6 Market Size and Forecast, By Component, 2021 – 2034 (USD Million)
- 6.1 Key trends
- 6.2 Metering & field equipment
- 6.3 Hardware
- 6.4 Software
- 6.5 Networking device
- 6.6 Control systems
- 6.7 Sensors
- 6.8 Others
Chapter 7 Market Size and Forecast, By Application, 2021 – 2034 (USD Million)
- 7.1 Key trends
- 7.2 Power & energy
- 7.3 IT
- 7.4 Manufacturing
- 7.5 Enterprise
- 7.6 Healthcare
- 7.7 Others
Chapter 8 Market Size and Forecast, By Region, 2021 – 2034 (USD Million)
- 8.1 Key trends
- 8.2 North America
- 8.2.1 U.S.
- 8.2.2 Canada
- 8.2.3 Mexico
- 8.3 Europe
- 8.3.1 UK
- 8.3.2 France
- 8.3.3 Germany
- 8.3.4 Italy
- 8.3.5 Russia
- 8.3.6 Spain
- 8.4 Asia Pacific
- 8.4.1 China
- 8.4.2 Australia
- 8.4.3 India
- 8.4.4 Japan
- 8.4.5 South Korea
- 8.5 Middle East & Africa
- 8.5.1 Saudi Arabia
- 8.5.2 UAE
- 8.5.3 Turkey
- 8.5.4 South Africa
- 8.5.5 Egypt
- 8.6 Latin America
- 8.6.1 Brazil
- 8.6.2 Argentina
Chapter 9 Company Profiles
- 9.1 ABB
- 9.2 C3.ai
- 9.3 Dexma Sensors
- 9.4 Eaton
- 9.5 Emerson Electric
- 9.6 ENGIE Impact
- 9.7 eSight Energy
- 9.8 General Electric
- 9.9 GridPoint
- 9.10 Honeywell
- 9.11 IBM
- 9.12 Ingersoll Rand
- 9.13 Johnson Controls
- 9.14 Mitsubishi Heavy Industries
- 9.15 NX Technologies
- 9.16 Optimum Energy
- 9.17 Rockwell Automation
- 9.18 Schneider Electric
- 9.19 Siemens
- 9.20 SkyFoundry
- 9.21 Telkonet
- 9.22 Toshiba

