|
|
市場調査レポート
商品コード
1325915
米糠誘導体市場- 製品別、用途別、世界予測、2023-2032年Rice Bran Derivatives Market - By Product (Rice Bran Oil, Rice Bran Meal), By Application (Food & Beverage Industry, Animal Feed, Cosmetics & Personal Care, Biofuel, Pharmaceuticals & Nutraceuticals, Others) & Global Forecast, 2023-2032 |
||||||
|
|
|||||||
カスタマイズ可能
|
|||||||


| 米糠誘導体市場- 製品別、用途別、世界予測、2023-2032年 |
|
出版日: 2023年05月11日
発行: Global Market Insights Inc.
ページ情報: 英文 230 Pages
納期: 2~3営業日
|

- 全表示
- 概要
- 図表
- 目次
世界の米糠誘導体産業規模は2023年から2032年にかけて、まずまずのCAGRで拡大します。
米ぬか抽出技術と持続可能な生産方法の進歩が、多様な産業における米糠誘導体の需要をさらに促進しています。例えば、非接触抽出法である超臨界流体抽出(SFE)は、二酸化炭素などの超臨界流体を使用して米ぬかから油を抽出します。SFEは従来の溶媒抽出法よりも効率的で環境に優しいです。
米ぬか油や米ぬかタンパク質のような米糠誘導体の栄養的利点に対する認識の高まりが、飲食品業界における米糠誘導体の採用を後押ししています。これらの誘導体には抗酸化物質、ビタミン、必須脂肪酸が豊富に含まれており、健康志向の消費者にアピールしています。化粧品や動物飼料を含む様々な用途で、天然素材や植物由来素材への需要が高まっていることが、市場の拡大を後押ししています。
米糠誘導体の世界市場は、製品、用途、地域によって分類されます。
製品別では、米ぬか粕が2032年までに大きな市場シェアを占めると思われます。米ぬか油抽出の製品別である米ぬか粕は、タンパク質、繊維質、必須栄養素が豊富で、動物用飼料の貴重な原料となっています。その栄養プロファイルは家畜の健康増進と成長に貢献し、動物栄養産業での採用を促進しています。さらに、持続可能な天然飼料原料への注目の高まりが米ぬかミールの魅力を高め、市場での需要をさらに押し上げています。
用途に関しては、飲食品セグメントは2032年までに緩やかな進展を示すと思われます。米ぬか油のような米糠誘導体は、その健康上の利点と様々な料理用途での汎用性により、食品業界で人気を集めています。高い発煙点とマイルドな風味で知られる米ぬか油は、調理、ベーキング、フライなどの用途で使用されることが増えています。また、コレステロール低下作用や栄養価の高さから、健康志向の消費者にとって魅力的な代替品となっており、飲食品分野における米糠誘導体の需要を牽引しています。
地域別では、北米の米糠誘導体市場は、消費者の健康志向の高まりと、天然で栄養価の高い食品素材への関心の高まりにより、高い発展の可能性を秘めています。米ぬか油や米ぬかタンパク質などの米糠誘導体は、その数々の健康上の利点から人気を集めています。加えて、植物ベースの食生活の普及とクリーンラベル製品に対する需要が、市場の成長をさらに後押ししています。さらに、この地域では動物栄養産業が盛んであるため、家畜飼料の貴重な成分として米糠誘導体の需要が高まっています。
目次
第1章 調査手法と調査範囲
第2章 エグゼクティブサマリー
第3章 米糠誘導体の世界産業洞察
- 業界セグメンテーション
- 産業エコシステム
- メーカー
- ベンダー・マトリックス
- 利益率分析
- 各段階での付加価値
- COVID-19が業界のバリューチェーンに与える影響
- 製品情勢
- 特許分析
- 規制状況
- 価格分析:地域別
- 北米
- 欧州
- APAC
- ラテンアメリカ
- MEA
- コスト構造分析、2022年
- 業界への影響要因
- 促進要因
- 飲食品用途での米糠誘導体の利用拡大
- 米糠誘導体が提供する様々な健康効果による需要の増加
- 落とし穴と課題
- 限られた消費者意識
- 促進要因
- 技術革新と持続可能性
- 成長の可能性分析、2022年
- ポーター分析
- PESTEL分析
- COVID-19の米糠誘導体市場への影響
- ロシア・ウクライナ戦争が米糠誘導体市場に与える影響
第4章 競合情勢、2022年
- イントロダクション
- 地域別企業シェア分析(2022年)
- 主要市場プレイヤーの競合分析
- 競合のポジショニング・マトリックス
- 戦略的展望マトリックス
第5章 米糠誘導体の世界市場:製品別、2018年~2032年
- 米ぬか油
- 米ぬかミール
第6章 米糠誘導体の世界市場:用途別、2018年~2032年
- 飲食品産業
- 動物飼料
- 化粧品・パーソナルケア
- バイオ燃料
- 医薬品・栄養補助食品
- その他
第7章 米糠誘導体の世界市場:地域別、2018年~2032年
- 北米
- 米国
- カナダ
- 欧州
- ドイツ
- 英国
- フランス
- ロシア
- イタリア
- スペイン
- アジア太平洋
- 中国
- インド
- 日本
- 韓国
- インドネシア
- マレーシア
- ラテンアメリカ(LATAM)
- ブラジル
- メキシコ
- 中東・アフリカ(MEA)
- 南アフリカ
- サウジアラビア
- アラブ首長国連邦
第8章 企業プロファイル
- Riceland Foods, Inc.
- Wilmar International Ltd.
- Archer Daniels Midland Company
- BCL Industries & Infrastructure Ltd
- A.P. Refinery Pvt. Ltd.
- Kaisuri Co., Ltd.
- Agrotech International Ltd
- RiceBran Technologies
- Golden Grain Group Limited
- Agro Tech Foods Ltd.
Data Tables
- TABLE 1 Industry glossary
- TABLE 2 Global Rice Bran Derivatives market, 2018 - 2032, (Kilo Tons), (USD Million)
- TABLE 3 Global Rice Bran Derivatives market, by product, 2018 - 2032 (Kilo Tons)
- TABLE 4 Global Rice Bran Derivatives market, by product, 2018 - 2032 (USD Million)
- TABLE 5 Global Rice Bran Derivatives market, by application, 2018 - 2032 (Kilo Tons)
- TABLE 6 Global Rice Bran Derivatives market, by application, 2018 - 2032 (USD Million)
- TABLE 7 Global Rice Bran Derivatives market, by region, 2018 - 2032 (Kilo Tons)
- TABLE 8 Global Rice Bran Derivatives market, by region, 2018 - 2032 (USD Million)
- TABLE 9 Rice Bran Derivatives market estimates and forecast, for rice bran oil, 2018 - 2032 (Kilo Tons), (USD Million)
- TABLE 10 Million)
- TABLE 11 Rice Bran Derivatives market estimates and forecast, for rice bran oil, by region, 2018 - 2032 (Kilo Tons)
- TABLE 12 Tons)
- TABLE 13 Million)
- TABLE 14 Rice Bran Derivatives market estimates and forecast, for rice bran oil, by region, 2018 - 2032 (USD Million)
- TABLE 15 Rice Bran Derivatives market estimates and forecast, for rice bran meal, 2018 - 2032 (Kilo Tons), (USD Million)
- TABLE 16 Rice Bran Derivatives market estimates and forecast, for rice bran meal, by region, 2018 - 2032 (Kilo Tons)
- TABLE 17 Rice Bran Derivatives market estimates and forecast, for rice bran meal, by region, 2018 - 2032 (USD Million)
- TABLE 18 Rice Bran Derivatives market estimates and forecast, for food & beverages, 2018 - 2032 (Kilo Tons), (USD Million)
- TABLE 19 Rice Bran Derivatives market estimates and forecast, for food & beverages, by region, 2018 - 2032 (Kilo Tons)
- TABLE 20 Rice Bran Derivatives market estimates and forecast, for food & beverages, by region, 2018 - 2032 (USD Million)
- TABLE 21 Rice Bran Derivatives market estimates and forecast, for animal feed, 2018 - 2032 (Kilo Tons), (USD Million)
- TABLE 22 Rice Bran Derivatives market estimates and forecast, for animal feed, by region, 2018 - 2032 (Kilo Tons)
- TABLE 23 Rice Bran Derivatives market estimates and forecast, for animal feed, by region, 2018 - 2032 (USD Million)
- TABLE 24 Rice Bran Derivatives market estimates and forecast, for cosmetics & personal care, 2018 - 2032 (Kilo Tons), (USD Million)
- TABLE 25 Rice Bran Derivatives market estimates and forecast, for cosmetics & personal care, by region, 2018 - 2032 (Kilo Tons)
- TABLE 26 Rice Bran Derivatives market estimates and forecast, for cosmetics & personal care, by region, 2018 - 2032 (USD Million)
- TABLE 27 Rice Bran Derivatives market estimates and forecast, for biofuel, 2018 - 2032 (Kilo Tons), (USD Million)
- TABLE 28 Rice Bran Derivatives market estimates and forecast, for biofuel, by region, 2018 - 2032 (Kilo Tons)
- TABLE 29 Rice Bran Derivatives market estimates and forecast, for biofuel, by region, 2018 - 2032 (USD Million)
- TABLE 30 Rice Bran Derivatives market estimates and forecast, for pharmaceuticals & nutraceuticals, 2018 - 2032 (Kilo Tons), (USD Million)
- TABLE 31 Rice Bran Derivatives market estimates and forecast, for pharmaceuticals & nutraceuticals, by region, 2018 - 2032 (Kilo Tons)
- TABLE 32 Rice Bran Derivatives market estimates and forecast, for pharmaceuticals & nutraceuticals, by region, 2018 - 2032 (USD Million)
- TABLE 33 Rice Bran Derivatives market estimates and forecast, for others, 2018 - 2032 (Kilo Tons), (USD Million)
- TABLE 34 Rice Bran Derivatives market estimates and forecast, for others, by region, 2018 - 2032 (Kilo Tons)
- TABLE 35 Rice Bran Derivatives market estimates and forecast, for others, by region, 2018 - 2032 (USD Million)
- TABLE 36 North America Rice Bran Derivatives market, 2018 - 2032, (Kilo Tons), (USD Million)
- TABLE 37 North America Rice Bran Derivatives market, by product, 2018 - 2032 (Kilo Tons)
- TABLE 38 North America Rice Bran Derivatives market, by product, 2018 - 2032 (USD Million)
- TABLE 39 North America Rice Bran Derivatives market, by application, 2018 - 2032 (Kilo Tons)
- TABLE 40 North America Rice Bran Derivatives market, by application, 2018 - 2032 (USD Million)
- TABLE 41 U.S. Rice Bran Derivatives market, 2018 - 2032, (Kilo Tons), (USD Million)
- TABLE 42 U.S. Rice Bran Derivatives market, by product, 2018 - 2032 (Kilo Tons)
- TABLE 43 U.S. Rice Bran Derivatives market, by product, 2018 - 2032 (USD Million)
- TABLE 44 U.S. Rice Bran Derivatives market, by application, 2018 - 2032 (Kilo Tons)
- TABLE 45 U.S. Rice Bran Derivatives market, by application, 2018 - 2032 (USD Million)
- TABLE 46 Canada Rice Bran Derivatives market, 2018 - 2032, (Kilo Tons), (USD Million)
- TABLE 47 Canada Rice Bran Derivatives market, by product, 2018 - 2032 (Kilo Tons)
- TABLE 48 Canada Rice Bran Derivatives market, by product, 2018 - 2032 (USD Million)
- TABLE 49 Canada Rice Bran Derivatives market, by application, 2018 - 2032 (Kilo Tons)
- TABLE 50 Canada Rice Bran Derivatives market, by application, 2018 - 2032 (USD Million)
- TABLE 51 Europe Rice Bran Derivatives market, 2018 - 2032, (Kilo Tons), (USD Million)
- TABLE 52 Europe Rice Bran Derivatives market, by product, 2018 - 2032 (Kilo Tons)
- TABLE 53 Europe Rice Bran Derivatives market, by product, 2018 - 2032 (USD Million)
- TABLE 54 Europe Rice Bran Derivatives market, by application, 2018 - 2032 (Kilo Tons)
- TABLE 55 Europe Rice Bran Derivatives market, by application, 2018 - 2032 (USD Million)
- TABLE 56 Germany Rice Bran Derivatives market, 2018 - 2032, (Kilo Tons), (USD Million)
- TABLE 57 Germany Rice Bran Derivatives market, by product, 2018 - 2032 (Kilo Tons)
- TABLE 58 Germany Rice Bran Derivatives market, by product, 2018 - 2032 (USD Million)
- TABLE 59 Germany Rice Bran Derivatives market, by application, 2018 - 2032 (Kilo Tons)
- TABLE 60 Germany Rice Bran Derivatives market, by application, 2018 - 2032 (USD Million)
- TABLE 61 UK Rice Bran Derivatives market, 2018 - 2032, (Kilo Tons), (USD Million)
- TABLE 62 UK Rice Bran Derivatives market, by product, 2018 - 2032 (Kilo Tons)
- TABLE 63 UK Rice Bran Derivatives market, by product, 2018 - 2032 (USD Million)
- TABLE 64 UK Rice Bran Derivatives market, by application, 2018 - 2032 (Kilo Tons)
- TABLE 65 UK Rice Bran Derivatives market, by application, 2018 - 2032 (USD Million)
- TABLE 66 France Rice Bran Derivatives market, 2018 - 2032, (Kilo Tons), (USD Million)
- TABLE 67 France Rice Bran Derivatives market, by product, 2018 - 2032 (Kilo Tons)
- TABLE 68 France Rice Bran Derivatives market, by product, 2018 - 2032 (USD Million)
- TABLE 69 France Rice Bran Derivatives market, by application, 2018 - 2032 (Kilo Tons)
- TABLE 70 France Rice Bran Derivatives market, by application, 2018 - 2032 (USD Million)
- TABLE 71 Italy Rice Bran Derivatives market, 2018 - 2032, (Kilo Tons), (USD Million)
- TABLE 72 Italy Rice Bran Derivatives market, by product, 2018 - 2032 (Kilo Tons)
- TABLE 73 Italy Rice Bran Derivatives market, by product, 2018 - 2032 (USD Million)
- TABLE 74 Italy Rice Bran Derivatives market, by application, 2018 - 2032 (Kilo Tons)
- TABLE 75 Italy Rice Bran Derivatives market, by application, 2018 - 2032 (USD Million)
- TABLE 76 Spain Rice Bran Derivatives market, 2018 - 2032, (Kilo Tons), (USD Million)
- TABLE 77 Spain Rice Bran Derivatives market, by product, 2018 - 2032 (Kilo Tons)
- TABLE 78 Spain Rice Bran Derivatives market, by product, 2018 - 2032 (USD Million)
- TABLE 79 Spain Rice Bran Derivatives market, by application, 2018 - 2032 (Kilo Tons)
- TABLE 80 Spain Rice Bran Derivatives market, by application, 2018 - 2032 (USD Million)
- TABLE 81 Russia Rice Bran Derivatives market, 2018 - 2032, (Kilo Tons), (USD Million)
- TABLE 82 Russia Rice Bran Derivatives market, by product, 2018 - 2032 (Kilo Tons)
- TABLE 83 Russia Rice Bran Derivatives market, by product, 2018 - 2032 (USD Million)
- TABLE 84 Russia Rice Bran Derivatives market, by application, 2018 - 2032 (Kilo Tons)
- TABLE 85 Russia Rice Bran Derivatives market, by application, 2018 - 2032 (USD Million)
- TABLE 86 Asia Pacific Rice Bran Derivatives market, 2018 - 2032, (Kilo Tons), (USD Million)
- TABLE 87 Asia Pacific Rice Bran Derivatives market, by product, 2018 - 2032 (Kilo Tons)
- TABLE 88 Asia Pacific Rice Bran Derivatives market, by product, 2018 - 2032 (USD Million)
- TABLE 89 Asia Pacific Rice Bran Derivatives market, by application, 2018 - 2032 (Kilo Tons)
- TABLE 90 Asia Pacific Rice Bran Derivatives market, by application, 2018 - 2032 (USD Million)
- TABLE 91 China Rice Bran Derivatives market, 2018 - 2032, (Kilo Tons), (USD Million)
- TABLE 92 China Rice Bran Derivatives market, by product, 2018 - 2032 (Kilo Tons)
- TABLE 93 China Rice Bran Derivatives market, by product, 2018 - 2032 (USD Million)
- TABLE 94 China Rice Bran Derivatives market, by application, 2018 - 2032 (Kilo Tons)
- TABLE 95 China Rice Bran Derivatives market, by application, 2018 - 2032 (USD Million)
- TABLE 96 India Rice Bran Derivatives market, 2018 - 2032, (Kilo Tons), (USD Million)
- TABLE 97 India Rice Bran Derivatives market, by product, 2018 - 2032 (Kilo Tons)
- TABLE 98 India Rice Bran Derivatives market, by product, 2018 - 2032 (USD Million)
- TABLE 99 India Rice Bran Derivatives market, by application, 2018 - 2032 (Kilo Tons)
- TABLE 100 India Rice Bran Derivatives market, by application, 2018 - 2032 (USD Million)
- TABLE 101 Japan Rice Bran Derivatives market, 2018 - 2032, (Kilo Tons), (USD Million)
- TABLE 102 Japan Rice Bran Derivatives market, by product, 2018 - 2032 (Kilo Tons)
- TABLE 103 Japan Rice Bran Derivatives market, by product, 2018 - 2032 (USD Million)
- TABLE 104 Japan Rice Bran Derivatives market, by application, 2018 - 2032 (Kilo Tons)
- TABLE 105 Japan Rice Bran Derivatives market, by application, 2018 - 2032 (USD Million)
- TABLE 106 Indonesia Rice Bran Derivatives market, 2018 - 2032, (Kilo Tons), (USD Million)
- TABLE 107 Indonesia Rice Bran Derivatives market, by product, 2018 - 2032 (Kilo Tons)
- TABLE 108 Indonesia Rice Bran Derivatives market, by product, 2018 - 2032 (USD Million)
- TABLE 109 Indonesia Rice Bran Derivatives market, by application, 2018 - 2032 (Kilo Tons)
- TABLE 110 Indonesia Rice Bran Derivatives market, by application, 2018 - 2032 (USD Million)
- TABLE 111 South Korea Rice Bran Derivatives market, 2018 - 2032, (Kilo Tons), (USD Million)
- TABLE 112 South Korea Rice Bran Derivatives market, by product, 2018 - 2032 (Kilo Tons)
- TABLE 113 South Korea Rice Bran Derivatives market, by product, 2018 - 2032 (USD Million)
- TABLE 114 South Korea Rice Bran Derivatives market, by application, 2018 - 2032 (Kilo Tons)
- TABLE 115 South Korea Rice Bran Derivatives market, by application, 2018 - 2032 (USD Million)
- TABLE 116 Malaysia Rice Bran Derivatives market, 2018 - 2032, (Kilo Tons), (USD Million)
- TABLE 117 Malaysia Rice Bran Derivatives market, by product, 2018 - 2032 (Kilo Tons)
- TABLE 118 Malaysia Rice Bran Derivatives market, by product, 2018 - 2032 (USD Million)
- TABLE 119 Malaysia Rice Bran Derivatives market, by application, 2018 - 2032 (Kilo Tons)
- TABLE 120 Malaysia Rice Bran Derivatives market, by application, 2018 - 2032 (USD Million)
- TABLE 121 Latin America Rice Bran Derivatives market, 2018 - 2032, (Kilo Tons), (USD Million)
- TABLE 122 Latin America Rice Bran Derivatives market, by product, 2018 - 2032 (Kilo Tons)
- TABLE 123 Latin America Rice Bran Derivatives market, by product, 2018 - 2032 (USD Million)
- TABLE 124 Latin America Rice Bran Derivatives market, by application, 2018 - 2032 (Kilo Tons)
- TABLE 125 Latin America Rice Bran Derivatives market, by application, 2018 - 2032 (USD Million)
- TABLE 126 Brazil Rice Bran Derivatives market, 2018 - 2032, (Kilo Tons), (USD Million)
- TABLE 127 Brazil Rice Bran Derivatives market, by product, 2018 - 2032 (Kilo Tons)
- TABLE 128 Brazil Rice Bran Derivatives market, by product, 2018 - 2032 (USD Million)
- TABLE 129 Brazil Rice Bran Derivatives market, by application, 2018 - 2032 (Kilo Tons)
- TABLE 130 Brazil Rice Bran Derivatives market, by application, 2018 - 2032 (USD Million)
- TABLE 131 Mexico Rice Bran Derivatives market, 2018 - 2032, (Kilo Tons), (USD Million)
- TABLE 132 Mexico Rice Bran Derivatives market, by product, 2018 - 2032 (Kilo Tons)
- TABLE 133 Mexico Rice Bran Derivatives market, by product, 2018 - 2032 (USD Million)
- TABLE 134 Mexico Rice Bran Derivatives market, by application, 2018 - 2032 (Kilo Tons)
- TABLE 135 Mexico Rice Bran Derivatives market, by application, 2018 - 2032 (USD Million)
- TABLE 136 Middle East & Africa Rice Bran Derivatives market, 2018 - 2032, (Kilo Tons), (USD Million)
- TABLE 137 Middle East & Africa Rice Bran Derivatives market, by product, 2018 - 2032 (Kilo Tons)
- TABLE 138 Middle East & Africa Rice Bran Derivatives market, by product, 2018 - 2032 (USD Million)
- TABLE 139 Middle East & Africa Rice Bran Derivatives market, by application, 2018 - 2032 (Kilo Tons)
- TABLE 140 Middle East & Africa Rice Bran Derivatives market, by application, 2018 - 2032 (USD Million)
- TABLE 141 UAE Rice Bran Derivatives market, 2018 - 2032, (Kilo Tons), (USD Million)
- TABLE 142 UAE Rice Bran Derivatives market, by product, 2018 - 2032 (Kilo Tons)
- TABLE 143 UAE Rice Bran Derivatives market, by product, 2018 - 2032 (USD Million)
- TABLE 144 UAE Rice Bran Derivatives market, by application, 2018 - 2032 (Kilo Tons)
- TABLE 145 UAE Rice Bran Derivatives market, by application, 2018 - 2032 (USD Million)
- TABLE 146 South Africa Rice Bran Derivatives market, 2018 - 2032, (Kilo Tons), (USD Million)
- TABLE 147 South Africa Rice Bran Derivatives market, by product, 2018 - 2032 (Kilo Tons)
- TABLE 148 South Africa Rice Bran Derivatives market, by product, 2018 - 2032 (USD Million)
- TABLE 149 South Africa Rice Bran Derivatives market, by application, 2018 - 2032 (Kilo Tons)
- TABLE 150 South Africa Rice Bran Derivatives market, by application, 2018 - 2032 (USD Million)
- TABLE 151 Saudi Arabia Rice Bran Derivatives market, 2018 - 2032, (Kilo Tons), (USD Million)
- TABLE 152 Saudi Arabia Rice Bran Derivatives market, by product, 2018 - 2032 (Kilo Tons)
- TABLE 153 Saudi Arabia Rice Bran Derivatives market, by product, 2018 - 2032 (USD Million)
- TABLE 154 Saudi Arabia Rice Bran Derivatives market, by application, 2018 - 2032 (Kilo Tons)
- TABLE 155 Saudi Arabia Rice Bran Derivatives market, by application, 2018 - 2032 (USD Million)
Charts & Figures
- FIG. 1 GMI report coverage: critical research elements
- FIG. 2 Rice Bran Derivatives industry segmentation
- FIG. 3 Market forecasting methodology
- FIG. 4 Profile break-up of primary respondents
- FIG. 5 Rice Bran Derivatives industry 360 degree synopsis, 2022
- FIG. 6 Industry Segmentation
- FIG. 7 Profit margin analysis of Rice Bran Derivatives industry ecosystem
- FIG. 8 Value addition at each stage
- FIG. 9 Porters Analysis
- FIG. 10 Porters Analysis
- FIG. 11 PESTEL analysis
- FIG. 12 Competitive analysis of major market players, 2022
- FIG. 13 Competitive positioning matrix
- FIG. 14 Strategic outlook matrix
- FIG. 15 SWOT Analysis, Riceland Foods, Inc.
- FIG. 16 SWOT Analysis, Wilmar International Ltd.
- FIG. 17 SWOT Analysis, Archer Daniels Midland Company
- FIG. 18 SWOT Analysis, BCL Industries & Infrastructure Ltd
- FIG. 19 SWOT Analysis, A.P. Refinery Pvt. Ltd.
- FIG. 20 SWOT Analysis, Agrotech International Ltd.
- FIG. 21 SWOT Analysis, RiceBran Technologies
- FIG. 22 SWOT Analysis, Golden Grain Group Limited
- FIG. 23 SWOT Analysis, Agro Tech Foods Ltd.
- FIG. 24 SWOT Analysis, Kaisuri Co., Ltd
Global Rice Bran Derivatives Industry size will expand at a decent CAGR from 2023 to 2032. The advancements in rice bran extraction technology and sustainable production practices are further fuelling the demand for rice bran derivatives in diverse industries. For instance, Supercritical Fluid Extraction (SFE), a non-contact extraction method, uses supercritical fluids, such as carbon dioxide, to extract oil from rice bran. SFE is more efficient and environmentally friendly than the traditional solvent extraction method.
The increasing awareness of the nutritional benefits of rice bran derivatives, like rice bran oil and rice bran protein, is boosting their adoption in the food and beverage industry. These derivatives are rich in antioxidants, vitamins, and essential fatty acids, appealing to health-conscious consumers. The rising demand for natural and plant-based ingredients in various applications, including cosmetics and animal feed, is propelling the market's expansion.
The Global Rice Bran Derivatives Market is classified based on product, application, and region.
Based on product, the rice bran meal will accumulate a significant market share by 2032. As a byproduct of rice bran oil extraction, rice bran meal is rich in protein, fiber, and essential nutrients, making it a valuable ingredient in animal feed formulations. Its nutritional profile contributes to improved livestock health and growth, driving its adoption in the animal nutrition industry. Additionally, the increasing focus on sustainable and natural feed ingredients enhances the appeal of rice bran meals, further boosting its demand in the market.
With regard to application, the food and beverage segment will show gradual progress by 2032. Rice bran derivatives, such as rice bran oil, are gaining popularity in the food industry due to their health benefits and versatility in various culinary applications. Rice bran oil, known for its high smoke point and mild flavor, is increasingly used for cooking, baking, and frying purposes. In addition, it's cholesterol-lowering properties and nutritional value make it an appealing alternative for health-conscious consumers, driving the demand for rice bran derivatives in the food and beverage sector.
Regionally, the North American rice bran derivatives market could have a high development potential owing to consumers becoming more health-conscious and a growing interest in natural and nutritious food ingredients. Rice bran derivatives, such as rice bran oil and rice bran protein, are gaining popularity due to their numerous health benefits. Additionally, the increasing adoption of plant-based diets and the demand for clean-label products further fuel the market's growth. Furthermore, the region's flourishing animal nutrition industry is driving the demand for rice bran derivatives as a valuable component in livestock feed formulations.
Table of Contents
Chapter 1 Methodology and Scope
- 1.1 Market definitions
- 1.2 Base estimates and working
- 1.3 Forecast calculations
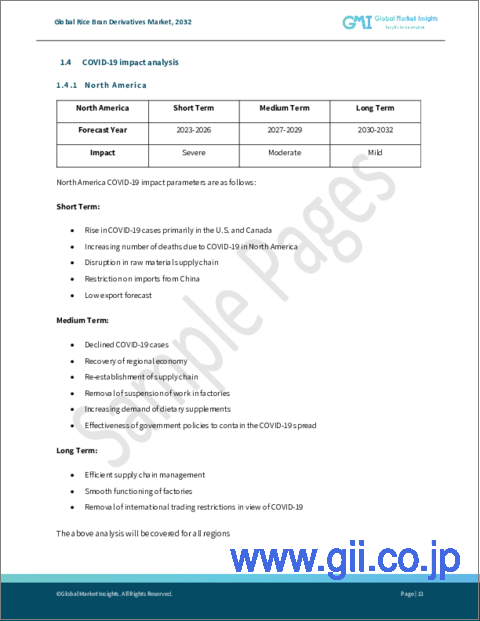
- 1.3.1 COVID-19 impact parameters
- 1.3.1.1 North America
- 1.3.1.2 Europe
- 1.3.1.3 APAC
- 1.3.1.4 MEA
- 1.3.1.5 LATAM
- 1.3.1 COVID-19 impact parameters
- 1.4 Data Sources
- 1.4.1 Primary
- 1.4.2 Secondary
- 1.4.2.1 Paid Sources
- 1.4.2.2 Public Sources
Chapter 2 Executive Summary
- 2.1 Rice Bran Derivatives industry 360 degree synopsis, 2018 - 2032
- 2.1.1 Business trends
- 2.1.2 Product trends
- 2.1.3 Application trends
- 2.1.4 Regional trends
Chapter 3 Global Rice Bran Derivatives Industry Insights
- 3.1 Industry segmentation
- 3.2 Industry Ecosystem
- 3.2.1 Manufacturers
- 3.2.2 Vendor matrix
- 3.2.3 Profit margin analysis
- 3.2.4 Value addition at each stage
- 3.2.5 COVID-19 impact on industry value chain
- 3.3 Product landscape
- 3.3.1 Patent Analysis
- 3.4 Regulatory landscape
- 3.5 Pricing analysis, by region
- 3.5.1 North America
- 3.5.2 Europe
- 3.5.3 APAC
- 3.5.4 LATAM
- 3.5.5 MEA
- 3.5.6 Cost structure analysis, 2022
- 3.6 Industry impact forces
- 3.6.1 Growth drivers
- 3.6.1.1 The growing use of Rice Bran Derivatives in food & beverages application
- 3.6.1.2 Rising demand owing to the various health benefits offered by rice bran derivatives
- 3.6.2 Pitfall and Challenges
- 3.6.2.1 Limited Consumer Awareness
- 3.6.1 Growth drivers
- 3.7 Innovation and sustainability
- 3.8 Growth potential analysis, 2022
- 3.9 Porter's analysis
- 3.10 PESTEL analysis
- 3.11 Impact of the COVID-19 on Rice Bran Derivatives market
- 3.12 Impact of Russia-Ukraine war on Rice Bran Derivatives market
Chapter 4 Competitive Landscape, 2022
- 4.1 Introduction
- 4.2 Company market share analysis by region, 2022
- 4.3 Competitive analysis of major market players
- 4.4 Competitive positioning matrix
- 4.5 Strategic outlook matrix
Chapter 5 Global Rice Bran Derivatives Market by Product, 2018 - 2032
- 5.1 Rice Bran Oil
- 5.1.1 Market estimates and forecast, 2018 - 2032
- 5.1.2 Market estimates and forecast, 2018 - 2032, by region
- 5.2 Rice Bran Meal
- 5.2.1 Market estimates and forecast, 2018 - 2032
- 5.2.2 Market estimates and forecast, 2018 - 2032, by region
Chapter 6 Global Rice Bran Derivatives Market by Application, 2018 - 2032
- 6.1 Food & Beverage Industry
- 6.1.1 Market estimates and forecast, 2018 - 2032
- 6.1.2 Market estimates and forecast, 2018 - 2032, by region
- 6.2 Animal Feed
- 6.2.1 Market estimates and forecast, 2018 - 2032
- 6.2.2 Market estimates and forecast, 2018 - 2032, by region
- 6.3 Cosmetics & Personal Care
- 6.3.1 Market estimates and forecast, 2018 - 2032
- 6.3.2 Market estimates and forecast, 2018 - 2032, by region
- 6.4 Biofuel
- 6.4.1 Market estimates and forecast, 2018 - 2032
- 6.4.2 Market estimates and forecast, 2018 - 2032, by region
- 6.5 Pharmaceuticals & Nutraceuticals
- 6.5.1 Market estimates and forecast, 2018 - 2032
- 6.5.2 Market estimates and forecast, 2018 - 2032, by region
- 6.6 Others
Chapter 7 Global Rice Bran Derivatives Market by Region, 2018 - 2032
- 7.1 North America
- 7.1.1 Market estimates and forecast, 2018 - 2032
- 7.1.2 Market estimates and forecast, 2018 - 2032, by product
- 7.1.3 Market estimates and forecast, 2018 - 2032, by application
- 7.1.4 U.S.
- 7.1.4.1 Market estimates and forecast, 2018 - 2032
- 7.1.4.2 Market estimates and forecast, 2018 - 2032, by product
- 7.1.4.3 Market estimates and forecast, 2018 - 2032, by application
- 7.1.5 Canada
- 7.1.5.1 Market estimates and forecast, 2018 - 2032
- 7.1.5.2 Market estimates and forecast, 2018 - 2032, by product
- 7.1.5.3 Market estimates and forecast, 2018 - 2032, by application
- 7.2 Europe
- 7.2.1 Market estimates and forecast, 2018 - 2032
- 7.2.2 Market estimates and forecast, 2018 - 2032, by product
- 7.2.3 Market estimates and forecast, 2018 - 2032, by application
- 7.2.4 Germany
- 7.2.4.1 Market estimates and forecast, 2018 - 2032
- 7.2.4.2 Market estimates and forecast, 2018 - 2032, by product
- 7.2.4.3 Market estimates and forecast, 2018 - 2032, by application
- 7.2.5 UK
- 7.2.5.1 Market estimates and forecast, 2018 - 2032
- 7.2.5.2 Market estimates and forecast, 2018 - 2032, by product
- 7.2.5.3 Market estimates and forecast, 2018 - 2032, by application
- 7.2.6 France
- 7.2.6.1 Market estimates and forecast, 2018 - 2032
- 7.2.6.2 Market estimates and forecast, 2018 - 2032, by product
- 7.2.6.3 Market estimates and forecast, 2018 - 2032, by application
- 7.2.7 Russia
- 7.2.7.1 Market estimates and forecast, 2018 - 2032
- 7.2.7.2 Market estimates and forecast, 2018 - 2032, by product
- 7.2.7.3 Market estimates and forecast, 2018 - 2032, by application
- 7.2.8 Italy
- 7.2.8.1 Market estimates and forecast, 2018 - 2032
- 7.2.8.2 Market estimates and forecast, 2018 - 2032, by product
- 7.2.8.3 Market estimates and forecast, 2018 - 2032, by application
- 7.2.9 Spain
- 7.2.9.1 Market estimates and forecast, 2018 - 2032
- 7.2.9.2 Market estimates and forecast, 2018 - 2032, by product
- 7.2.9.3 Market estimates and forecast, 2018 - 2032, by application
- 7.3 Asia Pacific
- 7.3.1 Market estimates and forecast, 2018 - 2032
- 7.3.2 Market estimates and forecast, 2018 - 2032, by product
- 7.3.3 Market estimates and forecast, 2018 - 2032, by application
- 7.3.4 China
- 7.3.4.1 Market estimates and forecast, 2018 - 2032
- 7.3.4.2 Market estimates and forecast, 2018 - 2032, by product
- 7.3.4.3 Market estimates and forecast, 2018 - 2032, by application
- 7.3.5 India
- 7.3.5.1 Market estimates and forecast, 2018 - 2032
- 7.3.5.2 Market estimates and forecast, 2018 - 2032, by product
- 7.3.5.3 Market estimates and forecast, 2018 - 2032, by application
- 7.3.6 Japan
- 7.3.6.1 Market estimates and forecast, 2018 - 2032
- 7.3.6.2 Market estimates and forecast, 2018 - 2032, by product
- 7.3.6.3 Market estimates and forecast, 2018 - 2032, by application
- 7.3.7 South Korea
- 7.3.7.1 Market estimates and forecast, 2018 - 2032
- 7.3.7.2 Market estimates and forecast, 2018 - 2032, by product
- 7.3.7.3 Market estimates and forecast, 2018 - 2032, by application
- 7.3.8 Indonesia
- 7.3.8.1 Market estimates and forecast, 2018 - 2032
- 7.3.8.2 Market estimates and forecast, 2018 - 2032, by product
- 7.3.8.3 Market estimates and forecast, 2018 - 2032, by application
- 7.3.9 Malaysia
- 7.3.9.1 Market estimates and forecast, 2018 - 2032
- 7.3.9.2 Market estimates and forecast, 2018 - 2032, by product
- 7.3.9.3 Market estimates and forecast, 2018 - 2032, by application
- 7.4 Latin America (LATAM)
- 7.4.1 Market estimates and forecast, 2018 - 2032
- 7.4.2 Market estimates and forecast, 2018 - 2032, by product
- 7.4.3 Market estimates and forecast, 2018 - 2032, by application
- 7.4.4 Brazil
- 7.4.4.1 Market estimates and forecast, 2018 - 2032
- 7.4.4.2 Market estimates and forecast, 2018 - 2032, by product
- 7.4.4.3 Market estimates and forecast, 2018 - 2032, by application
- 7.4.5 Mexico
- 7.4.5.1 Market estimates and forecast, 2018 - 2032
- 7.4.5.2 Market estimates and forecast, 2018 - 2032, by product
- 7.4.5.3 Market estimates and forecast, 2018 - 2032, by application
- 7.5 Middle East & Africa (MEA)
- 7.5.1 Market estimates and forecast, 2018 - 2032
- 7.5.2 Market estimates and forecast, 2018 - 2032, by product
- 7.5.3 Market estimates and forecast, 2018 - 2032, by application
- 7.5.4 South Africa
- 7.5.4.1 Market estimates and forecast, 2018 - 2032
- 7.5.4.2 Market estimates and forecast, 2018 - 2032, by product
- 7.5.4.3 Market estimates and forecast, 2018 - 2032, by application
- 7.5.5 Saudi Arabia
- 7.5.5.1 Market estimates and forecast, 2018 - 2032
- 7.5.5.2 Market estimates and forecast, 2018 - 2032, by product
- 7.5.5.3 Market estimates and forecast, 2018 - 2032, by application
- 7.5.6 UAE
- 7.5.6.1 Market estimates and forecast, 2018 - 2032
- 7.5.6.2 Market estimates and forecast, 2018 - 2032, by product
- 7.5.6.3 Market estimates and forecast, 2018 - 2032, by application
Chapter 8 Company Profiles
- 8.1 Riceland Foods, Inc.
- 8.1.1 Business Overview
- 8.1.2 Financial Data
- 8.1.3 Product Landscape
- 8.1.4 Strategic Outlook
- 8.1.5 SWOT Analysis
- 8.2 Wilmar International Ltd.
- 8.2.1 Business Overview
- 8.2.2 Financial Data
- 8.2.3 Product Landscape
- 8.2.4 Strategic Outlook
- 8.2.5 SWOT Analysis
- 8.3 Archer Daniels Midland Company
- 8.3.1 Business Overview
- 8.3.2 Financial Data
- 8.3.3 Product Landscape
- 8.3.4 Strategic Outlook
- 8.3.5 SWOT Analysis
- 8.4 BCL Industries & Infrastructure Ltd
- 8.4.1 Business Overview
- 8.4.2 Financial Data
- 8.4.3 Product Landscape
- 8.4.4 Strategic Outlook
- 8.4.5 SWOT Analysis
- 8.5 A.P. Refinery Pvt. Ltd.
- 8.5.1 Business Overview
- 8.5.2 Financial Data
- 8.5.3 Product Landscape
- 8.5.4 Strategic Outlook
- 8.5.5 SWOT Analysis
- 8.6 Kaisuri Co., Ltd.
- 8.6.1 Business Overview
- 8.6.2 Financial Data
- 8.6.3 Product Landscape
- 8.6.4 Strategic Outlook
- 8.6.5 SWOT Analysis
- 8.7 Agrotech International Ltd
- 8.7.1 Business Overview
- 8.7.2 Financial Data
- 8.7.3 Product Landscape
- 8.7.4 Strategic Outlook
- 8.7.5 SWOT Analysis
- 8.8 RiceBran Technologies
- 8.8.1 Business Overview
- 8.8.2 Financial Data
- 8.8.3 Product Landscape
- 8.8.4 Strategic Outlook
- 8.8.5 SWOT Analysis
- 8.9 Golden Grain Group Limited
- 8.9.1 Business Overview
- 8.9.2 Financial Data
- 8.9.3 Product Landscape
- 8.9.4 Strategic Outlook
- 8.9.5 SWOT Analysis
- 8.10 Agro Tech Foods Ltd.
- 8.10.1 Business Overview
- 8.10.2 Financial Data
- 8.10.3 Product Landscape
- 8.10.4 Strategic Outlook
- 8.10.5 SWOT Analysis