
|
市場調査レポート
商品コード
1666960
ロッド式人工揚力システム市場の機会、成長促進要因、産業動向分析、2025年~2034年の予測Rod Artificial Lift System Market Opportunity, Growth Drivers, Industry Trend Analysis, and Forecast 2025 - 2034 |
||||||
カスタマイズ可能
|
|||||||
| ロッド式人工揚力システム市場の機会、成長促進要因、産業動向分析、2025年~2034年の予測 |
|
出版日: 2024年12月16日
発行: Global Market Insights Inc.
ページ情報: 英文 70 Pages
納期: 2~3営業日
|

全表示
- 概要
- 目次
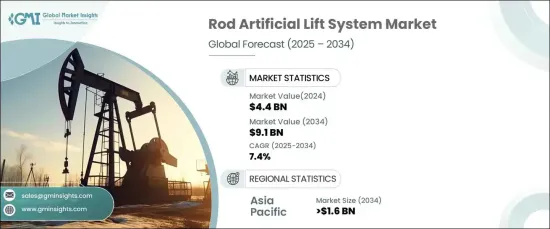
2024年に44億米ドルと評価されたロッド式人工揚力システムの世界市場は、2025年から2034年にかけてCAGR 7.4%で拡大すると予測されています。
この大きな成長は、主に老朽化した低圧井戸からの効率的な炭化水素抽出ソリューションに対する需要の高まりによってもたらされます。オペレーターは、費用対効果が高く、信頼性が高く、さまざまな坑井条件に適応できるシステムを求め続けているため、特に新規油田や非在来型埋蔵量の開発において、こうしたシステムのニーズが高まっています。
市場の拡大には、システムの耐久性と効率を向上させる自動化や強化された材料などの技術的進歩も拍車をかけています。持続可能なエネルギーソリューションへの世界のシフトに伴い、エネルギー効率の高い人工揚力システムの推進が市場需要をさらに押し上げています。さらに、エネルギーインフラへの投資の高まりと有利な規制環境が、主要地域全体でこれらのシステムの急速な採用に寄与しています。
| 市場範囲 | |
|---|---|
| 開始年 | 2024 |
| 予測年 | 2025-2034 |
| 開始金額 | 44億米ドル |
| 予測金額 | 91億米ドル |
| CAGR | 7.4% |
アジア太平洋地域は、2034年までに世界の市場規模に16億米ドル寄与すると見られています。この地域では、特に老朽化した油田や非在来型貯留層での石油・ガス探査が増加しており、ロッド式人工揚力システムの必要性が加速しています。中国、インド、東南アジアの国々がエネルギー生産を拡大し続ける中、これらのシステムは、成熟した油田からの最適な生産量を維持するために不可欠なものとなりつつあります。技術革新とエネルギー部門投資に対する政府の支援が、この需要をさらに押し上げています。エネルギー需要の増加と、より持続可能な採掘プロセスの推進により、これらのシステムが同地域の石油・ガス部門で中心的な役割を果たすことは確実です。
北米では、ロッド式人工揚力システム市場は2025年から2034年にかけて7%の安定したペースで成長する見通しです。この拡大は、非在来型石油・ガス埋蔵量、特にシェール層における探査・生産活動の増加によるところが大きいです。低圧井戸からの生産量を向上させる効率的なソリューションに対する需要が、市場の成長に寄与しています。また、耐久性向上のための材料改良やリアルタイムモニタリングの統合など、技術の進歩も市場開発を後押ししています。さらに、有利な政府政策と油田インフラへの実質的な投資は、地域全体でロッド式人工揚力システムの採用を強化しています。
米国のロッド式人工揚力システム市場は、成熟油田と非在来型油田の両方における生産の最適化に重点が置かれるようになり、2034年までに50億米ドルを生み出すと予想されています。オペレーターがシェール貯留層や老朽化した油井をターゲットにしているため、費用対効果の高い高性能ソリューションへの需要が急増しています。性能向上のための材料強度や自動化の進歩などの技術革新が、この動向を支えています。エネルギー安全保障に対するニーズの高まりは、油田インフラへの多額の投資と相まって、市場の拡大をさらに促進し、米国をロッド式人工揚力システム市場の主要プレーヤーとして位置づけています。
目次
第1章 調査手法と調査範囲
- 市場の定義
- 基本推定と計算
- 予測計算
- データソース
- 1次データ
- 2次データ
- 有償
- 公的
第2章 エグゼクティブサマリー
第3章 業界洞察
- エコシステム分析
- 規制状況
- 業界への影響要因
- 促進要因
- 業界の潜在的リスク&課題
- 成長可能性分析
- ポーターの分析
- 供給企業の交渉力
- 買い手の交渉力
- 新規参入業者の脅威
- 代替品の脅威
- PESTEL分析
第4章 競合情勢
- 戦略ダッシュボード
- イノベーションと持続可能性の展望
第5章 市場規模・予測:地域別、2021年~2034年
- 主要動向
- 北米
- 米国
- カナダ
- 欧州
- 英国
- ノルウェー
- オランダ
- アジア太平洋
- 中国
- インド
- インドネシア
- マレーシア
- 中東・アフリカ
- サウジアラビア
- アラブ首長国連邦
- オマーン
- クウェート
- ナイジェリア
- ラテンアメリカ
- ブラジル
- アルゼンチン
- メキシコ
第6章 企業プロファイル
- BCP Group
- ChampionX
- ELKAM ArtEfficial Lift
- Endurance Lift Solutions International
- General Electric
- Halliburton
- JJ Tech
- Levare
- Liberty Lift Solutions
- National Energy Services Reunited
- NOV
- NOVA Petroleum Services
- PetroLift Systems
- Q2 Artificial Lift Services
- SLB
- Tenaris
- Weatherford
The Global Rod Artificial Lift System Market, valued at USD 4.4 billion in 2024, is projected to expand at a CAGR of 7.4% between 2025 and 2034. This significant growth is primarily driven by the increasing demand for efficient hydrocarbon extraction solutions from aging and low-pressure wells. As operators continue to seek cost-effective, reliable, and adaptable systems for varying well conditions, the need for these systems is growing, particularly in the development of new oilfields and unconventional reserves.
The market expansion is also being fueled by technological advancements, including automation and enhanced materials that improve system durability and efficiency. With a global shift toward sustainable energy solutions, the push for energy-efficient artificial lift systems is further propelling market demand. Additionally, heightened investments in energy infrastructure and favorable regulatory environments are contributing to the rapid adoption of these systems across key regions.
| Market Scope | |
|---|---|
| Start Year | 2024 |
| Forecast Year | 2025-2034 |
| Start Value | $4.4 Billion |
| Forecast Value | $9.1 Billion |
| CAGR | 7.4% |
The Asia Pacific region is set to contribute USD 1.6 billion to the global market value by 2034. The region's growing oil and gas exploration, particularly in aging fields and unconventional reservoirs, is accelerating the need for rod artificial lift systems. As countries like China, India, and those in Southeast Asia continue to boost energy production, these systems are becoming indispensable for maintaining optimal output from mature wells. Technological innovations and government support for energy sector investments are further driving this demand. The rise in energy demands, along with a push for more sustainable extraction processes, ensures that these systems will play a central role in the region's oil and gas sector.
In North America, the rod artificial lift systems market is poised to grow at a steady pace of 7% between 2025 and 2034. The expansion is largely driven by the increasing exploration and production activities in unconventional oil and gas reserves, especially in shale formations. The demand for efficient solutions to enhance output from low-pressure wells is contributing to the market growth. Technological advancements, including improvements in materials for increased durability and the integration of real-time monitoring, are also bolstering the market development. Furthermore, favorable government policies and substantial investments in oilfield infrastructure are reinforcing the adoption of rod artificial lift systems across the region.
The U.S. rod artificial lift systems market is anticipated to generate USD 5 billion by 2034, with a growing emphasis on optimizing production in both mature and unconventional oil fields. As operators target shale reservoirs and aging wells, the demand for cost-effective, high-performance solutions is surging. Technological innovations, such as advancements in material strength and automation for enhanced performance, are supporting this trend. The rising need for energy security, coupled with significant investments in oilfield infrastructure, is further driving market expansion, positioning the U.S. as a key player in the rod artificial lift systems market.
Table of Contents
Chapter 1 Methodology & Scope
- 1.1 Market definitions
- 1.2 Base estimates & calculations
- 1.3 Forecast calculation
- 1.4 Data sources
- 1.4.1 Primary
- 1.4.2 Secondary
- 1.4.2.1 Paid
- 1.4.2.2 Public
Chapter 2 Executive Summary
- 2.1 Industry synopsis, 2021 - 2034
Chapter 3 Industry Insights
- 3.1 Industry ecosystem analysis
- 3.2 Regulatory landscape
- 3.3 Industry impact forces
- 3.3.1 Growth drivers
- 3.3.2 Industry pitfalls & challenges
- 3.4 Growth potential analysis
- 3.5 Porter's analysis
- 3.5.1 Bargaining power of suppliers
- 3.5.2 Bargaining power of buyers
- 3.5.3 Threat of new entrants
- 3.5.4 Threat of substitutes
- 3.6 PESTEL analysis
Chapter 4 Competitive Landscape, 2024
- 4.1 Strategic dashboard
- 4.2 Innovation & sustainability landscape
Chapter 5 Market Size and Forecast, By Region, 2021 – 2034 (USD Million)
- 5.1 Key trends
- 5.2 North America
- 5.2.1 U.S.
- 5.2.2 Canada
- 5.3 Europe
- 5.3.1 UK
- 5.3.2 Norway
- 5.3.3 Netherlands
- 5.4 Asia Pacific
- 5.4.1 China
- 5.4.2 India
- 5.4.3 Indonesia
- 5.4.4 Malaysia
- 5.5 Middle East & Africa
- 5.5.1 Saudi Arabia
- 5.5.2 UAE
- 5.5.3 Oman
- 5.5.4 Kuwait
- 5.5.5 Nigeria
- 5.6 Latin America
- 5.6.1 Brazil
- 5.6.2 Argentina
- 5.6.3 Mexico
Chapter 6 Company Profiles
- 6.1 BCP Group
- 6.2 ChampionX
- 6.3 ELKAM ArtEfficial Lift
- 6.4 Endurance Lift Solutions International
- 6.5 General Electric
- 6.6 Halliburton
- 6.7 JJ Tech
- 6.8 Levare
- 6.9 Liberty Lift Solutions
- 6.10 National Energy Services Reunited
- 6.11 NOV
- 6.12 NOVA Petroleum Services
- 6.13 PetroLift Systems
- 6.14 Q2 Artificial Lift Services
- 6.15 SLB
- 6.16 Tenaris
- 6.17 Weatherford

