
セットトップボックスの市場機会、成長促進要因、産業動向分析、2025~2034年予測
Set-Top Box Market Opportunity, Growth Drivers, Industry Trend Analysis, and Forecast 2025 - 2034- 発行日
- ページ情報
- 英文 210 Pages
- 納期
- 2~3営業日
- 商品コード
- 1833644
- カスタマイズ可能 お客様のご希望に応じて、既存データの加工や未掲載情報(例:国別セグメント)の追加などの対応が可能です。詳細はお問い合わせください。
- 翻訳ツール提供対象 PDF対応AI翻訳ツールの無料貸し出しサービスのご利用が可能です
Global Market Insights Inc.が発行した最新レポートによると、世界のセットトップボックス市場は2024年に210億米ドルと推定され、CAGR 3.2%で2025年の218億米ドルから2034年には291億米ドルに成長すると予測されています。
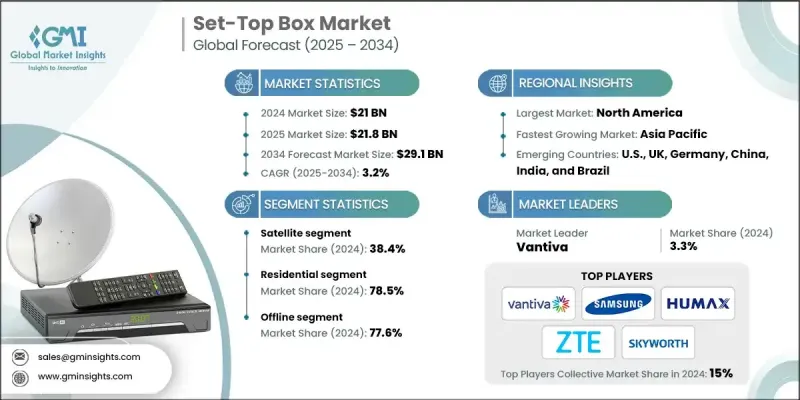
ビデオ品質に対する消費者の期待が高まるにつれ、HD、4K、さらには8K解像度をサポートするセットトップボックスへの需要が高まっています。放送局やコンテンツプロバイダーは視聴体験を向上させるためにアップグレードを推進しており、STBの普及を促進しています。
| 市場範囲 | |
|---|---|
| 開始年 | 2024 |
| 予測年 | 2025-2034 |
| 市場規模 | 210億米ドル |
| 予測金額 | 291億米ドル |
| CAGR | 3.2% |
衛星セグメント
衛星放送セグメントは2024年に大きなシェアを獲得しました。これらのSTBは、遠隔地や十分にサービスが提供されていない地域に高品質のデジタルコンテンツを配信するために不可欠であり、従来の放送に代わる信頼できる選択肢を提供します。圧縮技術と信号強度の進歩により、衛星放送用STBはHDと4Kコンテンツをサポートするようになり、全体的な視聴体験が向上しています。
住宅用セグメント
住宅用セグメントは、多様なコンテンツへのアクセス、高精細放送、ホームエンタテインメントシステムとのシームレスな統合を求める世帯によって後押しされ、2024年に大きなシェアを維持した。スマートTVやストリーミングプラットフォームの台頭にもかかわらず、多くの消費者はライブTV、DVR機能、地域コンテンツやプレミアムコンテンツへのアクセスのためにSTBを好みます。
オフラインにおける需要の高まり
オフライン分野は2024年に大きなシェアを占める。多くの消費者は、特に技術的セットアップ支援やアフターサービスが優先事項である場合には、電子機器を直接購入することを依然として好みます。小売業者は、STBに販促キャンペーンや設置サービスをバンドルすることが多く、技術に疎い購入者に付加価値を与えています。これに対応するため、メーカー各社は店頭マーケティング、スタッフ研修プログラム、店頭デモに投資し、視認性を高めてコンバージョン率を向上させています。オフラインでの存在感を強く保つことで、eコマースの普及が限定的な地域市場でも、ブランドへのアクセスを確保することができます。
北米が有利な地域となる
北米のセットトップボックス市場は2024年に大きなシェアを占め、家庭でのメディア消費量の多さとストリーミング技術との激しい競合が特徴です。コードカットにより従来のケーブルボックスの需要が減少する一方で、放送、オンデマンドストリーミング、スマートホームの統合を組み合わせたハイブリッドSTBへの関心が高まっています。また、消費者の期待の変化を反映し、4Kや音声対応リモコンをサポートするためのアップグレードも見られます。
セットトップボックス市場の主要プレーヤーは、Skyworth、Humax、Apple、ZTE、Intek Digital、Samsung、Dish Network、Sagemcom、Huawei、Vestel、ARRIS、Kaon Media、EchoStar、Technicolor(Vantiva)、CommScopeです。
セットトップボックス市場の主要プレーヤーは、市場での地位を強化するために多層的なアプローチを採用しています。主な戦略には、従来のテレビとストリーミングの橋渡しをするハイブリッドSTBやAndroidベースのSTBの開発が含まれ、消費者により多様な視聴体験を提供しています。各社はまた、ソフトウェアの更新、直感的なUI、スマートアシスタントとの統合を優先し、製品の定着性を高めています。コンテンツ・プロバイダーや通信事業者との戦略的提携は、流通の合理化とユーザー基盤の拡大に役立ちます。さらに、企業は環境意識の高い消費者の動向に合わせて、エネルギー効率の高いハードウェアやリサイクル可能なパッケージングを設計することで、持続可能性を取り入れています。
目次
第1章 調査手法と範囲
第2章 エグゼクティブサマリー
第3章 業界考察
- エコシステム分析
- サプライヤーの情勢
- 利益率
- 各段階での付加価値
- バリューチェーンに影響を与える要因
- 業界への影響要因
- 促進要因
- ホームエンターテイメントとストリーミングサービスの需要増加
- 技術的進歩
- インターネットの普及とスマートテレビの統合の増加
- 業界の潜在的リスク&課題
- 価格感度とコモディティ化
- コンテンツプロバイダーと地域ライセンシングへの依存
- 機会
- OTTプラットフォームおよびアプリエコシステムとの統合
- スマートホームとIoTの統合
- 促進要因
- 成長可能性分析
- 将来の市場動向
- テクノロジーとイノベーションの情勢
- 現在の技術動向
- 新興技術
- 価格動向
- 地域別
- 製品タイプ別
- 規制の枠組み
- 標準およびコンプライアンス要件
- 地域規制枠組み
- 認証基準
- 貿易統計(HSコード:85287100)
- 主要輸入国
- 主要輸出国
- ポーターのファイブフォース分析
- PESTEL分析
- 消費者行動分析
- 購入パターン
- 嗜好分析
- 消費者行動の地域差
- eコマースが購買決定に与える影響
第4章 競合情勢
- イントロダクション
- 企業の市場シェア分析
- 地域別
- 企業マトリックス分析
- 主要市場企業の競合分析
- 競合ポジショニングマトリックス
- 主な発展
- 合併と買収
- パートナーシップとコラボレーション
- 新製品の発売
- 拡張計画
第5章 セットトップボックス市場推計・予測:製品タイプ別、2021-2034
- 主要動向
- ケーブル
- 衛星放送受信ボックス
- IPTV/OTT
- ハイブリッド
- その他
第6章 セットトップボックス市場推計・予測:録音により, 2021-2034
- 主要動向
- 標準解像度
- 高解像度
- ウルトラHD
- 4K以上
第7章 セットトップボックス市場推計・予測:技術別、2021-2034
- 主要動向
- DVB-C
- DVB-S
- DVB-T
- ハイブリッド
- MPEG-2
- MPEG-4
- アンドロイド
- USBストレージ
- その他
第8章 セットトップボックス市場推計・予測:サービス種別、2021-2034
- 主要動向
- 有料テレビ
- 無料放送
第9章 セットトップボックス市場推計・予測:スピード別、2021-2034
- 主要動向
- 100 Mbps未満
- 100Mbps~500Mbps
- 500 Mbps以上
- ギガビット速度(1 Gbps以上)
第10章 セットトップボックス市場推計・予測:用途別、2021-2034
- 主要動向
- コミュニケーション
- メディアコンテンツ
- オーディオ/ビデオ
- ゲーム
- ウェブコンテンツ
- クラウドサービス
- その他
第11章 セットトップボックス市場推計・予測:最終用途別、2021-2034
- 主要動向
- 住宅用
- 商業用
第12章 セットトップボックス市場推計・予測:流通チャネル別、2021-2034
- 主要動向
- オンライン
- 企業ウェブサイト
- eコマース
- オフライン
- 専門店
- ハイパーマーケット/スーパーマーケット
- 小売店
- その他
第13章 セットトップボックス市場推計・予測:地域別、2021-2034
- 主要動向
- 北米
- 米国
- カナダ
- 欧州
- ドイツ
- 英国
- フランス
- イタリア
- スペイン
- アジア太平洋地域
- 中国
- インド
- 日本
- 韓国
- オーストラリア
- ラテンアメリカ
- ブラジル
- メキシコ
- アルゼンチン
- 中東・アフリカ
- 南アフリカ
- サウジアラビア
- アラブ首長国連邦
第14章 企業プロファイル
- Apple
- ARRIS
- CommScope
- Dish Network
- EchoStar
- Huawei
- Humax
- Intek Digital
- Kaon Media
- Sagemcom
- Samsung
- Skyworth
- Technicolor(Vantiva)
- Vestel
- ZTE
- 発行日
- 発行
- Global Market Insights Inc.
- ページ情報
- 英文 210 Pages
- 納期
- 2~3営業日


