
|
市場調査レポート
商品コード
1844382
電流センサの市場機会、成長促進要因、産業動向分析、2025~2034年予測Current Sensor Market Opportunity, Growth Drivers, Industry Trend Analysis, and Forecast 2025 - 2034 |
||||||
カスタマイズ可能
|
|||||||
| 電流センサの市場機会、成長促進要因、産業動向分析、2025~2034年予測 |
|
出版日: 2025年09月24日
発行: Global Market Insights Inc.
ページ情報: 英文 190 Pages
納期: 2~3営業日
|

概要
電流センサの世界市場規模は、2024年に32億9,000万米ドルとなり、CAGR 10.3%で成長し、2034年には86億2,000万米ドルに達すると予測されています。
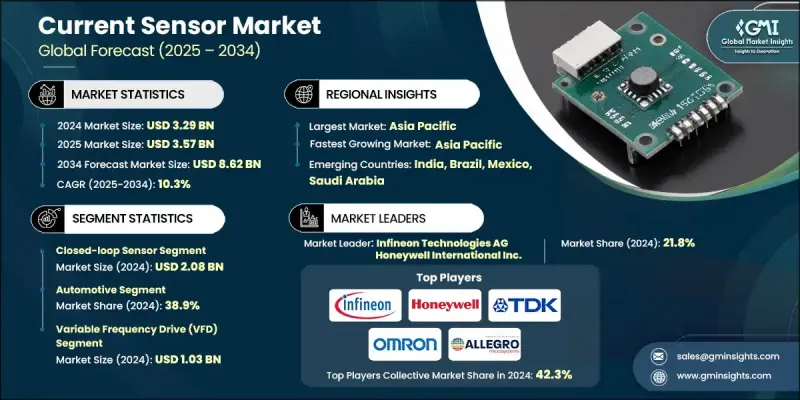
成長の原動力は、産業オートメーション、電動モビリティ、再生可能エネルギー、民生用電子機器などの分野で、高精度でエネルギー効率の高い電流センシングに対する需要が高まっていることです。電子機器の小型化・高電力化に伴い、信頼性が高く、コンパクトで絶縁された電流センサーの必要性が高まっています。クローズドループやオープンループのホール効果センサーのような技術は大量集積につながる一方、デジタルセンサーやフラックスゲートセンサーは、より高い精度と電圧ハンドリングを必要とするアプリケーションで人気を博しています。電流センサーが基本的なモーター制御や電源の監視を超えたシステムの中心になるにつれて、その存在感は電気自動車のトラクション・インバーター、バッテリー・モニタリング・システム、ソーラー・パワー・ステージ、インテリジェント・ロボットなどで高まっています。これらのセンサーは、予測診断、安全保証、性能最適化に不可欠です。新たな使用事例と、スマートエレクトロニクスにおけるリアルタイムデータ取得の重要性の高まりは、今後10年間の製品革新と市場の勢いに大きな影響を与えると予想されます。
| 市場範囲 | |
|---|---|
| 開始年 | 2024 |
| 予測年 | 2025-2034 |
| 市場規模 | 32億9,000万米ドル |
| 予測金額 | 86億2,000万米ドル |
| CAGR | 10.3% |
クローズドループセンサー分野の2024年の市場規模は20億8,000万米ドルで、オートメーション、ロボット工学、次世代スマートシステムにおける旺盛な需要を反映しています。クローズドループセンサは、正確なリアルタイムフィードバックを提供し、運用環境の制御を強化する能力で支持されています。産業用と民生用の両分野でオートメーションへの依存が高まっていることが、クローズドループ設計の役割を高めています。耐久性の向上、小型化、AI駆動システムとの統合がセールスポイントとなっています。市場力学の進化に伴い、センサーメーカーはリアルタイム分析、予測機能、シームレスな接続性を進化させ続け、クローズドループ構成をこれまで以上にインテリジェントで応答性の高いものにしています。
2024年の自動車分野のシェアは38.9%です。その優位性は、電気自動車やハイブリッド車のアーキテクチャや先進安全プラットフォームに現在のセンサーが幅広く統合されていることに支えられています。これらのコンポーネントは、バッテリー管理、車載充電、補助電子機器、トラクション・インバーターなどのシステムに不可欠です。高い絶縁性と精度基準により、EVの安全性と性能に不可欠なものとなっています。世界的な自動車の電化とインフラの成長は、このセグメントのリーダーシップを強化し続けると同時に、進化するバッテリーの化学的性質とプラットフォームの革新は、ますますカスタマイズされたセンシング・ソリューションを必要とします。
米国電流センサ2024年の市場規模は8億4,038万米ドル。EVの普及拡大、先進的な電池技術、スマートグリッドや再生可能エネルギーへの取り組みが拡大の主因。オートメーション、クラウドデータセンター、パフォーマンスエレクトロニクスにおける高精度電流センシングのニーズの高まりが需要をさらに加速しています。競争力を維持するため、メーカーは次世代EVパワートレイン、ソーラーシステム、産業機械に適した高度な電流センシング・ソリューションを設計しています。
電流センサの世界市場を牽引する主要企業には、Littelfuse, Inc.、Infineon Technologies AG、Vishay Intertechnology, Inc.、Melexis、TE Connectivity、Honeywell International Inc.、VACUUMSCHMELZE GmbH &Co.KG、Allegro MicroSystems, Inc.、LEM International SA、Sensitec GmbH、ローム株式会社、株式会社タムラ製作所、オムロン株式会社、旭化成マイクロデバイス株式会社、NVE株式会社、STマイクロエレクトロニクスN.V.、シリコンラボラトリーズ株式会社、TDK株式会社、広新電機株式会社、テキサス・インスツルメンツ・インコーポレーテッド、エースインナ株式会社電流センサ市場の各社は、生産能力を拡大し、自動車、産業、再生可能エネルギー・システムに合わせた用途別ソリューションを開発することで、世界的な存在感を高めています。小型化、精度の向上、デジタル・インターフェースや自己診断機能などのスマート機能の統合に重点が置かれています。電気自動車メーカー、ソーラー・インテグレーター、オートメーション企業との戦略的パートナーシップは、新興分野での採用を加速するのに役立っています。また、高電圧システムや過酷な環境に対応する次世代センサーを開発するため、多くの企業が研究開発に投資しています。
目次
第1章 調査手法と範囲
第2章 エグゼクティブサマリー
第3章 業界考察
- エコシステム分析
- サプライヤーの情勢
- 利益率
- コスト構造
- 各段階での付加価値
- バリューチェーンに影響を与える要因
- ディスラプション
- 影響要因
- 促進要因
- データセンターとクラウドインフラストラクチャからの需要の増加
- 高度な電流検知技術の採用
- 民生用および高性能電子機器への電流センサーの統合
- 産業および自動化システムにおける電流センサーの使用
- 自動車およびEVアプリケーションにおける電流センサーの展開
- 業界の潜在的リスク&課題
- 実装とアップグレードのコストが高め
- 代替センシング技術との競合
- 市場機会
- 促進要因
- 成長可能性分析
- 規制情勢
- 北米
- 欧州
- アジア太平洋地域
- ラテンアメリカ
- 中東・アフリカ
- ポーターの分析
- PESTEL分析
- テクノロジーとイノベーションの情勢
- 現在の技術動向
- 新興技術
- 新たなビジネスモデル
- コンプライアンス要件
- 消費者感情分析
- 特許および知的財産分析
- 地政学と貿易のダイナミクス
第4章 競合情勢
- イントロダクション
- 企業の市場シェア分析
- 地域別
- 市場集中分析
- 主要プレーヤーの競合ベンチマーキング
- 財務実績の比較
- 収益
- 利益率
- 研究開発
- 製品ポートフォリオの比較
- 製品ラインナップの広さ
- テクノロジー
- 革新
- 地理的プレゼンスの比較
- グローバルフットプリント分析
- サービスネットワークの範囲
- 地域別の市場浸透率
- 競合ポジショニングマトリックス
- リーダーたち
- 課題者たち
- フォロワー
- ニッチプレイヤー
- 戦略的展望マトリックス
- 財務実績の比較
- 主な発展, 2021-2024
- 合併と買収
- パートナーシップとコラボレーション
- 技術的進歩
- 拡大と投資戦略
- デジタル変革イニシアチブ
- 新興企業/スタートアップ企業の競合情勢
第5章 市場推計・予測:タイプ別、2021-2034
- 主要動向
- 閉ループ
- オープンループ
第6章 市場推計・予測:技術別、2021-2034
- 主要動向
- ホール効果
- シャント
- フラックスゲート
- 磁気抵抗
第7章 市場推計・予測:用途別、2021-2034
- 主要動向
- バッテリー管理システム(BMS)
- 電力分配ユニット(PDU)
- スイッチング電源(SMPS)
- UPS
- 校正ベンチ
- トラクションモーターインバーター
- オンボード充電器(OBC)
- 可変周波数ドライブ(VFD)
第8章 市場推計・予測:最終用途別、2021-2034
- 主要動向
- 自動車
- 産業
- データセンター
- ヘルスケア
- 再生可能エネルギー
- その他
第9章 市場推計・予測:地域別、2021-2034
- 主要動向
- 北米
- 米国
- カナダ
- 欧州
- 英国
- ドイツ
- フランス
- イタリア
- スペイン
- オランダ
- アジア太平洋地域
- 中国
- インド
- 日本
- 韓国
- オーストラリア
- ラテンアメリカ
- ブラジル
- メキシコ
- アルゼンチン
- 中東・アフリカ
- 南アフリカ
- サウジアラビア
- アラブ首長国連邦
第10章 企業プロファイル
- グローバルプレーヤー:
- Allegro MicroSystems, Inc.
- Asahi Kasei Microdevices Corporation
- Honeywell International Inc.
- Infineon Technologies AG
- LEM International SA
- Melexis
- STMicroelectronics N.V.
- TDK Corporation
- TE Connectivity
- Texas Instruments Incorporated
- Vishay Intertechnology, Inc.
- 地域プレイヤー:
- KOHSHIN ELECTRIC CORPORATION
- Omron Corporation
- ROHM Co., Ltd.
- Sensitec GmbH
- TAMURA Corporation
- VACUUMSCHMELZE GmbH &Co. KG
- 新興プレーヤー:
- Aceinna
- Littelfuse, Inc.
- NVE Corporation
- Silicon Laboratories

