
|
市場調査レポート
商品コード
1698560
カーゴバイク市場の機会、成長促進要因、産業動向分析、2025年~2034年の予測Cargo Bike Market Opportunity, Growth Drivers, Industry Trend Analysis, and Forecast 2025-2034 |
||||||
カスタマイズ可能
|
|||||||
| カーゴバイク市場の機会、成長促進要因、産業動向分析、2025年~2034年の予測 |
|
出版日: 2025年02月10日
発行: Global Market Insights Inc.
ページ情報: 英文 150 Pages
納期: 2~3営業日
|

全表示
- 概要
- 目次
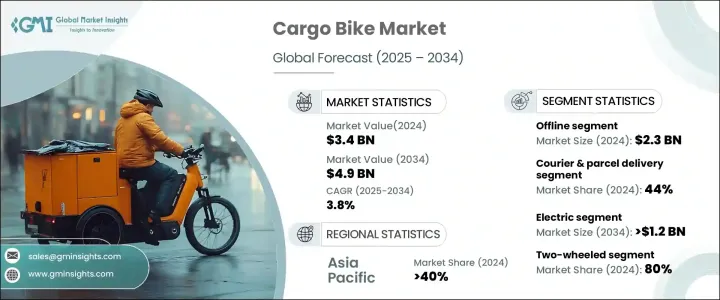
カーゴバイクの世界市場は、2024年に34億米ドルと評価され、2025年から2034年にかけてCAGR 3.8%で成長すると予測されています。
拡大するeコマース分野は、企業が費用対効果が高く、環境に優しい配送ソリューションを求めているため、カーゴバイクの需要を促進しています。物流・運輸業界の企業は、混雑した地域を楽に移動できるカーゴバイクの能力を評価し、投資を拡大しています。環境問題への関心の高まりと、持続可能な都市モビリティを推進する政府の取り組みが、市場の成長をさらに後押ししています。
さらに、カーゴバイク業界のプレーヤーは、積極的にパートナーシップを結び、生産能力を拡大し、競争力を強化するために国際市場への浸透に注力しています。アジア太平洋地域におけるカーゴバイクの生産と輸出の増加は、世界市場の拡大に寄与しています。世界各国の政府は、公害を抑制し、都市空間の混雑を緩和する政策を実施しており、実行可能な代替交通手段としてのカーゴバイクの採用を後押ししています。交通渋滞の増加に伴い、消費者はより高速で柔軟性の高い交通手段にますます目を向けるようになっており、予測期間中の市場見通しを高めると予想されます。
| 市場範囲 | |
|---|---|
| 開始年 | 2024 |
| 予測年 | 2025-2034 |
| 開始金額 | 34億米ドル |
| 予測金額 | 49億米ドル |
| CAGR | 3.8% |
市場は、販売チャネル、用途、ドライブトレイン・タイプ、車両構成によって区分されます。オフライン販売チャネルは2024年に23億米ドルを占め、今後も安定した成長が見込まれます。消費者は、特に電動カーゴバイクについて、直接相談したり、試乗したり、個別のサポートを受けたりするためにオフラインの店舗を好みます。メンテナンスや修理などのアフターサービスが受けられるため、消費者の信頼とロイヤルティが高まる。オンライン販売に人気が集まっているとはいえ、オフライン店舗が優位を保っているのは、実際に顧客に接することができ、投資保護に役立つからです。
用途別では、宅配便・小包配送分野が2024年の市場シェアの44%を占めています。eコマースの急増により、都市部において経済的で環境に優しい配送オプションを提供するカーゴバイクの需要が高まっています。企業は、物流効率を最適化しながら持続可能性目標を達成するために、カーゴバイクを業務に組み込んでいます。カーゴバイクは、信頼性の高いラストワンマイルの配送サービスを提供しながら、二酸化炭素排出量を削減することを可能にします。
ドライブトレインのタイプ別に見ると、カーゴバイク市場は電動と非電動のカテゴリーに分けられ、電動セグメントは2034年までに12億米ドルを超えると予想されています。電動カーゴバイクへの嗜好が高まっているのは、従来の車両に比べて二酸化炭素排出量が少なく、運用コストが削減できることに起因しています。非電動カーゴバイクも、フィットネスと持続可能性を優先する消費者の間で人気を集めています。電動カーゴバイクは、短距離移動のニーズに対して環境に配慮した代替手段を提供し、身体の健康に貢献しています。
市場はさらに、車両タイプ別に2輪、3輪、4輪のカーゴバイクに分類されます。2024年の市場シェアは、二輪車が80%を占めています。コンパクトで操縦性の高い二輪カーゴバイクは、都市環境での機敏な動きが支持されています。
アジア太平洋地域は2024年に世界のカーゴバイク市場をリードし、シェアの40%以上を占めました。中国は、急速な都市化とグリーン輸送を支援する政府政策の恩恵を受けており、依然として主要プレーヤーです。効率的なラストワンマイル配送ソリューションへのニーズの高まりとeコマースの拡大が、この地域の成長を支える主な要因です。
目次
第1章 調査手法と調査範囲
- 調査デザイン
- 調査アプローチ
- データ収集方法
- 基本推定と計算
- 基準年の算出
- 市場推計の主要動向
- 予測モデル
- 1次調査と検証
- 市場定義
第2章 エグゼクティブサマリー
第3章 業界洞察
- エコシステム分析
- サプライヤーの状況
- 原材料サプライヤー
- 部品サプライヤー
- メーカー
- サービス・プロバイダー
- 販売業者
- 最終用途
- 利益率分析
- コスト内訳分析
- テクノロジーとイノベーションの展望
- 主要ニュースと取り組み
- 規制状況
- 影響要因
- 促進要因
- 環境に優しい都市交通ソリューションの普及
- ラスト・マイル・デリバリー・サービスへの需要の高まり
- 環境に優しい輸送手段に対する政府の支援
- 重い荷物を積載できる電動カーゴバイクの能力向上
- 都市の混雑が代替輸送の導入を促進
- 業界の潜在的リスク&課題
- 充電インフラが整っていない地域での航続距離の制限
- 悪天候による季節的利用の影響
- 促進要因
- 成長可能性分析
- ポーター分析
- PESTEL分析
第4章 競合情勢
- イントロダクション
- 企業シェア分析
- 競合のポジショニング・マトリックス
- 戦略展望マトリックス
第5章 市場推計・予測:自動車別、2021年~2034年
- 主要動向
- 二輪
- 三輪
- 四輪
第6章 市場推計・予測:販売チャネル別、2021年~2034年
- 主要動向
- オンライン
- オフライン
第7章 市場推計・予測:ドライブトレイン別、2021年~2034年
- 主要動向
- 電動
- 非電動
第8章 市場推計・予測:用途別、2021年~2034年
- 主要動向
- 宅配便・小包配送
- 電気式
- 非電化
- フードデリバリー
- 電気式
- 非電化
- その他
- 電気
- 非電化
第9章 市場推計・予測:地域別、2021年~2034年
- 主要動向
- 北米
- 米国
- カナダ
- 欧州
- 英国
- ドイツ
- フランス
- スペイン
- イタリア
- ロシア
- 北欧
- アジア太平洋
- 中国
- インド
- 日本
- 韓国
- オーストラリア
- 東南アジア
- ラテンアメリカ
- ブラジル
- アルゼンチン
- メキシコ
- 中東・アフリカ
- UAE
- 南アフリカ
- サウジアラビア
第10章 企業プロファイル
- Babboe
- Benno Bikes
- Bergamont
- Butchers &Bicycles
- Carqon
- Christiania Bikes
- Douze Cycles
- Giant Bicycles
- Larry vs Harry(Bullitt)
- Madsen Cycles
- Nihola
- Omnium Cargo
- Rad Power Bikes
- Raleigh UK
- Riese &Müller
- Tern Bicycles
- Triobike
- Urban Arrow
- Xtracycle
- Yuba Bicycles
The Global Cargo Bike Market, valued at USD 3.4 billion in 2024, is projected to grow at a CAGR of 3.8% from 2025 to 2034. The expanding e-commerce sector is fueling demand for cargo bikes as businesses seek cost-effective, eco-friendly delivery solutions. Companies in the logistics and transportation industry are ramping up investments in cargo bikes, recognizing their ability to navigate congested areas with ease. Increasing environmental concerns and government initiatives to promote sustainable urban mobility are further driving market growth.
Additionally, players in the cargo bike industry are actively forming partnerships, expanding production capacities, and focusing on international market penetration to strengthen their competitive position. The rising production and export of cargo bikes in the Asia Pacific region are contributing to global market expansion. Governments worldwide are implementing policies to curb pollution and decongest urban spaces, boosting the adoption of cargo bikes as a viable transportation alternative. With rising traffic congestion, consumers are increasingly turning to faster and more flexible modes of transport, which is expected to enhance the market outlook over the forecast period.
| Market Scope | |
|---|---|
| Start Year | 2024 |
| Forecast Year | 2025-2034 |
| Start Value | $3.4 Billion |
| Forecast Value | $4.9 Billion |
| CAGR | 3.8% |
The market is segmented based on sales channels, applications, drivetrain types, and vehicle configurations. The offline sales channel accounted for USD 2.3 billion in 2024 and is anticipated to maintain steady growth. Consumers prefer offline stores for direct consultation, test rides, and personalized assistance, especially for electric cargo bikes. The availability of after-sales services, such as maintenance and repairs, enhances consumer trust and loyalty. While online sales are gaining traction, offline stores continue to dominate due to their hands-on customer experience and investment protection benefits.
In terms of application, the courier and parcel delivery segment held 44% of the market share in 2024. The surge in e-commerce activity is increasing the demand for cargo bikes, as they offer an economical and environmentally friendly delivery option in urban areas. Businesses are integrating cargo bikes into their operations to meet sustainability targets while optimizing logistics efficiency. Cargo bikes allow companies to cut carbon emissions while providing reliable last-mile delivery services.
By drivetrain type, the cargo bike market is divided into electric and non-electric categories, with the electric segment expected to surpass USD 1.2 billion by 2034. The growing preference for electric cargo bikes stems from their lower carbon footprint and reduced operating costs compared to conventional vehicles. Non-electric cargo bikes are also gaining popularity among consumers who prioritize fitness and sustainability. These bikes contribute to physical well-being, offering an eco-conscious alternative for short-distance transportation needs.
The market is further categorized by vehicle type into two-wheeled, three-wheeled, and four-wheeled cargo bikes. The two-wheeled segment dominated in 2024, holding 80% of the market share. Compact and highly maneuverable, two-wheeled cargo bikes are favored for their agility in urban settings.
Asia Pacific led the global cargo bike market in 2024, holding over 40% of the share. China remains a key player, benefiting from rapid urbanization and government policies supporting green transportation. The increasing need for efficient last-mile delivery solutions and the expanding e-commerce landscape are key factors sustaining growth in the region.
Table of Contents
Chapter 1 Methodology & Scope
- 1.1 Research design
- 1.1.1 Research approach
- 1.1.2 Data collection methods
- 1.2 Base estimates and calculations
- 1.2.1 Base year calculation
- 1.2.2 Key trends for market estimates
- 1.3 Forecast model
- 1.4 Primary research & validation
- 1.4.1 Primary sources
- 1.4.2 Data mining sources
- 1.5 Market definitions
Chapter 2 Executive Summary
- 2.1 Industry 3600 synopsis, 2021 - 2034
Chapter 3 Industry Insights
- 3.1 Industry ecosystem analysis
- 3.2 Supplier landscape
- 3.2.1 Raw material supplier
- 3.2.2 Component supplier
- 3.2.3 Manufacturer
- 3.2.4 Service provider
- 3.2.5 Distributor
- 3.2.6 End use
- 3.3 Profit margin analysis
- 3.4 Cost breakdown analysis
- 3.5 Technology & innovation landscape
- 3.6 Key news & initiatives
- 3.7 Regulatory landscape
- 3.8 Impact forces
- 3.8.1 Growth drivers
- 3.8.1.1 Eco-friendly urban transport solutions gaining traction
- 3.8.1.2 Increasing demand for last-mile delivery services
- 3.8.1.3 Government support for green transportation alternatives
- 3.8.1.4 Improved electric cargo bike capacity for heavier loads
- 3.8.1.5 Urban congestion driving alternative transport adoption
- 3.8.2 Industry pitfalls & challenges
- 3.8.2.1 Limited range in areas lacking charging infrastructure
- 3.8.2.2 Seasonal usage affected by adverse weather conditions
- 3.8.1 Growth drivers
- 3.9 Growth potential analysis
- 3.10 Porter's analysis
- 3.11 PESTEL analysis
Chapter 4 Competitive Landscape, 2024
- 4.1 Introduction
- 4.2 Company market share analysis
- 4.3 Competitive positioning matrix
- 4.4 Strategic outlook matrix
Chapter 5 Market Estimates & Forecast, By Vehicle, 2021 - 2034 ($Mn & Units)
- 5.1 Key trends
- 5.2 Two-wheeled
- 5.3 Three-wheeled
- 5.4 Four-wheeled
Chapter 6 Market Estimates & Forecast, By Sales Channel, 2021 - 2034 ($Mn & Units)
- 6.1 Key trends
- 6.2 Online
- 6.3 Offline
Chapter 7 Market Estimates & Forecast, By Drivetrain, 2021 - 2034 ($Mn & Units)
- 7.1 Key trends
- 7.2 Electric
- 7.3 Non-electric
Chapter 8 Market Estimates & Forecast, By Application, 2021 - 2034 ($Mn & Units)
- 8.1 Key trends
- 8.2 Courier & parcel delivery
- 8.2.1 Electric
- 8.2.2 Non-electric
- 8.3 Food delivery
- 8.3.1 Electric
- 8.3.2 Non-electric
- 8.4 Others
- 8.4.1 Electric
- 8.4.2 Non-electric
Chapter 9 Market Estimates & Forecast, By Region, 2021 - 2034 ($Mn & Units)
- 9.1 Key trends
- 9.2 North America
- 9.2.1 U.S.
- 9.2.2 Canada
- 9.3 Europe
- 9.3.1 UK
- 9.3.2 Germany
- 9.3.3 France
- 9.3.4 Spain
- 9.3.5 Italy
- 9.3.6 Russia
- 9.3.7 Nordics
- 9.4 Asia Pacific
- 9.4.1 China
- 9.4.2 India
- 9.4.3 Japan
- 9.4.4 South Korea
- 9.4.5 Australia
- 9.4.6 Southeast Asia
- 9.5 Latin America
- 9.5.1 Brazil
- 9.5.2 Argentina
- 9.5.3 Mexico
- 9.6 MEA
- 9.6.1 UAE
- 9.6.2 South Africa
- 9.6.3 Saudi Arabia
Chapter 10 Company Profiles
- 10.1 Babboe
- 10.2 Benno Bikes
- 10.3 Bergamont
- 10.4 Butchers & Bicycles
- 10.5 Carqon
- 10.6 Christiania Bikes
- 10.7 Douze Cycles
- 10.8 Giant Bicycles
- 10.9 Larry vs Harry (Bullitt)
- 10.10 Madsen Cycles
- 10.11 Nihola
- 10.12 Omnium Cargo
- 10.13 Rad Power Bikes
- 10.14 Raleigh UK
- 10.15 Riese & Müller
- 10.16 Tern Bicycles
- 10.17 Triobike
- 10.18 Urban Arrow
- 10.19 Xtracycle
- 10.20 Yuba Bicycles

