|
|
市場調査レポート
商品コード
1266821
宅配ロボット市場- ソリューション別(ハードウェア、ソフトウェア)、車輪数別(2輪ロボット、3輪ロボット、4輪ロボット、6輪ロボット)、エンドユーザー別(食品・飲料、小売、ヘルスケア、郵便)&予測、2023年~2032年Delivery Robot Market - By Solution (Hardware, Software), By Number of wheels (2-wheel robots, 3-wheel robots, 4-wheel robots, 6-wheel robots), By End-Use (Food & Beverage, Retail, Healthcare, Postal Service) & Forecast, 2023 - 2032 |
||||||
|
|
|||||||
|
● お客様のご希望に応じて、既存データの加工や未掲載情報(例:国別セグメント)の追加などの対応が可能です。 詳細はお問い合わせください。 |
|||||||


| 宅配ロボット市場- ソリューション別(ハードウェア、ソフトウェア)、車輪数別(2輪ロボット、3輪ロボット、4輪ロボット、6輪ロボット)、エンドユーザー別(食品・飲料、小売、ヘルスケア、郵便)&予測、2023年~2032年 |
|
出版日: 2023年04月19日
発行: Global Market Insights Inc.
ページ情報: 英文 248 Pages
納期: 2~3営業日
|
- 全表示
- 概要
- 図表
- 目次
宅配ロボットの世界市場規模は、大学構内での宅配ロボットの利用拡大により、2032年まで大きく拡大すると予想されています。
米国内の多くの大学では、大学の敷地内で宅配ロボットの有効性をテストするために、宅配ロボットの利用が増加しています。実際、オハイオ州立大学は、歩道宅配ロボット企業であるカートケンと提携し、50台の完全自動宅配ロボットをテストしたような機関の1つです。
別の例を挙げると、2022年12月、ラストマイル宅配ロボット企業であるKiwibotは、大学構内での次世代ロボット配送のために、著名な食品注文マーケットプレイスであるGrubhubと契約を締結しました。この分野における製品イノベーションのエスカレートは、業界の情勢にさらにプラスの影響を与えています。例えば、2022年8月、著名な自律型宅配ロボットメーカーであるオットノミーは、第2世代の宅配ロボットであるオットボット2.0の発売を発表しました。
宅配ロボット市場全体は、コンポーネント、車輪の数、最終用途、地域に基づいて区分されます。
コンポーネント別では、ソフトウェア分野の市場規模が2032年まで大きな伸びを示すと予想されています。主なロボットメーカーが優れた機能を持つ宅配ロボットの開発に向けた取り組みを強化していることが、ソフトウェア・コンポーネントの需要を高めています。さらに、スターシップ・テクノロジーズなど多くの業界関係者は、自動運転宅配ロボットのテストプログラムに投資しており、これがセグメントの成長を促進すると予想されます。
3輪宅配ロボットの業界規模は、2032年までに5億米ドル以上になると予想されています。これらのロボットは耐久性が高く、長期間の使用に適しているため、採用が進んでいます。また、どの方向へも素早く移動できるため、配送プロセスの最適化に貢献します。また、2輪のロボットと比較して、高い効率性を持っています。業界の主要企業が最先端の3輪宅配ロボットを発売することに注力するようになったことで、セグメントの拡大にさらにプラスに働くでしょう。
最終用途別では、小売チェーンがラストマイル配送システムの強化に力を入れていることから、2032年まで小売分野の宅配ロボット市場シェアが大幅に拡大すると予想されています。TargetやWalmartなどの多くの小売大手は、ワークフローの効率を最適化するために宅配ロボットに投資しています。宅配ロボットは、予測可能な配送を保証し、小売スペースを高度に補完します。また、配送に伴う手作業のミスをなくすことで、より迅速なラストワンマイルの配送を可能にし、小売店の生産性を向上させることができます。
地域別では、アジア太平洋地域の宅配ロボット産業は、2032年までに30億米ドル以上に達すると予想されています。アリババ・グループなどの業界関係者が製品のイノベーションに投資しており、この地域の産業の成長に寄与しています。さらに、中国や日本などの新興国における急速な都市化により、eコマース分野での需要増に対応するための宅配ロボットへの需要が高まっています。
目次
第1章 調査手法と範囲
第2章 エグゼクティブサマリー
第3章 宅配ロボットの業界洞察
- COVID-19の発生別影響について
- 北米
- 欧州
- アジア太平洋地域
- LAMEA
- ロシア・ウクライナ戦争別影響
- 宅配ロボットの業界エコシステム分析
- 原材料の仕入れ先
- メーカー
- ソフトウェア&テクノロジープロバイダー
- サービスプロバイダー
- 流通チャネル分析
- エンドユーザー
- ベンダーマトリクス
- テクノロジー&イノベーションの展望
- 5GとAI別ロボティクス
- IoTとインダストリー4.0がもたらすインパクト
- クラウドロボティクス
- モノのインターネット(IoT)
- マシンビジョン認識
- ロボットアーム
- 特許分析
- 主なニュース&取り組み
- 規制状況について
- 国際規格
- ISO 18646-2:2019 - ロボティクス-サービスロボットの性能基準および関連試験方法
- ISO 13482
- 北米
- 労働安全衛生法(OSHA)
- STD 01-12-002
- UL 1740[57]ロボットおよびロボット機器
- 欧州
- RIA 15.06-2013
- 先進的なロボットと自律システムのためのEU製品安全フレームワーク
- 人工知能法
- アジア太平洋地域
- 集積回路のレイアウト設計の保護に関する規定
- 知能ロボットの開発・流通促進法韓国
- 南米
- NR-12
- 政令第5452号
- MEA
- アラブ首長国連邦(GCC)有害物質使用制限(RoHS)規制について
- 国際規格
- 業界への影響要因
- 促進要因
- 小売業における宅配ロボットの活用が進む
- 病院・ヘルスケア産業の成長
- 大学構内で増加する宅配ロボットの活用法
- eコマースやオンライン食品産業の台頭
- ロボット製造企業に対する政府の取り組みと投資の増加
- 業界の潜在的リスク&課題
- 高額な初期投資別新規参入の制限
- 促進要因
- 成長性分析
- ポーター分析
- PESTEL分析
第4章 競合情勢、2022年
- イントロダクション
- 各社の市場シェア、2022年
- 主な市場参入企業、2022年
- JD.com
- Alibaba Group (Cainiao Smart Logistics Network Limited)
- Kiwibot
- Nuro
- Relay Robotics
- ST Engineering
- Starship Technologies
- 競合のポジショニングマトリックス
- 戦略的展望マトリクス
第5章 宅配ロボット市場:ソリューション別
- 主な動向:ソリューション別
- ハードウェア
- ソフトウェア
第6章 宅配ロボット市場:エンドユーズ別
- 主な動向:エンドユーズ別
- 飲食品
- 小売
- ヘルスケア
- 郵政事業
- その他
第7章 宅配ロボット市場:車輪の数別
- 主な動向:ホイール数別
- 2輪ロボット
- 3輪ロボット
- 4輪ロボット
- 6輪ロボット
第8章 宅配ロボット市場:地域別内訳
- 主な動向(地域別
- 北米
- 米国
- カナダ
- 欧州
- 英国
- ドイツ
- フランス
- イタリア
- スペイン
- アジア太平洋地域
- 中国
- インド
- 日本
- 韓国
- 台湾
- LAMEA
- ブラジル
- メキシコ
- GCC
- 南アフリカ
第9章 企業プロファイル
- Alibaba Group
- Alpha Asimov
- Boston Dynamics
- Eliport
- JD.com(Jingdong)
- Kiwibot
- Nuro
- Ottonomy
- Panasonic Corporation
- Piaggio & C. SpA
- Relay Robotics
- Richtech Robotics
- Starship Technologies
- ST Engineering
- Suzhou Pangolin Robot Corp(CSJBot)
Data Tables
- TABLE 1. Regional delivery robot market share, 2022 (%)
- TABLE 2. North America market share, by region, 2022
- TABLE 3. Average Selling Price (ASP), By 2-Wheels, (2018 - 2022) (USD)
- TABLE 4. Average Selling Price (ASP), By 3-Wheels, (2018 - 2022) (USD)
- TABLE 5. Average Selling Price (ASP), By 4-Wheels, (2018 - 2022) (USD)
- TABLE 6. Average Selling Price (ASP), By 6-Wheels, (2018 - 2022) (USD)
- TABLE 7. U.S. market revenue, by number of wheels, 2022 (USD Million)
- TABLE 8. Delivery robot market, 2018 - 2022 (USD Million, Units)
- TABLE 9. Delivery robot market, 2023 - 2032 (USD Million, Units)
- TABLE 10. TAM of delivery robot market, 2023 - 2032 (USD Million)
- TABLE 11. Global delivery robot market, by region, 2018 - 2022 (USD Million)
- TABLE 12. Global delivery robot market, by region, 2023 - 2032(USD Million)
- TABLE 13. Global delivery robot market, by solution, 2018 - 2022(USD Million)
- TABLE 14. Global delivery robot market, by solution 2022 - 2032(USD Million)
- TABLE 15. Global delivery robot market, by wheel, 2018 - 2022(USD Million)
- TABLE 16. Global delivery robot market, by wheel, 2022 - 2032(USD Million)
- TABLE 17. Global delivery robot market, by wheel, 2018 - 2022(Units)
- TABLE 18. Global delivery robot market, by wheel, 2022 - 2032(Units)
- TABLE 19. Global delivery robot market, by application, 2018 - 2022(USD Million)
- TABLE 20. Global delivery robot market, by application, 2022 - 2032(USD Million)
- TABLE 21. Global delivery robot market, by application, 2018 - 2022(Units)
- TABLE 22. Global delivery robot market, by application, 2022 - 2032(Units)
- TABLE 23. COVID-19 impact on North America delivery robot market
- TABLE 24. COVID-19 impact on Europe delivery robot market
- TABLE 25. COVID-19 impact on Asia Pacific delivery robot market
- TABLE 26. COVID-19 impact on Latin America delivery robot market
- TABLE 27. COVID-19 impact on MEA delivery robot market
- TABLE 28. Patent analysis
- TABLE 29. Growth potential analysis, 2022
- TABLE 30. Company market share, 2022
- TABLE 31. Competitive analysis of prominent market players
- TABLE 32. Competitive positioning matrix: Classification criteria
- TABLE 33. Strategic outlook matrix: Classification criteria
- TABLE 34 Hardware market size, 2023 - 2032 (USD Million)
- TABLE 35 Hardware market size, 2023 - 2032 (USD Million)
- TABLE 36 Software market size, 2018 - 2022 (USD Million)
- TABLE 37 Software market size, 2023 - 2032 (USD Million)
- TABLE 38 2-wheel robots market size, 2018 - 2022 (USD Million, Units)
- TABLE 39 2-wheel robots market size, 2023 - 2032 (USD Million, Units)
- TABLE 40 3-wheel robots market size, 2018 - 2022 (USD Million, Units)
- TABLE 41 3-wheel robots market size, 2023 - 2032 (USD Million, Units)
- TABLE 42 4-wheel robots market size, 2018 - 2022 (USD Million, Units)
- TABLE 43 4-wheel robots market size, 2023 - 2032 (USD Million, Units)
- TABLE 44 6-wheel robots market size, 2018 - 2022 (USD Million, Units)
- TABLE 45 6-wheel robots market size, 2023 - 2032 (USD Million, Units)
- TABLE 46 Food & beverage market size, 2018 - 2022 (USD Million, Units)
- TABLE 47 Food & beverage market size, 2023 - 2032 (USD Million, Units)
- TABLE 48 Retail market size, 2018 - 2022 (USD Million, Units)
- TABLE 49 Retail market size, 2023 - 2032 (USD Million, Units)
- TABLE 50 Healthcare market size, 2018 - 2022 (USD Million, Units)
- TABLE 51 Healthcare market size, 2023 - 2032 (USD Million, Units)
- TABLE 52 Postal service market size, 2018 - 2022 (USD Million, Units)
- TABLE 53 Postal service market size, 2023 - 2032 (USD Million, Units)
- TABLE 54 North America delivery robot market, 2018 - 2022 (USD Million, Units)
- TABLE 55 North America delivery robot market, 2023 - 2032 (USD Million, Units)
- TABLE 56 North America delivery robot market, by solution, 2018 - 2022 (USD Million, Units)
- TABLE 57 North America delivery robot market, by solution, 2023 - 2032 (USD Million, Units)
- TABLE 58 North America delivery robot market, by number of wheels, 2018 - 2022 (USD Million, Units)
- TABLE 59 North America delivery robot market, by number of wheels, 2023 - 2032 (USD Million, Units)
- TABLE 60 North America delivery robot market, by end-use, 2018 - 2022 (USD Million, Units)
- TABLE 61 North America delivery robot market, by end-use, 2023 - 2032 (USD Million, Units)
- TABLE 62 U.S. delivery robot market, 2023 - 2032 (USD Million, Units)
- TABLE 63 U.S. delivery robot market, by solution, 2018 - 2022 (USD Million, Units)
- TABLE 64 U.S. delivery robot market, by solution, 2023 - 2032 (USD Million, Units)
- TABLE 65 U.S. delivery robot market, by application, 2018 - 2022 (USD Million, Units)
- TABLE 66 U.S. delivery robot market, by application, 2023 - 2032 (USD Million, Units)
- TABLE 67 U.S. delivery robot market, by number of wheels, 2018 - 2022 (USD Million, Units)
- TABLE 68 U.S. delivery robot market, by number of wheels, 2023 - 2032 (USD Million, Units)
- TABLE 69 Canada delivery robot market, 2018 - 2022 (USD Million, Units)
- TABLE 70 Canada delivery robot market, 2023 - 2032 (USD Million, Units)
- TABLE 71 Canada delivery robot market, by solution, 2018 - 2022 (USD Million, Units)
- TABLE 72 Canada delivery robot market, by solution, 2023 - 2032 (USD Million, Units)
- TABLE 73 Canada delivery robot market, by application, 2018 - 2022 (USD Million, Units)
- TABLE 74 Canada delivery robot market, by application, 2023 - 2032 (USD Million, Units)
- TABLE 75 Canada delivery robot market, by number of wheels, 2018 - 2022 (USD Million, Units)
- TABLE 76 Canada delivery robot market, by number of wheels, 2023 - 2032 (USD Million, Units)
- TABLE 77 Europe delivery robot market, 2018 - 2022 (USD Million, Units)
- TABLE 78 Europe delivery robot market, 2023 - 2032 (USD Million, Units)
- TABLE 79 Europe delivery robot market, by solution, 2018 - 2022 (USD Million, Units)
- TABLE 80 Europe delivery robot market, by solution, 2023 - 2032 (USD Million, Units)
- TABLE 81 Europe delivery robot market, by application, 2018 - 2022 (USD Million, Units)
- TABLE 82 Europe delivery robot market, by application, 2023 - 2032 (USD Million, Units)
- TABLE 83 Europe delivery robot market, by number of wheels, 2018 - 2022 (USD Million, Units)
- TABLE 84 Europe delivery robot market, by number of wheels, 2023 - 2032 (USD Million, Units)
- TABLE 85 UK delivery robot market, 2018 - 2022 (USD Million, Units)
- TABLE 86 UK delivery robot market, 2023 - 2032 (USD Million, Units)
- TABLE 87 UK delivery robot market, by solution, 2018 - 2022 (USD Million, Units)
- TABLE 88 UK delivery robot market, by solution, 2023 - 2032 (USD Million, Units)
- TABLE 89 UK delivery robot market, by application, 2018 - 2022 (USD Million, Units)
- TABLE 90 UK delivery robot market, by application, 2023 - 2032 (USD Million, Units)
- TABLE 91 UK delivery robot market, by number of wheels, 2018 - 2022 (USD Million, Units)
- TABLE 92 UK delivery robot market, by number of wheels, 2023 - 2032 (USD Million, Units)
- TABLE 93 Germany delivery robot market, 2018 - 2022 (USD Million, Units)
- TABLE 94 Germany delivery robot market, 2023 - 2032 (USD Million, Units)
- TABLE 95 Germany delivery robot market, by solution, 2018 - 2022 (USD Million, Units)
- TABLE 96 Germany delivery robot market, by solution, 2023 - 2032 (USD Million, Units)
- TABLE 97 Germany delivery robot market, by application, 2018 - 2022 (USD Million, Units)
- TABLE 98 Germany delivery robot market, by application, 2023 - 2032 (USD Million, Units)
- TABLE 99 Germany delivery robot market, by number of wheels, 2018 - 2022 (USD Million, Units)
- TABLE 100 Germany delivery robot market, by number of wheels, 2023 - 2032 (USD Million, Units)
- TABLE 101 France delivery robot market, 2018 - 2022 (USD Million, Units)
- TABLE 102 France delivery robot market, 2023 - 2032 (USD Million, Units)
- TABLE 103 France delivery robot market, by solution, 2018 - 2022 (USD Million, Units)
- TABLE 104 France delivery robot market, by solution, 2023 - 2032 (USD Million, Units)
- TABLE 105 France delivery robot market, by application, 2018 - 2022 (USD Million, Units)
- TABLE 106 France delivery robot market, by application, 2023 - 2032 (USD Million, Units)
- TABLE 107 France delivery robot market, by number of wheels, 2018 - 2022 (USD Million, Units)
- TABLE 108 France delivery robot market, by number of wheels, 2023 - 2032 (USD Million, Units)
- TABLE 109 Italy delivery robot market, 2018 - 2022 (USD Million, Units)
- TABLE 110 Italy delivery robot market, 2023 - 2032 (USD Million, Units)
- TABLE 111 Italy delivery robot market, by solution, 2018 - 2022 (USD Million, Units)
- TABLE 112 Italy delivery robot market, by solution, 2023 - 2032 (USD Million, Units)
- TABLE 113 Italy delivery robot market, by application, 2018 - 2022 (USD Million, Units)
- TABLE 114 Italy delivery robot market, by application, 2023 - 2032 (USD Million)
- TABLE 115 Italy delivery robot market, by number of wheels, 2018 - 2022 (USD Million, Units)
- TABLE 116 Italy delivery robot market, by number of wheels, 2023 - 2032 (USD Million, Units)
- TABLE 117 Spain delivery robot market, 2018 - 2022 (USD Million, Units)
- TABLE 118 Spain delivery robot market, 2023 - 2032 (USD Million, Units)
- TABLE 119 Spain delivery robot market, by solution, 2018 - 2022 (USD Million, Units)
- TABLE 120 Spain delivery robot market, by solution, 2023 - 2032 (USD Million, Units)
- TABLE 121 Spain delivery robot market, by application, 2018 - 2022 (USD Million, Units)
- TABLE 122 Spain delivery robot market, by application, 2023 - 2032 (USD Million, Units)
- TABLE 123 Spain delivery robot market, by number of wheels, 2018 - 2022 (USD Million, Units)
- TABLE 124 Spain delivery robot market, by number of wheels, 2023 - 2032 (USD Million, Units)
- TABLE 125 Asia Pacific delivery robot market, 2018 - 2022 (USD Million, Units)
- TABLE 126 Asia Pacific delivery robot market, 2023 - 2032 (USD Million, Units)
- TABLE 127 Asia Pacific delivery robot market, by solution, 2018 - 2022 (USD Million, Units)
- TABLE 128 Asia Pacific delivery robot market, by solution, 2023 - 2032 (USD Million, Units)
- TABLE 129 Asia Pacific delivery robot market, by application, 2018 - 2022 (USD Million, Units)
- TABLE 130 Asia Pacific delivery robot market, by application, 2023 - 2032 (USD Million, Units)
- TABLE 131 Asia Pacific delivery robot market, by number of wheels, 2018 - 2022 (USD Million, Units)
- TABLE 132 Asia Pacific delivery robot market, by number of wheels, 2023 - 2032 (USD Million, Units)
- TABLE 133 China delivery robot market, 2018 - 2022 (USD Million, Units)
- TABLE 134 China delivery robot market, 2023 - 2032 (USD Million, Units)
- TABLE 135 China delivery robot market, by solution, 2018 - 2022 (USD Million, Units)
- TABLE 136 China delivery robot market, by solution, 2023 - 2032 (USD Million, Units)
- TABLE 137 China delivery robot market, by application, 2018 - 2022 (USD Million, Units)
- TABLE 138 China delivery robot market, by application, 2023 - 2032 (USD Million, Units)
- TABLE 139 China delivery robot market, by number of wheels, 2018 - 2022 (USD Million, Units)
- TABLE 140 China delivery robot market, by number of wheels, 2023 - 2032 (USD Million, Units)
- TABLE 141 India delivery robot market, 2018 - 2022 (USD Million, Units)
- TABLE 142 India delivery robot market, 2023 - 2032 (USD Million, Units)
- TABLE 143 India delivery robot market, by solution, 2018 - 2022 (USD Million, Units)
- TABLE 144 India delivery robot market, by solution, 2023 - 2032 (USD Million, Units)
- TABLE 145 India delivery robot market, by application, 2018 - 2022 (USD Million, Units)
- TABLE 146 India delivery robot market, by application, 2023 - 2032 (USD Million, Units)
- TABLE 147 India delivery robot market, by number of wheels, 2018 - 2022 (USD Million, Units)
- TABLE 148 India delivery robot market, by number of wheels, 2023 - 2032 (USD Million, Units)
- TABLE 149 Japan delivery robot market, 2018 - 2022 (USD Million, Units)
- TABLE 150 Japan delivery robot market, 2023 - 2032 (USD Million, Units)
- TABLE 151 Japan delivery robot market, by solution, 2018 - 2022 (USD Million, Units)
- TABLE 152 Japan delivery robot market, by solution, 2023 - 2032 (USD Million, Units)
- TABLE 153 Japan delivery robot market, by application, 2018 - 2022 (USD Million, Units)
- TABLE 154 Japan delivery robot market, by application, 2023 - 2032 (USD Million, Units)
- TABLE 155 Japan delivery robot market, by number of wheels, 2018 - 2022 (USD Million, Units)
- TABLE 156 Japan delivery robot market, by number of wheels, 2023 - 2032 (USD Million, Units)
- TABLE 157 South Korea delivery robot market, 2018 - 2022 (USD Million, Units)
- TABLE 158 South Korea delivery robot market, 2023 - 2032 (USD Million, Units)
- TABLE 159 South Korea delivery robot market, by solution, 2018 - 2022 (USD Million, Units)
- TABLE 160 South Korea delivery robot market, by solution, 2023 - 2032 (USD Million, Units)
- TABLE 161 South Korea delivery robot market, by application, 2018 - 2022 (USD Million, Units)
- TABLE 162 South Korea delivery robot market, by application, 2023 - 2032 (USD Million, Units)
- TABLE 163 South Korea delivery robot market, by number of wheels, 2018 - 2022 (USD Million, Units)
- TABLE 164 South Korea delivery robot market, by number of wheels, 2023 - 2032 (USD Million, Units)
- TABLE 165 Taiwan delivery robot market, 2018 - 2022 (USD Million, Units)
- TABLE 166 Taiwan delivery robot market, 2023 - 2032 (USD Million, Units)
- TABLE 167 Taiwan delivery robot market, by solution, 2018 - 2022 (USD Million, Units)
- TABLE 168 Taiwan delivery robot market, by solution, 2023 - 2032 (USD Million, Units)
- TABLE 169 Taiwan delivery robot market, by application, 2018 - 2022 (USD Million, Units)
- TABLE 170 Taiwan delivery robot market, by application, 2023 - 2032 (USD Million, Units)
- TABLE 171 Taiwan delivery robot market, by number of wheels, 2018 - 2022 (USD Million, Units)
- TABLE 172 Taiwan delivery robot market, by number of wheels, 2023 - 2032 (USD Million, Units)
- TABLE 173 LAMEA delivery robot market, 2018 - 2022 (USD Million, Units)
- TABLE 174 LAMEA delivery robot market, 2023 - 2032 (USD Million, Units)
- TABLE 175 LAMEA delivery robot market, by solution, 2018 - 2022 (USD Million, Units)
- TABLE 176 LAMEA delivery robot market, by solution, 2023 - 2032 (USD Million, Units)
- TABLE 177 LAMEA delivery robot market, by application, 2018 - 2022 (USD Million, Units)
- TABLE 178 LAMEA delivery robot market, by application, 2023 - 2032 (USD Million, Units)
- TABLE 179 LAMEA commercial delivery robot market, by solution, 2018 - 2022 (USD Million, Units)
- TABLE 180 LAMEA commercial delivery robot market, by solution, 2023 - 2032 (USD Million, Units)
- TABLE 181 LAMEA residential delivery robot market, by solution, 2018 - 2022 (USD Million, Units)
- TABLE 182 LAMEA residential delivery robot market, by solution, 2023 - 2032 (USD Million, Units)
- TABLE 183 Brazil delivery robot market, 2018 - 2022 (USD Million, Units)
- TABLE 184 Brazil delivery robot market, 2023 - 2032 (USD Million, Units)
- TABLE 185 Brazil delivery robot market, by solution, 2018 - 2022 (USD Million, Units)
- TABLE 186 Brazil delivery robot market, by solution, 2023 - 2032 (USD Million, Units)
- TABLE 187 Brazil delivery robot market, by application, 2018 - 2022 (USD Million, Units)
- TABLE 188 Brazil delivery robot market, by application, 2023 - 2032 (USD Million, Units)
- TABLE 189 Brazil delivery robot market, by number of wheels, 2018 - 2022 (USD Million, Units)
- TABLE 190 Brazil delivery robot market, by number of wheels, 2023 - 2032 (USD Million, Units)
- TABLE 191 Mexico delivery robot market, 2018 - 2022 (USD Million, Units)
- TABLE 192 Mexico delivery robot market, 2023 - 2032 (USD Million, Units)
- TABLE 193 Mexico delivery robot market, by solution, 2018 - 2022 (USD Million, Units)
- TABLE 194 Mexico delivery robot market, by solution, 2023 - 2032 (USD Million, Units)
- TABLE 195 Mexico delivery robot market, by application, 2018 - 2022 (USD Million, Units)
- TABLE 196 Mexico delivery robot market, by application, 2023 - 2032 (USD Million, Units)
- TABLE 197 Mexico delivery robot market, by number of wheels, 2018 - 2022 (USD Million, Units)
- TABLE 198 Mexico delivery robot market, by number of wheels, 2023 - 2032 (USD Million, Units)
- TABLE 199 GCC delivery robot market, 2018 - 2022 (USD Million, Units)
- TABLE 200 GCC delivery robot market, 2023 - 2032 (USD Million, Units)
- TABLE 201 GCC delivery robot market, by solution, 2018 - 2022 (USD Million, Units)
- TABLE 202 GCC delivery robot market, by solution, 2023 - 2032 (USD Million, Units)
- TABLE 203 GCC delivery robot market, by application, 2018 - 2022 (USD Million, Units)
- TABLE 204 GCC delivery robot market, by application, 2023 - 2032 (USD Million, Units)
- TABLE 205 GCC delivery robot market, by number of wheels, 2018 - 2022 (USD Million, Units)
- TABLE 206 GCC delivery robot market, by number of wheels, 2023 - 2032 (USD Million, Units)
- TABLE 207 South Africa delivery robot market, 2018 - 2022 (USD Million, Units)
- TABLE 208 South Africa delivery robot market, 2023 - 2032 (USD Million, Units)
- TABLE 209 South Africa delivery robot market, by solution, 2018 - 2022 (USD Million, Units)
- TABLE 210 South Africa delivery robot market, by solution, 2023 - 2032 (USD Million, Units)
- TABLE 211 South Africa delivery robot market, by application, 2018 - 2022 (USD Million, Units)
- TABLE 212 South Africa delivery robot market, by application, 2023 - 2032 (USD Million, Units)
- TABLE 213 South Africa delivery robot market, by number of wheels, 2018 - 2022 (USD Million, Units)
- TABLE 214 South Africa delivery robot market, by number of wheels, 2023 - 2032 (USD Million, Units)
Charts & Figures
- FIG. 1 GMI report coverage: Critical research elements
- FIG. 2 Industry segmentation
- FIG. 3 Profile break-up of primary respondents
- FIG. 4 Market forecasting methodology
- FIG. 5 Delivery robot industry 360 degree synopsis, 2022
- FIG. 6 Delivery robot industry ecosystem analysis
- FIG. 7 Global AI Investment, 2015-2021 (USD Billion)
- FIG. 8 Global 5G adoption, 2025 & 2021
- FIG. 9 Annual installation of industrial robots, 2018-2021 (Thousand Units)
- FIG. 10 Growth potential analysis
- FIG. 11 Porter's analysis
- FIG. 12 PESTEL analysis
- FIG. 13 Competitive analysis of major market players, 2022
- FIG. 14 Competitive positioning matrix
- FIG. 15 Strategic outlook matrix
- FIG. 16 Delivery robot market revenue, by solution, 2022 & 2032 (USD Million)
- FIG. 17 Delivery robot market revenue, by end-use, 2022 & 2032 (USD Million)
- FIG. 18 SWOT Analysis, Alibaba Group
- FIG. 19 SWOT Analysis, Alpha Asimov
- FIG. 20 SWOT Analysis, Boston Dynamics
- FIG. 21 SWOT Analysis, Eliport
- FIG. 22 SWOT Analysis, JD.com (Jingdong)
- FIG. 23 SWOT Analysis, Kiwibot
- FIG. 24 SWOT Analysis, Nuro
- FIG. 25 SWOT Analysis, Ottonomy Inc.
- FIG. 26 SWOT Analysis, Panasonic Corporation
- FIG. 27 SWOT Analysis, Piaggio & C. SpA
- FIG. 28 SWOT Analysis, Relay Robotics
- FIG. 29 SWOT Analysis, Richtech Robotics
- FIG. 30 SWOT Analysis, Starship Technologies
- FIG. 31 SWOT Analysis, ST Engineering
- FIG. 32 SWOT Analysis, Suzhou Pangolin Robot Corp (CSJBot)
Global Delivery Robot Market size is anticipated to expand significantly through 2032, owing to the growing use of delivery robots across college campuses. Many universities across the U.S. are increasingly using delivery robots to test their efficacy on college premises. In fact, the Ohio State University is one such institution that partnered with Cartken, a sidewalk delivery robot firm to test 50 fully automated delivery robots.
Citing another instance, in December 2022, Kiwibot, a last-mile delivery robot firm, inked a deal with Grubhub, a prominent food ordering marketplace, for the next-gen robot delivery in college premises. Escalating product innovations in the field are further positively influencing the industry landscape. For instance, in August 2022, Ottonomy, a prominent autonomous delivery robot manufacturer, announced the launch of the Ottobot 2.0, a second-generation delivery robot.
The overall delivery robot market is segmented based on component, number of wheels, end-use, and region.
Based on components, the delivery robot market size from the software segment is anticipated to attain sizeable gains through 2032. Increasing efforts by key robot manufacturers towards developing delivery robots with superior functionalities have increased the demand for software components. Moreover, many industry players, such as Starship Technologies, are also investing in testing programs for self-driving delivery robots, which is expected to boost segment growth.
3-wheel delivery robot industry size is slated to be worth over USD 500 million by 2032. High durability of these robots has increased their adoption for long-term use. These robots can move quickly in any direction, which helps optimize the delivery process. Additionally, they are highly efficient than their 2-wheel counterparts. The growing focus of key industry participants on launching state-of-the-art 3-wheel delivery robots will further positively contribute to segment expansion.
In terms of end-use, delivery robot market share from the retail segment is poised to grow considerably through 2032, owing to the growing focus of retail chains on enhancing last-mile delivery systems. Many retail giants such as Target and Walmart are investing in delivery robots to optimize their workflow efficiency. Delivery robots ensure a predictable delivery, which highly complements the retail space. They also allow faster last-mile delivery and enhance the productivity of retail stores by eliminating the manual errors associated with delivery.
On the regional front, Asia Pacific delivery robot industry value is expected to reach over USD 3 billion by 2032. Strong presence of industry players, such as the Alibaba Group, investing in product innovations, will contribute to the growth of the regional industry. Moreover, rapid urbanization in emerging economies such as China and Japan has increased the demand for delivery robots to cater to the growing demand in the e-commerce space.
Table of Contents
Chapter 1 Methodology and Scope
- 1.1 Market scope and definitions
- 1.2 Base estimates & calculations
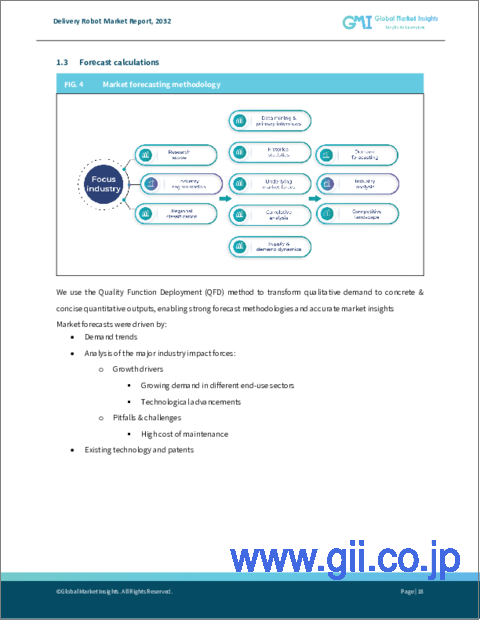
- 1.3 Forecast calculations
- 1.4 Data Sources
- 1.4.1 Primary
- 1.4.2 Data mining sources
- 1.4.2.1 Paid sources
- 1.4.2.2 Public sources
Chapter 2 Executive Summary
- 2.1 Delivery robot industry 360 degree synopsis, 2018 - 2032
- 2.2 Business trends
- 2.3 Regional trends
- 2.4 Component trends
- 2.5 Wheels trends
- 2.6 End-use trends
Chapter 3 Delivery Robot Industry Insights
- 3.1 Impact of COVID-19 outbreak
- 3.1.1 North America
- 3.1.2 Europe
- 3.1.3 Asia Pacific
- 3.1.4 LAMEA
- 3.2 Impacts of the Russia-Ukraine war
- 3.3 Delivery robot industry ecosystem analysis
- 3.3.1 Raw material suppliers
- 3.3.2 Manufacturers
- 3.3.3 Software & technology providers
- 3.3.4 Service providers
- 3.3.5 Distribution channel analysis
- 3.3.6 End users
- 3.3.7 Vendor matrix
- 3.4 Technology & Innovation landscape
- 3.4.1 5G and AI in robotics
- 3.4.2 Impact of IoT and Industry 4.0
- 3.4.3 Cloud robotics
- 3.4.4 Internet of Things (IoT)
- 3.4.5 Machine vision recognition
- 3.4.6 Robotic arms
- 3.5 Patent analysis
- 3.6 Key news & initiatives
- 3.7 Regulatory landscape
- 3.7.1 International standards
- 3.7.1.1 ISO 18646-2:2019: Robotics — Performance criteria and related test methods for service robots
- 3.7.1.2 ISO 13482
- 3.7.2 North America
- 3.7.2.1 Occupational Safety & Health Act (OSHA)
- 3.7.2.2 STD 01-12-002
- 3.7.2.3 UL 1740 [57] Robots and Robotic Equipment
- 3.7.3 Europe
- 3.7.3.1 RIA 15.06-2013
- 3.7.3.2 EU product safety framework for advanced robots & autonomous systems
- 3.7.3.3 Artificial Intelligence Act
- 3.7.4 Asia Pacific
- 3.7.4.1 Regulations on the protection of layout designs of integrated circuits
- 3.7.4.2 Intelligent Robots Development and Distribution Promotion Act: South Korea
- 3.7.5 South America
- 3.7.5.1 NR-12
- 3.7.5.2 Decree Law No. 5452
- 3.7.6 MEA
- 3.7.6.1 United Arab Emirates (GCC) Restriction of Hazardous Substances (RoHS) regulation
- 3.7.1 International standards
- 3.8 Industry impact forces
- 3.8.1 Growth drivers
- 3.8.1.1 Increasing use of delivery robots in the retail industry
- 3.8.1.2 Growth in the hospitality and healthcare industries
- 3.8.1.3 Increasing use of delivery robots in college campuses
- 3.8.1.4 Rising e-commerce and online food industries
- 3.8.1.5 Increasing government initiatives & investments in robot manufacturing companies
- 3.8.2 Industry pitfalls & challenges
- 3.8.2.1 High initial investments limiting the entry of new players in the market
- 3.8.1 Growth drivers
- 3.9 Growth potential analysis
- 3.10 Porter's analysis
- 3.11 PESTEL analysis
Chapter 4 Competitive Landscape, 2022
- 4.1 Introduction
- 4.2 Company market share, 2022
- 4.3 Major Market Players, 2022
- 4.3.1 JD.com
- 4.3.2 Alibaba Group (Cainiao Smart Logistics Network Limited)
- 4.3.3 Kiwibot
- 4.3.4 Nuro
- 4.3.5 Relay Robotics
- 4.3.6 ST Engineering
- 4.3.7 Starship Technologies
- 4.4 Competitive positioning matrix
- 4.5 Strategic outlook matrix
Chapter 5 Delivery Robot Market, By Solution
- 5.1 Key trends, by solution
- 5.2 Hardware
- 5.2.1 Market estimates and forecast, 2018 - 2032
- 5.3 Software
- 5.3.1 Market estimates and forecast, 2018 - 2032
Chapter 6 Delivery Robot Market, By End-Use
- 6.1 Key trends, by end-use
- 6.2 Food & beverage
- 6.2.1 Market estimates and forecast, 2018 - 2032
- 6.3 Retail
- 6.3.1 Market estimates and forecast, 2018 - 2032
- 6.4 Healthcare
- 6.4.1 Market estimates and forecast, 2018 - 2032
- 6.5 Postal service
- 6.5.1 Market estimates and forecast, 2018 - 2032
- 6.6 Others
- 6.6.1 Market estimates and forecast, 2018 - 2032
Chapter 7 Delivery Robot Market, By Number of Wheels
- 7.1 Key trends, by number of wheels
- 7.2 2-wheel robots
- 7.2.1 Market estimates and forecast, 2018 - 2032
- 7.3 3-wheel robots
- 7.3.1 Market estimates and forecast, 2018 - 2032
- 7.4 4-wheel robots
- 7.4.1 Market estimates and forecast, 2018 - 2032
- 7.5 6-wheel robots
- 7.5.1 Market estimates and forecast, 2018 - 2032
Chapter 8 Delivery Robot Market, By Region
- 8.1 Key trends, by region
- 8.2 North America
- 8.2.1 Market estimates and forecast, 2018 - 2032
- 8.2.2 Market estimates and forecast, by solution, 2018 - 2032
- 8.2.3 Market estimates and forecast, by number of wheels, 2018 - 2032
- 8.2.4 Market estimates and forecast, by end-use, 2018 - 2032
- 8.2.5 U.S.
- 8.2.5.1 Market estimates and forecast, 2018 - 2032
- 8.2.5.2 Market estimates and forecast, by solution, 2018 - 2032
- 8.2.5.3 Market estimates and forecast, by number of wheels, 2018 - 2032
- 8.2.5.4 Market estimates and forecast, by end-use, 2018 - 2032
- 8.2.6 Canada
- 8.2.6.1 Market estimates and forecast, 2018 - 2032
- 8.2.6.2 Market estimates and forecast, by solution, 2018 - 2032
- 8.2.6.3 Market estimates and forecast, by number of wheels, 2018 - 2032
- 8.2.6.4 Market estimates and forecast, by end-use, 2018 - 2032
- 8.3 Europe
- 8.3.1 Market estimates and forecast, 2018 - 2032
- 8.3.2 Market estimates and forecast, by solution, 2018 - 2032
- 8.3.3 Market estimates and forecast, by number of wheels, 2018 - 2032
- 8.3.4 Market estimates and forecast, by end-use, 2018 - 2032
- 8.3.5 UK
- 8.3.5.1 Market estimates and forecast, 2018 - 2032
- 8.3.5.2 Market estimates and forecast, by solution, 2018 - 2032
- 8.3.5.3 Market estimates and forecast, by number of wheels, 2018 - 2032
- 8.3.5.4 Market estimates and forecast, by end-use, 2018 - 2032
- 8.3.6 Germany
- 8.3.6.1 Market estimates and forecast, 2018 - 2032
- 8.3.6.2 Market estimates and forecast, by solution, 2018 - 2032
- 8.3.6.3 Market estimates and forecast, by number of wheels, 2018 - 2032
- 8.3.6.4 Market estimates and forecast, by end-use, 2018 - 2032
- 8.3.7 France
- 8.3.7.1 Market estimates and forecast, 2018 - 2032
- 8.3.7.2 Market estimates and forecast, by solution, 2018 - 2032
- 8.3.7.3 Market estimates and forecast, by number of wheels, 2018 - 2032
- 8.3.7.4 Market estimates and forecast, by end-use, 2018 - 2032
- 8.3.8 Italy
- 8.3.8.1 Market estimates and forecast, 2018 - 2032
- 8.3.8.2 Market estimates and forecast, by solution, 2018 - 2032
- 8.3.8.3 Market estimates and forecast, by number of wheels, 2018 - 2032
- 8.3.8.4 Market estimates and forecast, by end-use, 2018 - 2032
- 8.3.9 Spain
- 8.3.9.1 Market estimates and forecast, 2018 - 2032
- 8.3.9.2 Market estimates and forecast, by solution, 2018 - 2032
- 8.3.9.3 Market estimates and forecast, by number of wheels, 2018 - 2032
- 8.3.9.4 Market estimates and forecast, by end-use, 2018 - 2032
- 8.4 Asia Pacific
- 8.4.1 Market estimates and forecast, 2018 - 2032
- 8.4.2 Market estimates and forecast, by solution, 2018 - 2032
- 8.4.3 Market estimates and forecast, by number of wheels, 2018 - 2032
- 8.4.4 Market estimates and forecast, by end-use, 2018 - 2032
- 8.4.5 China
- 8.4.5.1 Market estimates and forecast, 2018 - 2032
- 8.4.5.2 Market estimates and forecast, by solution, 2018 - 2032
- 8.4.5.3 Market estimates and forecast, by number of wheels, 2018 - 2032
- 8.4.5.4 Market estimates and forecast, by end-use, 2018 - 2032
- 8.4.6 India
- 8.4.6.1 Market estimates and forecast, 2018 - 2032
- 8.4.6.2 Market estimates and forecast, by solution, 2018 - 2032
- 8.4.6.3 Market estimates and forecast, by number of wheels, 2018 - 2032
- 8.4.6.4 Market estimates and forecast, by end-use, 2018 - 2032
- 8.4.7 Japan
- 8.4.7.1 Market estimates and forecast, 2018 - 2032
- 8.4.7.2 Market estimates and forecast, by solution, 2018 - 2032
- 8.4.7.3 Market estimates and forecast, by number of wheels, 2018 - 2032
- 8.4.7.4 Market estimates and forecast, by end-use, 2018 - 2032
- 8.4.8 South Korea
- 8.4.8.1 Market estimates and forecast, 2018 - 2032
- 8.4.8.2 Market estimates and forecast, by solution, 2018 - 2032
- 8.4.8.3 Market estimates and forecast, by number of wheels, 2018 - 2032
- 8.4.8.4 Market estimates and forecast, by end-use, 2018 - 2032
- 8.4.9 Taiwan
- 8.4.9.1 Market estimates and forecast, 2018 - 2032
- 8.4.9.2 Market estimates and forecast, by solution, 2018 - 2032
- 8.4.9.3 Market estimates and forecast, by number of wheels, 2018 - 2032
- 8.4.9.4 Market estimates and forecast, by end-use, 2018 - 2032
- 8.5 LAMEA
- 8.5.1 Market estimates and forecast, 2018 - 2032
- 8.5.2 Market estimates and forecast, by solution, 2018 - 2032
- 8.5.3 Market estimates and forecast, by number of wheels, 2018 - 2032
- 8.5.4 Market estimates and forecast, by end-use, 2018 - 2032
- 8.5.5 Brazil
- 8.5.5.1 Market estimates and forecast, 2018 - 2032
- 8.5.5.2 Market estimates and forecast, by solution, 2018 - 2032
- 8.5.5.3 Market estimates and forecast, by number of wheels, 2018 - 2032
- 8.5.5.4 Market estimates and forecast, by end-use, 2018 - 2032
- 8.5.6 Mexico
- 8.5.6.1 Market estimates and forecast, 2018 - 2032
- 8.5.6.2 Market estimates and forecast, by solution, 2018 - 2032
- 8.5.6.3 Market estimates and forecast, by number of wheels, 2018 - 2032
- 8.5.6.4 Market estimates and forecast, by end-use, 2018 - 2032
- 8.5.7 GCC
- 8.5.7.1 Market estimates and forecast, 2018 - 2032
- 8.5.7.2 Market estimates and forecast, by solution, 2018 - 2032
- 8.5.7.3 Market estimates and forecast, by number of wheels, 2018 - 2032
- 8.5.7.4 Market estimates and forecast, by end-use, 2018 - 2032
- 8.5.8 South Africa
- 8.5.8.1 Market estimates and forecast, 2018 - 2032
- 8.5.8.2 Market estimates and forecast, by solution, 2018 - 2032
- 8.5.8.3 Market estimates and forecast, by number of wheels, 2018 - 2032
- 8.5.8.4 Market estimates and forecast, by end-use, 2018 - 2032
Chapter 9 Company Profiles
- 9.1 Alibaba Group
- 9.1.1 Business Overview
- 9.1.2 Financial Data
- 9.1.3 Product Landscape
- 9.1.4 Strategic Outlook
- 9.1.5 SWOT Analysis
- 9.2 Alpha Asimov
- 9.2.1 Business Overview
- 9.2.2 Financial Data
- 9.2.3 Product Landscape
- 9.2.4 SWOT Analysis
- 9.3 Boston Dynamics
- 9.3.1 Business Overview
- 9.3.2 Financial Data
- 9.3.3 Product Landscape
- 9.3.4 Strategic Outlook
- 9.3.5 SWOT Analysis
- 9.4 Eliport
- 9.4.1 Business Overview
- 9.4.2 Financial Data
- 9.4.3 Product Landscape
- 9.4.4 SWOT Analysis
- 9.5 JD.com (Jingdong)
- 9.5.1 Business Overview
- 9.5.2 Financial Data
- 9.5.3 Product Landscape
- 9.5.4 Strategic Outlook
- 9.5.5 SWOT Analysis
- 9.6 Kiwibot
- 9.6.1 Business Overview
- 9.6.2 Financial Data
- 9.6.3 Product Landscape
- 9.6.4 Strategic Outlook
- 9.6.5 SWOT Analysis
- 9.7 Nuro
- 9.7.1 Business Overview
- 9.7.2 Financial Data
- 9.7.3 Product Landscape
- 9.7.4 Strategic Outlook
- 9.7.5 SWOT Analysis
- 9.8 Ottonomy
- 9.8.1 Business Overview
- 9.8.2 Financial Data
- 9.8.3 Product Landscape
- 9.8.4 Strategic Outlook
- 9.8.5 SWOT Analysis
- 9.9 Panasonic Corporation
- 9.9.1 Business Overview
- 9.9.2 Financial Data
- 9.9.3 Product Landscape
- 9.9.4 Market Strategy
- 9.9.5 SWOT Analysis
- 9.10 Piaggio & C. SpA
- 9.10.1 Business Overview
- 9.10.2 Financial Data
- 9.10.3 Product Landscape
- 9.10.4 Market Strategy
- 9.10.5 SWOT Analysis
- 9.11 Relay Robotics
- 9.11.1 Business Overview
- 9.11.2 Financial Data
- 9.11.3 Product Landscape
- 9.11.4 Strategic Outlook
- 9.11.5 SWOT Analysis
- 9.12 Richtech Robotics
- 9.12.1 Business Overview
- 9.12.2 Financial Data
- 9.12.3 Product Landscape
- 9.12.4 SWOT Analysis
- 9.13 Starship Technologies
- 9.13.1 Business Overview
- 9.13.2 Financial Data
- 9.13.3 Product Landscape
- 9.13.4 Strategic Outlook
- 9.13.5 SWOT Analysis
- 9.14 ST Engineering
- 9.14.1 Business Overview
- 9.14.2 Financial Data
- 9.14.3 Product Landscape
- 9.14.4 Strategic Outlook
- 9.14.5 SWOT Analysis
- 9.15 Suzhou Pangolin Robot Corp (CSJBot)
- 9.15.1 Business Overview
- 9.15.2 Financial Data
- 9.15.3 Product Landscape
- 9.15.4 Strategic Outlook
- 9.15.5 SWOT Analysis