
|
市場調査レポート
商品コード
1666531
HVDCコンバータの市場機会、成長促進要因、産業動向分析、2025年~2034年予測HVDC Converter Market Opportunity, Growth Drivers, Industry Trend Analysis, and Forecast 2025 - 2034 |
||||||
カスタマイズ可能
|
|||||||
| HVDCコンバータの市場機会、成長促進要因、産業動向分析、2025年~2034年予測 |
|
出版日: 2024年12月13日
発行: Global Market Insights Inc.
ページ情報: 英文 120 Pages
納期: 2~3営業日
|

全表示
- 概要
- 目次
世界のHVDCコンバータ市場は、2024年に33億米ドルとなり、2025年から2034年までのCAGRは35.9%と、例外的な成長を遂げようとしています。
市場拡大の背景には、特に世界が再生可能エネルギーにトランスミッションする中で、より効率的な送電システムに対するニーズが高まっていることがあります。HVDC技術は、広大な距離を最小限の損失で送電できる点で際立っており、世界中の老朽化したエネルギーインフラを近代化する理想的なソリューションとなっています。風力発電や太陽光発電などの再生可能エネルギー統合への注目が高まるにつれ、既存の送電網には迅速な適応が求められています。そのため、送電の課題を克服する信頼性の高い手段を提供するHVDCコンバータの採用が拡大しています。再生可能エネルギープロジェクトへの投資、国境を越えた電力接続の推進、送電網インフラの継続的な進歩も、市場成長の主な要因となっています。
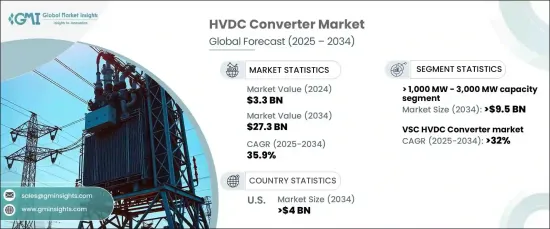
再生可能エネルギーの統合を優先する国が増えるにつれ、大容量HVDCシステムの必要性はかつてないほど高まっています。容量が1,000MWから3,000MWのシステムは、2034年までに95億米ドルを生み出すと予想されています。これらのシステムは、洋上風力発電所や太陽光発電設備などの大規模な再生可能エネルギープロジェクトに不可欠であり、長距離の効率的な送電を確保し、都市人口のエネルギー需要に対応します。また、国境を越えた電力取引をサポートし、再生可能エネルギー発電に依存する地域をつなぐという重要な役割も担っています。
| 市場範囲 | |
|---|---|
| 開始年 | 2024年 |
| 予測年 | 2025年~2034年 |
| 開始金額 | 33億米ドル |
| 予測金額 | 273億米ドル |
| CAGR | 35.9% |
特に、電圧源コンバータ(VSC)技術は、2034年までのCAGRが32%と、急速な普及が見込まれています。VSCは非常に汎用性が高く、再生可能エネルギーの統合を強化しながら複雑な送電網の電力フローを管理するのに理想的です。脆弱な系統や孤立した系統で効果的に動作し、多端子接続をサポートするVSCの能力は、オフショアと都市部の両方のエネルギーアプリケーションにとって魅力的な選択肢となっています。VSCは、従来の系統連系コンバータ(LCC)とは異なり、優れたグリッド制御と柔軟性を提供するため、最新の送電システムに最適な技術として位置づけられています。
米国のHVDCコンバータ市場は、2034年までに40億米ドルを生み出すと予想されています。この成長の原動力は、インフラの老朽化、クリーンエネルギーの推進、長距離HVDCトランスミッション・プロジェクトの需要増です。風力発電所や太陽光発電所などの再生可能エネルギー生産拠点と大都市圏を接続する必要性は、HVDCシステムの重要性の高まりを裏付けています。クリーンエネルギーを支援する米国連邦政府の政策や、再生可能エネルギーの統合を促進する規制の枠組みは、HVDC技術への投資を加速させています。その結果、米国ではVSCベースのHVDCシステムがますます好まれるようになっています。このシステムは、多様なエネルギー源をシームレスに統合する柔軟性を備え、同時に進化する送電網の需要にも対応できます。
目次
第1章 調査手法と調査範囲
- 市場範囲と定義
- 市場推計・予測パラメータ
- 予測計算
- データソース
- 一次
- 二次
- 有料
- 公的
第2章 エグゼクティブサマリー
第3章 業界洞察
- 業界エコシステム分析
- 規制状況
- 業界への影響要因
- 成長促進要因
- 業界の潜在的リスク・課題
- 成長ポテンシャル分析
- ポーター分析
- 供給企業の交渉力
- 買い手の交渉力
- 新規参入業者の脅威
- 代替品の脅威
- PESTEL分析
第4章 競合情勢
- イントロダクション
- 戦略的展望
- イノベーションと持続可能性の展望
第5章 市場規模・予測:容量別、2021年~2034年
- 主要動向
- 500 MW未満
- 500 MW以上~1,000 MW
- 1,000 MW~3,000 MW
- 3,000 MW以上
第6章 市場規模と予測:構成別、2021~2034年
- 主要動向
- モノポーラ
- バイポーラ
- BTB(Back to back)
- その他
第7章 市場規模・予測:コンバータ別、2021年~2034年
- 主要動向
- LCC
- VSC
- その他
第8章 市場規模・予測:地域別、2021年~2034年
- 主要動向
- 北米
- 米国
- カナダ
- 欧州
- 英国
- ドイツ
- フランス
- ノルウェー
- アジア太平洋
- 中国
- インド
- 韓国
- オーストラリア
- 世界のその他の地域
第9章 企業プロファイル
- ABB
- Bharat Heavy Electricals
- CG Power and Industrial Solutions
- General Electric
- Hitachi
- Hyosung Heavy Industries
- Power Grid Corporation of India
- Rongxin Power
- Siemens Energy
- Toshiba
The Global HVDC Converter Market, valued at USD 3.3 billion in 2024, is poised for exceptional growth, with a CAGR of 35.9% from 2025 to 2034. The market expansion is driven by a growing need for more efficient power transmission systems, especially as the world transitions to renewable energy sources. HVDC technology stands out for its ability to transmit electricity over vast distances with minimal loss, making it an ideal solution for modernizing aging energy infrastructures worldwide. The increasing focus on renewable energy integration, such as wind and solar power, is placing pressure on the existing grids to adapt quickly. As such, HVDC converters, which offer a reliable means of overcoming transmission challenges, are seeing significant adoption. Investment in renewable energy projects, the push for cross-border electricity connections, and ongoing advancements in grid infrastructure are also key factors contributing to the market growth.
As more countries prioritize renewable energy integration, the need for high-capacity HVDC systems has never been more urgent. Systems with capacities ranging from 1,000 MW to 3,000 MW are expected to generate USD 9.5 billion by 2034. These systems are vital for large-scale renewable energy projects, such as offshore wind farms and solar power installations, ensuring efficient power transmission over long distances and addressing the energy demands of urban populations. They also play a crucial role in supporting cross-border electricity trade, connecting regions that rely on renewable energy generation.
| Market Scope | |
|---|---|
| Start Year | 2024 |
| Forecast Year | 2025-2034 |
| Start Value | $3.3 Billion |
| Forecast Value | $27.3 Billion |
| CAGR | 35.9% |
In particular, the voltage source converter (VSC) technology is anticipated to see a rapid increase in adoption, with a CAGR of 32% through 2034. VSCs are highly versatile and ideal for managing power flow in complex grids while enhancing renewable energy integration. Their ability to operate effectively in weak or isolated grids and support multi-terminal connections makes them an attractive option for both offshore and urban energy applications. Unlike traditional line-commutated converters (LCC), VSCs provide superior grid control and flexibility, positioning them as the technology of choice for modern power transmission systems.
The U.S. HVDC converter market is expected to generate USD 4 billion by 2034. This growth is driven by a combination of aging infrastructure, the push for cleaner energy, and an increased demand for long-distance HVDC transmission projects. The need to connect renewable energy production centers, such as wind and solar farms, with major urban areas underscores the growing relevance of HVDC systems. U.S. federal policies supporting clean energy and regulatory frameworks aimed at facilitating renewable energy integration are accelerating investments in HVDC technology. As a result, the U.S. is seeing an increasing preference for VSC-based HVDC systems, which offer the flexibility to seamlessly integrate diverse energy sources while meeting evolving grid demands.
Table of Contents
Chapter 1 Methodology & Scope
- 1.1 Market scope & definitions
- 1.2 Market estimates & forecast parameters
- 1.3 Forecast calculation
- 1.4 Data sources
- 1.4.1 Primary
- 1.4.2 Secondary
- 1.4.2.1 Paid
- 1.4.2.2 Public
Chapter 2 Executive Summary
- 2.1 Industry synopsis, 2021 - 2034
Chapter 3 Industry Insights
- 3.1 Industry ecosystem analysis
- 3.2 Regulatory landscape
- 3.3 Industry impact forces
- 3.3.1 Growth drivers
- 3.3.2 Industry pitfalls & challenges
- 3.4 Growth potential analysis
- 3.5 Porter's analysis
- 3.5.1 Bargaining power of suppliers
- 3.5.2 Bargaining power of buyers
- 3.5.3 Threat of new entrants
- 3.5.4 Threat of substitutes
- 3.6 PESTEL analysis
Chapter 4 Competitive Landscape, 2024
- 4.1 Introduction
- 4.2 Strategic outlook
- 4.3 Innovation & sustainability landscape
Chapter 5 Market Size and Forecast, By Capacity, 2021 – 2034 (MW, USD Billion)
- 5.1 Key trends
- 5.2 < 500 MW
- 5.3 ≥ 500 MW - 1,000 MW
- 5.4 > 1,000 MW - 3,000 MW
- 5.5 > 3,000 MW
Chapter 6 Market Size and Forecast, By Configuration, 2021 – 2034 (MW, USD Billion)
- 6.1 Key trends
- 6.2 Monopolar
- 6.3 Bipolar
- 6.4 Back to back
- 6.5 Others
Chapter 7 Market Size and Forecast, By Converter, 2021 – 2034 (MW, USD Billion)
- 7.1 Key trends
- 7.2 LCC
- 7.3 VSC
- 7.4 Others
Chapter 8 Market Size and Forecast, By Region, 2021 – 2034 (MW, USD Billion)
- 8.1 Key trends
- 8.2 North America
- 8.2.1 U.S.
- 8.2.2 Canada
- 8.3 Europe
- 8.3.1 UK
- 8.3.2 Germany
- 8.3.3 France
- 8.3.4 Norway
- 8.4 Asia Pacific
- 8.4.1 China
- 8.4.2 India
- 8.4.3 South Korea
- 8.4.4 Australia
- 8.5 Rest of World
Chapter 9 Company Profiles
- 9.1 ABB
- 9.2 Bharat Heavy Electricals
- 9.3 CG Power and Industrial Solutions
- 9.4 General Electric
- 9.5 Hitachi
- 9.6 Hyosung Heavy Industries
- 9.7 Power Grid Corporation of India
- 9.8 Rongxin Power
- 9.9 Siemens Energy
- 9.10 Toshiba

