
|
市場調査レポート
商品コード
1667140
薄膜電池市場の機会、成長促進要因、産業動向分析、2025~2034年の予測Thin Film Battery Market Opportunity, Growth Drivers, Industry Trend Analysis, and Forecast 2025 - 2034 |
||||||
カスタマイズ可能
|
|||||||
| 薄膜電池市場の機会、成長促進要因、産業動向分析、2025~2034年の予測 |
|
出版日: 2024年12月10日
発行: Global Market Insights Inc.
ページ情報: 英文 80 Pages
納期: 2~3営業日
|

全表示
- 概要
- 目次
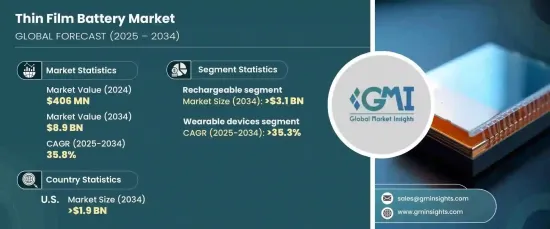
薄膜電池の世界市場は2024年に4億600万米ドルに達し、2025年から2034年にかけて35.8%のCAGRで堅調に成長すると予測されています。
急速な技術進歩が業界を再形成しており、メーカーはエネルギー効率、密度、費用対効果の向上に注力しています。
薄膜電池は軽量で柔軟な設計のため、さまざまな機器にシームレスに組み込むことができ、人気を集めています。ソリッドステートやフレキシブルバッテリー技術などの革新がその採用を後押しし、多様なアプリケーションに新たな可能性をもたらしています。これらの進歩は、高性能でコンパクトなエネルギー・ソリューションを求める分野での薄膜電池の可能性を広げています。
| 市場範囲 | |
|---|---|
| 開始年 | 2024 |
| 予測年 | 2025-2034 |
| 開始金額 | 4億600万米ドル |
| 予測金額 | 89億米ドル |
| CAGR | 35.8% |
ウェアラブル機器やIoT機器における効率的な電源に対する需要の高まりが、市場成長の主な要因となっています。これらのアプリケーションでは、独自のフォームファクターを持つデバイスに電力を供給できるコンパクトで耐久性のある電池が必要とされます。薄膜電池はこのような要件に適しており、次世代デバイスに不可欠な高いエネルギー密度と柔軟性を提供します。コネクテッド・テクノロジーの普及が進むにつれて、革新的なエネルギー・ソリューションに対する需要が高まり、市場の拡大をさらに後押ししています。
市場の製品セグメンテーションでは、二次電池の大きな成長機会が強調されています。2034年までに31億米ドルを超えると予想されるこのセグメントは、軽量、効率的、長寿命のパワー・ソリューションに対するニーズの高まりから利益を得ています。充電式薄膜電池は、現代の電子機器特有のニーズに応える設計と材料の進歩により、その優れた性能でますます支持されています。
アプリケーションの面では、薄膜電池はウェアラブル、医療機器、スマートカード、消費者製品などの分野で急速な採用が進んでいます。ウェアラブル分野は、エネルギー効率が高く適応性の高い電源への嗜好の高まりに後押しされ、2034年までのCAGRは35.3%を超えると予想されています。これらの電池は、コンパクトで軽量な機器の要件に合致しており、急速に進化する市場で不可欠なものとなっています。
米国の薄膜電池市場は、2034年までに19億米ドルを超えると予測されています。この地域の成長は、コンシューマーエレクトロニクス、ヘルスケア、産業用アプリケーションでの採用が増加していることに起因しています。技術革新は、特にコンパクトで効率的かつ柔軟なエネルギーソリューションを必要とする機器において、これらの電池の魅力を高めています。IoTと先端エレクトロニクスの採用が増加していることが、市場開発をさらに加速しています。
目次
第1章 調査手法と調査範囲
- 市場の定義
- 基本推定と計算
- 予測計算
- データソース
- 1次データ
- 2次データ
- 有償
- 公的
第2章 エグゼクティブサマリー
第3章 業界洞察
- エコシステム分析
- 規制状況
- 業界への影響要因
- 促進要因
- 業界の潜在的リスク&課題
- 成長可能性分析
- ポーターの分析
- 供給企業の交渉力
- 買い手の交渉力
- 新規参入業者の脅威
- 代替品の脅威
- PESTEL分析
第4章 競合情勢
- 戦略ダッシュボード
- イノベーションと持続可能性の展望
第5章 市場規模・予測:製品別、2021年~2034年
- 主要動向
- 充電式
- 非充電式
第6章 市場規模・予測:用途別、2021年~2034年
- 主要動向
- ウェアラブル機器
- 医療用
- スマートカード
- 消費者向け製品
- その他
第7章 市場規模・予測:地域別、2021年~2034年
- 主要動向
- 北米
- 米国
- カナダ
- メキシコ
- 欧州
- ドイツ
- 英国
- フランス
- イタリア
- スペイン
- オーストリア
- スウェーデン
- アジア太平洋
- 中国
- 日本
- 韓国
- インド
- オーストラリア
- 世界のその他の地域
- ブラジル
- UAE
- サウジアラビア
第8章 企業プロファイル
- BrightVolt
- Cymbet
- Enfucell
- Ilika
- Imprint Energy
- Ion Storage Systems
- ITEN
- Jenax
- Johnson Energy Storage
- Molex
- Prieto Battery
- STMicroelectronics
The Global Thin Film Battery Market reached USD 406 million in 2024 and is projected to grow at a robust CAGR of 35.8% from 2025 to 2034. Rapid technological advancements are reshaping the industry, with manufacturers focusing on enhancing energy efficiency, density, and cost-effectiveness.
Thin film batteries are gaining popularity due to their lightweight and flexible design, which allows seamless integration into a variety of devices. Innovations such as solid-state and flexible battery technologies are driving their adoption, opening new possibilities across diverse applications. These advancements are expanding the potential of thin film batteries in sectors that demand high-performance and compact energy solutions.
| Market Scope | |
|---|---|
| Start Year | 2024 |
| Forecast Year | 2025-2034 |
| Start Value | $406 Million |
| Forecast Value | $8.9 Billion |
| CAGR | 35.8% |
The increasing demand for efficient power sources in wearables and IoT devices is a key driver of market growth. These applications require compact and durable batteries capable of powering devices with unique form factors. Thin film batteries are well-suited for such requirements, offering high energy density and flexibility, which are essential for next-generation devices. As connected technologies continue to proliferate, the demand for innovative energy solutions is rising, further fueling the expansion of the market.
The product segmentation of the market highlights significant growth opportunities for rechargeable batteries. Expected to exceed USD 3.1 billion by 2034, this segment benefits from the rising need for lightweight, efficient, and long-lasting power solutions. Rechargeable thin film batteries are increasingly favored for their superior performance, driven by advancements in design and materials that cater to the specific needs of modern electronics.
In terms of application, thin film batteries are witnessing rapid adoption in sectors such as wearables, medical devices, smart cards, and consumer products. The wearable segment is expected to register a CAGR of over 35.3% through 2034, fueled by the growing preference for energy-efficient and adaptable power sources. These batteries align with the requirements of compact and lightweight devices, making them indispensable in rapidly evolving markets.
The U.S. thin film battery market is forecasted to surpass USD 1.9 billion by 2034. Growth in this region is attributed to increasing adoption across consumer electronics, healthcare, and industrial applications. Technological innovations are enhancing the appeal of these batteries, particularly in devices that require compact, efficient, and flexible energy solutions. The rising adoption of IoT and advanced electronics is further accelerating market development.
Table of Contents
Chapter 1 Methodology & Scope
- 1.1 Market definition
- 1.2 Base estimates & calculations
- 1.3 Forecast calculation
- 1.4 Data sources
- 1.4.1 Primary
- 1.4.2 Secondary
- 1.4.2.1 Paid
- 1.4.2.2 Public
Chapter 2 Executive Summary
- 2.1 Industry synopsis, 2021 – 2034
Chapter 3 Industry Insights
- 3.1 Industry ecosystem analysis
- 3.2 Regulatory landscape
- 3.3 Industry impact forces
- 3.3.1 Growth drivers
- 3.3.2 Industry pitfalls & challenges
- 3.4 Growth potential analysis
- 3.5 Porter's analysis
- 3.5.1 Bargaining power of suppliers
- 3.5.2 Bargaining power of buyers
- 3.5.3 Threat of new entrants
- 3.5.4 Threat of substitutes
- 3.6 PESTEL analysis
Chapter 4 Competitive landscape, 2024
- 4.1 Strategic dashboard
- 4.2 Innovation & sustainability landscape
Chapter 5 Market Size and Forecast, By Product, 2021 – 2034 (USD Million)
- 5.1 Key trends
- 5.2 Rechargeable
- 5.3 Non-rechargeable
Chapter 6 Market Size and Forecast, By Application, 2021 – 2034 (USD Million)
- 6.1 Key trends
- 6.2 Wearable devices
- 6.3 Medical
- 6.4 Smart cards
- 6.5 Consumer products
- 6.6 Others
Chapter 7 Market Size and Forecast, By Region, 2021 – 2034 (USD Million)
- 7.1 Key trends
- 7.2 North America
- 7.2.1 U.S.
- 7.2.2 Canada
- 7.2.3 Mexico
- 7.3 Europe
- 7.3.1 Germany
- 7.3.2 UK
- 7.3.3 France
- 7.3.4 Italy
- 7.3.5 Spain
- 7.3.6 Austria
- 7.3.7 Sweden
- 7.4 Asia Pacific
- 7.4.1 China
- 7.4.2 Japan
- 7.4.3 South Korea
- 7.4.4 India
- 7.4.5 Australia
- 7.5 Rest of World
- 7.5.1 Brazil
- 7.5.2 UAE
- 7.5.3 Saudi Arabia
Chapter 8 Company Profiles
- 8.1 BrightVolt
- 8.2 Cymbet
- 8.3 Enfucell
- 8.4 Ilika
- 8.5 Imprint Energy
- 8.6 Ion Storage Systems
- 8.7 ITEN
- 8.8 Jenax
- 8.9 Johnson Energy Storage
- 8.10 Molex
- 8.11 Prieto Battery
- 8.12 STMicroelectronics

