|
|
市場調査レポート
商品コード
1611608
薄膜電池の市場規模、シェア、動向分析レポート:電圧別、電池タイプ別、用途別、セグメント予測、2025年~2030年Thin Film Battery Market Size, Share & Trends Analysis Report By Voltage (Below 1.5V, Above 3V), By Battery Type (Disposable, Rechargeable), By Application (Medical, Smart Cards, Wearables), And Segment Forecasts, 2025 - 2030 |
||||||

|
|||||||
カスタマイズ可能
|
|||||||

| 薄膜電池の市場規模、シェア、動向分析レポート:電圧別、電池タイプ別、用途別、セグメント予測、2025年~2030年 |
|
出版日: 2024年11月05日
発行: Grand View Research
ページ情報: 英文 100 Pages
納期: 2~10営業日
|

全表示
- 概要
- 図表
- 目次
薄膜電池市場の成長と動向
薄膜電池の世界市場規模は2030年に29億3,000万米ドルに達し、2025~2030年にかけてCAGR 10.9%で成長すると予測されます。
医療用トラッキングやスマートウォッチなどのアプリケーションからの需要拡大が、市場成長を後押しする可能性が高いです。薄膜電池は小型・軽量であるため需要が高いです。さらに、有害な化学品を含まず、爆発や火災にも強いです。さらに、小さなフォームファクターのデバイスに電力を供給する製品需要の高まりは、医療とウェアラブル用途における市場成長の主要促進要因です。
そのため、同市場の主要参入企業は技術の進歩に注力し、サービスの質と効率を高めています。顧客が技術に詳しくなっていることから、このような電子機器に対する需要は予測される数年間で増加すると予想されます。フィットネスバンドやスマートウォッチなどのデバイスの利用が増加しているため、薄膜電池の需要と供給がさらに適正化しています。これらの要因は、予測期間における市場の成長を後押しすると予想されます。
薄膜電池市場レポートハイライト
- 二次電池は、スマートウォッチのようなウェアラブル機器での使用により、予測期間中に最も急成長するセグメントとして浮上すると予測されます。
- 電圧1.5V以下セグメントが市場を独占し、2024年には45.1%の最大売上シェアを占めました。これは、医療用パッチ、マイクロセンサー、玩具などの低電力アプリケーションで1.5V電池の使用率が高いためです。
- ウェアラブルは、先進国だけでなく発展途上国でもこれらのデバイスの需要が増加しているため、2024年に最大のアプリケーションセグメントとなりました。
- 北米は2024年に世界市場をリードし、最も高い収益シェアを占めました。この成長は、さまざまな最終用途セグメントからのスマートカード需要の増加と医療用途への薄膜電池の採用増加によるものです。
- アジア太平洋の薄膜電池市場は、インド、中国、日本、オーストラリアなどの国々における大規模な消費者基盤に加え、同地域におけるウェアラブルデバイスの需要増加により、2025~2030年にかけてCAGR 13.7%で成長する見込みです。
目次
第1章 調査手法と範囲
第2章 エグゼクティブサマリー
第3章 薄膜電池市場の変数、動向、範囲
- 世界の薄膜電池市場の展望
- 産業バリューチェーン分析
- 電圧概要
- 平均価格動向分析
- 需給ギャップ分析、2024年
- 規制の枠組み
- 施策とインセンティブプラン
- 標準とコンプライアンス
- 規制影響分析
- 市場力学
- 市場促進要因分析
- 市場抑制要因分析
- 産業の課題
- ポーターのファイブフォース分析
- サプライヤーの力
- 買い手の力
- 代替の脅威
- 新規参入からの脅威
- 競争企業間の敵対関係
- PESTEL分析
- 政治情勢
- 経済情勢
- 社会情勢
- 技術情勢
- 環境情勢
- 法的情勢
第4章 薄膜電池市場: 電池タイプの展望の推定と予測
- 薄膜電池市場:電池タイプの変動分析、2024年と2030年
- 使い捨て式
- 充電式
第5章 薄膜電池市場: 電圧展望の推定と予測
- 薄膜電池市場:電圧変動分析、2024年と2030年
- 1.5V以下
- 1.5~3V
- 3V以上
第6章 薄膜電池市場:用途展望の推定と予測
- 薄膜電池市場:用途変動分析、2024年と2030年
- ウェアラブル
- 医療
- 民生用電子機器
- スマートカード
- その他
第7章 薄膜電池市場の地域別展望の推定と予測
- 地域スナップショット
- 薄膜電池市場:地域変動分析、2024年と2030年
- 北米
- 市場推定・予測、2018~2030年
- 電池タイプ別、2018~2030年
- 電圧別、2018~2030年
- 用途別、2018~2030年
- 米国
- 欧州
- 市場推定・予測、2018~2030年
- 電池タイプ別、2018~2030年
- 電圧別、2018~2030年
- 用途別、2018~2030年
- 英国
- ドイツ
- フランス
- アジア太平洋
- 市場推定・予測、2018~2030年
- 電池タイプ別、2018~2030年
- 電圧別、2018~2030年
- 用途別、2018~2030年
- 中国
- インド
- 日本
- 韓国
- ラテンアメリカ
- 市場推定・予測、2018~2030年
- 電池タイプ別、2018~2030年
- 電圧別、2018~2030年
- 用途別、2018~2030年
- 中東・アフリカ
- 市場推定・予測、2018~2030年
- 電池タイプ別、2018~2030年
- 電圧別、2018~2030年
- 用途別、2018~2030年
第8章 競合情勢
- 主要市場参入企業による最近の動向と影響分析
- ベンダー情勢
- 企業分類
- 主要ディストリビューターおよびチャネルパートナー一覧
- 潜在顧客/エンドユーザー一覧
- 競争の力学
- 競合ベンチマーキング
- 戦略マッピング
- ヒートマップ分析
- 企業プロファイル/上場企業
- Blue Spark Technologies
- BrightVolt.
- Enfucell
- STMicroelectronics
- LG Chem
- LionVolt
- SAMSUNG SDI Co. Ltd.
- Ilika Plc.
- BTRY AG
- NGK Insulators, Ltd.
- The Kurt J. Lesker Company
- Ultralife Corporation
List of Tables
- Table 1 List Of Abbreviations
- Table 2 Thin Film Battery Market Estimates And Forecasts, By Battery Type, 2018 - 2030 (USD Million)
- Table 3 Thin Film Battery Market Estimates And Forecasts, By Voltage, 2018 - 2030 (USD Million)
- Table 4 Thin Film Battery Market Estimates And Forecasts, By Application, 2018 - 2030 (USD Million)
- Table 5 Thin Film Battery Market Estimates And Forecasts, By Region, 2018 - 2030 (USD Million)
- Table 6 North America Thin Film Battery Market Estimates And Forecasts, By Country, 2018 - 2030 (USD Million)
- Table 7 North America Thin Film Battery Market Estimates And Forecasts, By Battery Type, 2018 - 2030 (USD Million)
- Table 8 North America Thin Film Battery Market Estimates And Forecasts, By Voltage, 2018 - 2030 (USD Million)
- Table 9 North America Thin Film Battery Market Estimates And Forecasts, By Application, 2018 - 2030 (USD Million)
- Table 10 U.S. Thin Film Battery Market Estimates And Forecasts, By Battery Type, 2018 - 2030 (USD Million)
- Table 11 U.S. Thin Film Battery Market Estimates And Forecasts, By Voltage, 2018 - 2030 (USD Million)
- Table 12 U.S. Thin Film Battery Market Estimates And Forecasts, By Application, 2018 - 2030 (USD Million)
- Table 13 Europe Thin Film Battery Market Estimates And Forecasts, By Country, 2018 - 2030 (USD Million)
- Table 14 Europe Thin Film Battery Market Estimates And Forecasts, By Battery Type, 2018 - 2030 (USD Million)
- Table 15 Europe Thin Film Battery Market Estimates And Forecasts, By Voltage, 2018 - 2030 (USD Million)
- Table 16 Europe Thin Film Battery Market Estimates And Forecasts, By Application, 2018 - 2030 (USD Million)
- Table 17 UK Thin Film Battery Market Estimates And Forecasts, By Battery Type, 2018 - 2030 (USD Million)
- Table 18 UK Thin Film Battery Market Estimates And Forecasts, By Voltage, 2018 - 2030 (USD Million)
- Table 19 UK Thin Film Battery Market Estimates And Forecasts, By Application, 2018 - 2030 (USD Million)
- Table 20 Germany Thin Film Battery Market Estimates And Forecasts, By Battery Type, 2018 - 2030 (USD Million)
- Table 21 Germany Thin Film Battery Market Estimates And Forecasts, By Voltage, 2018 - 2030 (USD Million)
- Table 22 Germany Thin Film Battery Market Estimates And Forecasts, By Application, 2018 - 2030 (USD Million)
- Table 23 France Thin Film Battery Market Estimates And Forecasts, By Battery Type, 2018 - 2030 (USD Million)
- Table 24 France Thin Film Battery Market Estimates And Forecasts, By Voltage, 2018 - 2030 (USD Million)
- Table 25 France Thin Film Battery Market Estimates And Forecasts, By Application, 2018 - 2030 (USD Million)
- Table 26 Asia Pacific Thin Film Battery Market Estimates And Forecasts, By Country, 2018 - 2030 (USD Million)
- Table 27 Asia Pacific Thin Film Battery Market Estimates And Forecasts, By Battery Type, 2018 - 2030 (USD Million)
- Table 28 Asia Pacific Thin Film Battery Market Estimates And Forecasts, By Voltage, 2018 - 2030 (USD Million)
- Table 29 Asia Pacific Thin Film Battery Market Estimates And Forecasts, By Application, 2018 - 2030 (USD Million)
- Table 30 China Thin Film Battery Market Estimates And Forecasts, By Battery Type, 2018 - 2030 (USD Million)
- Table 31 China Thin Film Battery Market Estimates And Forecasts, By Voltage, 2018 - 2030 (USD Million)
- Table 32 China Thin Film Battery Market Estimates And Forecasts, By Application, 2018 - 2030 (USD Million)
- Table 33 India Thin Film Battery Market Estimates And Forecasts, By Battery Type, 2018 - 2030 (USD Million)
- Table 34 India Thin Film Battery Market Estimates And Forecasts, By Voltage, 2018 - 2030 (USD Million)
- Table 35 India Thin Film Battery Market Estimates And Forecasts, By Application, 2018 - 2030 (USD Million)
- Table 36 Japan Thin Film Battery Market Estimates And Forecasts, By Battery Type, 2018 - 2030 (USD Million)
- Table 37 Japan Thin Film Battery Market Estimates And Forecasts, By Voltage, 2018 - 2030 (USD Million)
- Table 38 Japan Thin Film Battery Market Estimates And Forecasts, By Application, 2018 - 2030 (USD Million)
- Table 39 South Korea Thin Film Battery Market Estimates And Forecasts, By Battery Type, 2018 - 2030 (USD Million)
- Table 40 South Korea Thin Film Battery Market Estimates And Forecasts, By Voltage, 2018 - 2030 (USD Million)
- Table 41 South Korea Thin Film Battery Market Estimates And Forecasts, By Application, 2018 - 2030 (USD Million)
- Table 42 Latin America Thin Film Battery Market Estimates And Forecasts, By Country, 2018 - 2030 (USD Million)
- Table 43 Latin America Thin Film Battery Market Estimates And Forecasts, By Battery Type, 2018 - 2030 (USD Million)
- Table 44 Latin America Thin Film Battery Market Estimates And Forecasts, By Voltage, 2018 - 2030 (USD Million)
- Table 45 Latin America Thin Film Battery Market Estimates And Forecasts, By Application, 2018 - 2030 (USD Million)
- Table 46 Middle East & Africa Thin Film Battery Market Estimates And Forecasts, By Battery Type, 2018 - 2030 (USD Million)
- Table 47 Middle East & Africa Thin Film Battery Market Estimates And Forecasts, By Country, 2018 - 2030 (USD Million)
- Table 48 Middle East & Africa Thin Film Battery Market Estimates And Forecasts, By Voltage, 2018 - 2030 (USD Million)
- Table 49 Middle East & Africa Thin Film Battery Market Estimates And Forecasts, By Application, 2018 - 2030 (USD Million)
List of Figures
- Fig. 1 Market Segmentation
- Fig. 2 Information Procurement
- Fig. 3 Data Analysis Models
- Fig. 4 Market Formulation and Validation
- Fig. 5 Market Snapshot
- Fig. 6 Segmental Outlook- Battery Type, Voltage, Application, and Region
- Fig. 7 Competitive Outlook
- Fig. 8 Value Chain Analysis
- Fig. 9 Market Dynamics
- Fig. 10 Porter's Analysis
- Fig. 11 PESTEL analysis
- Fig. 12 Thin Film Battery Market, By Battery Type: Key Takeaways
- Fig. 13 Thin Film Battery Market, By Battery Type: Market Share, 2024 & 2030
- Fig. 14 Thin Film Battery Market, By Voltage: Key Takeaways
- Fig. 15 Thin Film Battery Market, By Voltage: Market Share, 2024 & 2030
- Fig. 16 Thin Film Battery Market, By Application: Key Takeaways
- Fig. 17 Thin Film Battery Market, By Application: Market Share, 2024 & 2030
- Fig. 18 Thin Film Battery Market, By Region: Key Takeaways
- Fig. 19 Thin Film Battery Market, By Region: Market Share, 2024 & 2030
Thin Film Battery Market Growth & Trends:
The global thin film battery market size is expected to reach USD 2.93 billion in 2030 and is projected to grow at a CAGR of 10.9% from 2025 to 2030. Growing demand from applications, such as medical tracking and smartwatches, is likely to boost the market growth. Thin-film battery has high demand owing to its small size and low weight. Moreover, it does not contain harmful chemicals and is resistant to explosion and fire. Furthermore, growing product demand to provide power for small form-factor devices is a major driving factor for the market growth in the medical and wearables applications.
Therefore, key players in the market are focusing on technological advancements and to increase service quality and efficiency. With customers being more tech-savvy, the demand for such electronic devices is expected to increase over the forecast years. Increasing usage of devices, such as fitness bands and smartwatches, is making the demand and supply for thin-film batteries even more proper. These factors are expected to boost the growth of the market in the forecast period.
Thin Film Battery Market Report Highlight:
- Rechargeable batteries is estimated to emerge as the fastest-growing segment over the forecast period owing to the use of these products in wearable devices like smartwatches
- Below 1.5 V voltage segment dominated the market and accounted for the largest revenue share of 45.1% in 2024. owing to high usage of 1.5V batteries in low-power applications like medical patches, micro-sensors, and toys
- Wearables was the largest application segment in 2024 owing to increased demand for these devices in developed as well as in developing countries
- North America led the global market in 2024 accounting for the highest revenue share. This growth was attributed to increased demand for smart cards from various end-use segments coupled with increased adoption of thin-film batteries for medical application
- The thin film battery market in Asia Pacific is expected to grow at a CAGR of 13.7% from 2025 to 2030 owing to a large consumer base in countries, such as India, China, Japan, and Australia, coupled with a rise in demand for wearable devices in the region
Table of Contents
Chapter 1. Methodology and Scope
- 1.1. Market Segmentation & Scope
- 1.2. Market Definition
- 1.3. Information Procurement
- 1.3.1. Purchased Database
- 1.3.2. GVR's Internal Database
- 1.3.3. Secondary Sources & Third-Party Perspectives
- 1.3.4. Primary Research
- 1.4. Information Analysis
- 1.4.1. Data Analysis Models
- 1.5. Market Formulation & Data Visualization
- 1.6. Data Validation & Publishing
Chapter 2. Executive Summary
- 2.1. Market Insights
- 2.2. Segmental Outlook
- 2.3. Competitive Outlook
Chapter 3. Thin Film Battery Market Variables, Trends & Scope
- 3.1. Global Thin Film Battery Market Outlook
- 3.2. Industry Value Chain Analysis
- 3.3. Voltage Overview
- 3.4. Average Price Trend Analysis
- 3.5. Supply-Demand Gap Analysis, 2024
- 3.6. Regulatory Framework
- 3.6.1. Policies and Incentive Plans
- 3.6.2. Standards and Compliances
- 3.6.3. Regulatory Impact Analysis
- 3.7. Market Dynamics
- 3.7.1. Market Driver Analysis
- 3.7.2. Market Restraint Analysis
- 3.7.3. Industry Challenges
- 3.8. Porter's Five Forces Analysis
- 3.8.1. Supplier Power
- 3.8.2. Buyer Power
- 3.8.3. Substitution Threat
- 3.8.4. Threat From New Entrant
- 3.8.5. Competitive Rivalry
- 3.9. PESTEL Analysis
- 3.9.1. Political Landscape
- 3.9.2. Economic Landscape
- 3.9.3. Social Landscape
- 3.9.4. Technological Landscape
- 3.9.5. Environmental Landscape
- 3.9.6. Legal Landscape
Chapter 4. Thin Film Battery Market: Battery Type Outlook Estimates & Forecasts
- 4.1. Thin Film Battery Market: Battery Type Movement Analysis, 2024 & 2030
- 4.1.1. Disposable
- 4.1.1.1. Market Estimates and Forecast, 2018 - 2030 (USD Million)
- 4.1.2. Rechargeable
- 4.1.2.1. Market Estimates and Forecast, 2018 - 2030 (USD Million)
- 4.1.1. Disposable
Chapter 5. Thin Film Battery Market: Voltage Outlook Estimates & Forecasts
- 5.1. Thin Film Battery Market: Voltage Movement Analysis, 2024 & 2030
- 5.1.1. Below 1.5 V
- 5.1.1.1. Market Estimates and Forecast, 2018 - 2030 (USD Million)
- 5.1.2. 1.5 V to 3V
- 5.1.2.1. Market Estimates and Forecast, 2018 - 2030 (USD Million)
- 5.1.3. Above 3 V
- 5.1.3.1. Market Estimates and Forecast, 2018 - 2030 (USD Million)
- 5.1.1. Below 1.5 V
Chapter 6. Thin Film Battery Market: Application Outlook Estimates & Forecasts
- 6.1. Thin Film Battery Market: Application Movement Analysis, 2024 & 2030
- 6.1.1. Wearables
- 6.1.1.1. Market Estimates and Forecast, 2018 - 2030 (USD Million)
- 6.1.2. Medical
- 6.1.2.1. Market Estimates and Forecast, 2018 - 2030 (USD Million)
- 6.1.3. Consumer Electronics
- 6.1.3.1. Market Estimates and Forecast, 2018 - 2030 (USD Million)
- 6.1.4. Smart Cards
- 6.1.4.1. Market Estimates and Forecast, 2018 - 2030 (USD Million)
- 6.1.5. Others
- 6.1.5.1. Market Estimates and Forecast, 2018 - 2030 (USD Million)
- 6.1.1. Wearables
Chapter 7. Thin Film Battery Market Regional Outlook Estimates & Forecasts
- 7.1. Regional Snapshot
- 7.2. Thin Film Battery Market: Regional Movement Analysis, 2024 & 2030
- 7.3. North America
- 7.3.1. Market Estimates and Forecast, 2018 - 2030 (USD Million)
- 7.3.2. Market Estimates and Forecast, By Battery Type, 2018 - 2030 (USD Million)
- 7.3.3. Market Estimates and Forecast, By Voltage, 2018 - 2030 (USD Million)
- 7.3.4. Market Estimates and Forecast, By Application, 2018 - 2030 (USD Million)
- 7.3.5. U.S.
- 7.3.5.1. Market Estimates and Forecast, 2018 - 2030 (USD Million)
- 7.3.5.2. Market Estimates and Forecast, By Battery Type, 2018 - 2030 (USD Million)
- 7.3.5.3. Market Estimates and Forecast, By Voltage, 2018 - 2030 (USD Million)
- 7.3.5.4. Market Estimates and Forecast, By Application, 2018 - 2030 (USD Million)
- 7.4. Europe
- 7.4.1. Market Estimates and Forecast, 2018 - 2030 (USD Million)
- 7.4.2. Market Estimates and Forecast, By Battery Type, 2018 - 2030 (USD Million)
- 7.4.3. Market Estimates and Forecast, By Voltage, 2018 - 2030 (USD Million)
- 7.4.4. Market Estimates and Forecast, By Application, 2018 - 2030 (USD Million)
- 7.4.5. UK
- 7.4.5.1. Market Estimates and Forecast, 2018 - 2030 (USD Million)
- 7.4.5.2. Market Estimates and Forecast, By Battery Type, 2018 - 2030 (USD Million)
- 7.4.5.3. Market Estimates and Forecast, By Voltage, 2018 - 2030 (USD Million)
- 7.4.5.4. Market Estimates and Forecast, By Application, 2018 - 2030 (USD Million)
- 7.4.6. Germany
- 7.4.6.1. Market Estimates and Forecast, 2018 - 2030 (USD Million)
- 7.4.6.2. Market Estimates and Forecast, By Battery Type, 2018 - 2030 (USD Million)
- 7.4.6.3. Market Estimates and Forecast, By Voltage, 2018 - 2030 (USD Million)
- 7.4.6.4. Market Estimates and Forecast, By Application, 2018 - 2030 (USD Million)
- 7.4.7. France
- 7.4.7.1. Market Estimates and Forecast, 2018 - 2030 (USD Million)
- 7.4.7.2. Market Estimates and Forecast, By Battery Type, 2018 - 2030 (USD Million)
- 7.4.7.3. Market Estimates and Forecast, By Voltage, 2018 - 2030 (USD Million)
- 7.4.7.4. Market Estimates and Forecast, By Application, 2018 - 2030 (USD Million)
- 7.5. Asia Pacific
- 7.5.1. Market Estimates and Forecast, 2018 - 2030 (USD Million)
- 7.5.2. Market Estimates and Forecast, By Battery Type, 2018 - 2030 (USD Million)
- 7.5.3. Market Estimates and Forecast, By Voltage, 2018 - 2030 (USD Million)
- 7.5.4. Market Estimates and Forecast, By Application, 2018 - 2030 (USD Million)
- 7.5.5. China
- 7.5.5.1. Market Estimates and Forecast, 2018 - 2030 (USD Million)
- 7.5.5.2. Market Estimates and Forecast, By Battery Type, 2018 - 2030 (USD Million)
- 7.5.5.3. Market Estimates and Forecast, By Voltage, 2018 - 2030 (USD Million)
- 7.5.5.4. Market Estimates and Forecast, By Application, 2018 - 2030 (USD Million)
- 7.5.6. India
- 7.5.6.1. Market Estimates and Forecast, 2018 - 2030 (USD Million)
- 7.5.6.2. Market Estimates and Forecast, By Battery Type, 2018 - 2030 (USD Million)
- 7.5.6.3. Market Estimates and Forecast, By Voltage, 2018 - 2030 (USD Million)
- 7.5.6.4. Market Estimates and Forecast, By Application, 2018 - 2030 (USD Million)
- 7.5.7. Japan
- 7.5.7.1. Market Estimates and Forecast, 2018 - 2030 (USD Million)
- 7.5.7.2. Market Estimates and Forecast, By Battery Type, 2018 - 2030 (USD Million)
- 7.5.7.3. Market Estimates and Forecast, By Voltage, 2018 - 2030 (USD Million)
- 7.5.7.4. Market Estimates and Forecast, By Application, 2018 - 2030 (USD Million)
- 7.5.8. South Korea
- 7.5.8.1. Market Estimates and Forecast, 2018 - 2030 (USD Million)
- 7.5.8.2. Market Estimates and Forecast, By Battery Type, 2018 - 2030 (USD Million)
- 7.5.8.3. Market Estimates and Forecast, By Voltage, 2018 - 2030 (USD Million)
- 7.5.8.4. Market Estimates and Forecast, By Product, 2018 - 2030 (USD Million)
- 7.5.8.5. Market Estimates and Forecast, By Application, 2018 - 2030 (USD Million)
- 7.6. Latin America
- 7.6.1. Market Estimates and Forecast, 2018 - 2030 (USD Million)
- 7.6.2. Market Estimates and Forecast, By Battery Type, 2018 - 2030 (USD Million)
- 7.6.3. Market Estimates and Forecast, By Voltage, 2018 - 2030 (USD Million)
- 7.6.4. Market Estimates and Forecast, By Application, 2018 - 2030 (USD Million)
- 7.7. Middle East & Africa
- 7.7.1. Market Estimates and Forecast, 2018 - 2030 (USD Million)
- 7.7.2. Market Estimates and Forecast, By Battery Type, 2018 - 2030 (USD Million)
- 7.7.3. Market Estimates and Forecast, By Voltage, 2018 - 2030 (USD Million)
- 7.7.4. Market Estimates and Forecast, By Application, 2018 - 2030 (USD Million)
Chapter 8. Competitive Landscape
- 8.1. Recent Developments & Impact Analysis, By Key Market Participants
- 8.2. Vendor Landscape
- 8.2.1. Company Categorization
- 8.2.2. List Of Key Distributors and Channel Partners
- 8.2.3. List Of Potential Customers/End Users
- 8.3. Competitive Dynamics
- 8.3.1. Competitive Benchmarking
- 8.3.2. Strategy Mapping
- 8.3.3. Heat Map Analysis
- 8.4. Company Profiles/Listing
- 8.4.1. Blue Spark Technologies
- 8.4.1.1. Participant's Overview
- 8.4.1.2. Financial Performance
- 8.4.1.3. Product Benchmarking
- 8.4.1.4. Strategic Initiatives
- 8.4.2. BrightVolt.
- 8.4.2.1. Participant's Overview
- 8.4.2.2. Financial Performance
- 8.4.2.3. Product Benchmarking
- 8.4.2.4. Strategic Initiatives
- 8.4.3. Enfucell
- 8.4.3.1. Participant's Overview
- 8.4.3.2. Financial Performance
- 8.4.3.3. Product Benchmarking
- 8.4.3.4. Strategic Initiatives
- 8.4.4. STMicroelectronics
- 8.4.4.1. Participant's Overview
- 8.4.4.2. Financial Performance
- 8.4.4.3. Product Benchmarking
- 8.4.4.4. Strategic Initiatives
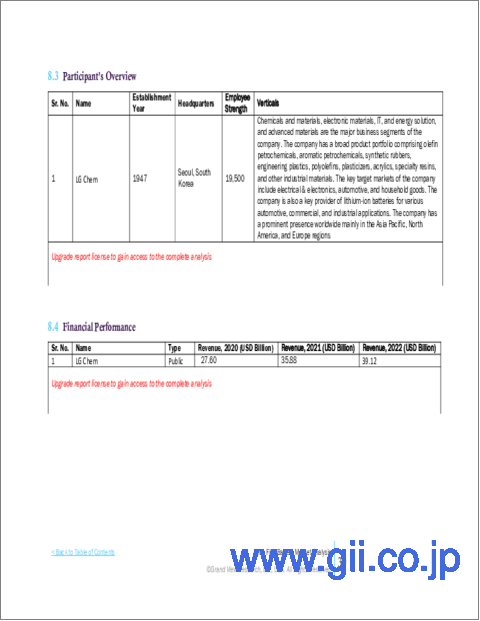
- 8.4.5. LG Chem
- 8.4.5.1. Participant's Overview
- 8.4.5.2. Financial Performance
- 8.4.5.3. Product Benchmarking
- 8.4.5.4. Strategic Initiatives
- 8.4.6. LionVolt
- 8.4.6.1. Participant's Overview
- 8.4.6.2. Financial Performance
- 8.4.6.3. Product Benchmarking
- 8.4.6.4. Strategic Initiatives
- 8.4.7. SAMSUNG SDI Co. Ltd.
- 8.4.7.1. Participant's Overview
- 8.4.7.2. Financial Performance
- 8.4.7.3. Product Benchmarking
- 8.4.7.4. Strategic Initiatives
- 8.4.8. Ilika Plc.
- 8.4.8.1. Participant's Overview
- 8.4.8.2. Financial Performance
- 8.4.8.3. Product Benchmarking
- 8.4.8.4. Strategic Initiatives
- 8.4.9. BTRY AG
- 8.4.9.1. Participant's Overview
- 8.4.9.2. Financial Performance
- 8.4.9.3. Product Benchmarking
- 8.4.9.4. Strategic Initiatives
- 8.4.10. NGK Insulators, Ltd.
- 8.4.10.1. Participant's Overview
- 8.4.10.2. Financial Performance
- 8.4.10.3. Product Benchmarking
- 8.4.10.4. Strategic Initiatives
- 8.4.11. The Kurt J. Lesker Company
- 8.4.11.1. Participant's Overview
- 8.4.11.2. Financial Performance
- 8.4.11.3. Product Benchmarking
- 8.4.11.4. Strategic Initiatives
- 8.4.12. Ultralife Corporation
- 8.4.12.1. Participant's Overview
- 8.4.12.2. Financial Performance
- 8.4.12.3. Product Benchmarking
- 8.4.12.4. Strategic Initiatives
- 8.4.1. Blue Spark Technologies
