
|
市場調査レポート
商品コード
1685232
空気絶縁開閉装置市場の機会、成長促進要因、産業動向分析、2025年~2034年の予測Air Insulated Switchgear Market Opportunity, Growth Drivers, Industry Trend Analysis, and Forecast 2025 - 2034 |
||||||
カスタマイズ可能
|
|||||||
| 空気絶縁開閉装置市場の機会、成長促進要因、産業動向分析、2025年~2034年の予測 |
|
出版日: 2025年01月27日
発行: Global Market Insights Inc.
ページ情報: 英文 100 Pages
納期: 2~3営業日
|

全表示
- 概要
- 目次
空気絶縁開閉装置の世界市場は2024年に99億米ドルに達し、2025年から2034年にかけてCAGR 7.8%で成長すると予測されています。
この成長は、特に急速な工業化と都市化が進む新興経済圏で、信頼性が高く効率的な配電システムへの需要が高まっていることが背景にあります。これらの地域における電力インフラの拡大は、AISソリューションに大きな機会をもたらしています。これらのシステムは、費用対効果、耐候性、低メンテナンス要件で支持されており、多様な配電アプリケーションに理想的な選択肢となっています。さらに、再生可能エネルギー統合への世界のシフトと老朽化した送電網の近代化が、AISシステムの採用にさらなる拍車をかけています。産業や都市中心部の拡大に伴い、安定的かつ効率的な配電網の必要性が重要となっており、AISはこうした需要を満たす重要なコンポーネントとして位置づけられています。また、コンパクトな設計や安全機能の強化など、技術的な進歩も見られ、さまざまな分野での採用が進むと予想されます。
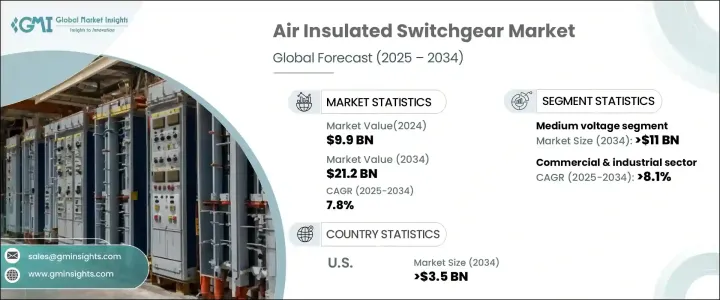
中電圧分野は、産業、商業、公益事業の各用途で堅牢な配電網に対するニーズが高まっていることから、2034年までに110億米ドルを創出すると予想されています。中電圧AISソリューションは、急速に成長する都市部や産業部門の需要を満たす信頼性の高い電力供給ソリューションを提供し、その適応性とコスト効率の高さから支持を集めています。製造施設から公益変電所まで、多様なアプリケーションをサポートするその能力は、市場におけるその重要性を強調しています。このセグメントの成長は、スマートグリッド技術への投資の増加や、中電圧AISシステムの能力と一致するエネルギー効率への注目の高まりによって、さらに強化されています。
| 市場範囲 | |
|---|---|
| 開始年 | 2024 |
| 予測年 | 2025-2034 |
| 開始金額 | 99億米ドル |
| 予測金額 | 212億米ドル |
| CAGR | 7.8% |
エネルギー効率と信頼性を高めるために設計された配電システムへの投資増加により、商業・産業部門は2034年までCAGR 8.1%で成長すると予想されます。工場、データセンター、オフィスビル、ショッピングモールなどの商業インフラの拡大が、中電圧と高電圧の両カテゴリーにおけるAISソリューションの需要に拍車をかけています。これらのシステムは、配電ネットワークの安定的かつ効率的な運用を保証するものであり、これらの部門のエネルギー・ニーズをサポートするために不可欠なものとなっています。企業が持続可能性と業務効率を優先するにつれて、AISシステムの採用が加速し、市場成長にさらに貢献すると予想されます。
米国の空気絶縁開閉装置市場は、同国の電力インフラの継続的な改善により、2034年までに35億米ドルを生み出すと予測されています。米国政府の電力網の信頼性と効率性を高める取り組みが、先進的なAISシステムの需要を高める上で極めて重要な役割を果たしています。さらに、再生可能エネルギー源の送電網への統合の増加は、AISソリューションの採用をさらに促進すると予想されます。これらのシステムは配電を管理し、送電網の安定性を確保するために不可欠であり、国のエネルギー転換の取り組みに不可欠な要素となっています。老朽化したインフラの近代化とスマートグリッド技術の採用に注力していることも、米国の市場成長に寄与しています。
目次
第1章 調査手法と調査範囲
- 市場の定義
- 基本推定と計算
- 予測計算
- データソース
第2章 エグゼクティブサマリー
第3章 業界洞察
- エコシステム分析
- 規制状況
- 業界への影響要因
- 促進要因
- 業界の潜在的リスク&課題
- 成長ポテンシャル分析
- ポーター分析
- PESTEL分析
第4章 競合情勢
- 戦略ダッシュボード
- イノベーションと持続可能性の展望
第5章 市場規模・予測:電圧別、2021年~2034年
- 主要動向
- 中電圧
- 高電圧
第6章 市場規模・予測:用途別、2021年~2034年
- 主要動向
- 住宅
- 商業・工業
- ユーティリティ
第7章 市場規模・予測:地域別、2021年~2034年
- 主要動向
- 北米
- 米国
- カナダ
- メキシコ
- 欧州
- 英国
- フランス
- ドイツ
- イタリア
- ロシア
- スペイン
- アジア太平洋
- 中国
- オーストラリア
- インド
- 日本
- 韓国
- 中東・アフリカ
- サウジアラビア
- アラブ首長国連邦
- トルコ
- 南アフリカ
- エジプト
- ラテンアメリカ
- ブラジル
- アルゼンチン
第8章 企業プロファイル
- ABB
- Bharat Heavy Electricals
- CG Power and Industrial Solutions
- E+I Engineering
- Eaton
- Fuji Electric
- General Electric
- HD Hyundai Electric
- Hitachi
- Hyosung Heavy Industries
- Lucy Group
- Mitsubishi Electric
- Ormazabal
- Schneider Electric
- Siemens
- Skema
- Toshiba
The Global Air Insulated Switchgear Market reached USD 9.9 billion in 2024 and is projected to grow at a CAGR of 7.8% between 2025 and 2034. This growth is driven by the increasing demand for reliable and efficient power distribution systems, particularly in emerging economies experiencing rapid industrialization and urbanization. The expansion of power infrastructure in these regions is creating significant opportunities for AIS solutions. These systems are favored for their cost-effectiveness, weather resistance, and low maintenance requirements, making them an ideal choice for diverse power distribution applications. Additionally, the global shift toward renewable energy integration and the modernization of aging power grids are further fueling the adoption of AIS systems. As industries and urban centers expand, the need for stable and efficient power distribution networks becomes critical, positioning AIS as a key component in meeting these demands. The market is also witnessing technological advancements, such as compact designs and enhanced safety features, which are expected to drive further adoption across various sectors.
The medium voltage segment is anticipated to generate USD 11 billion by 2034, supported by the growing need for robust power distribution networks across industrial, commercial, and utility applications. Medium voltage AIS solutions are gaining traction due to their adaptability and cost-efficiency, providing reliable power supply solutions to meet the demands of rapidly growing urban and industrial sectors. Their ability to support diverse applications, from manufacturing facilities to utility substations, underscores their importance in the market. The segment's growth is further bolstered by increasing investments in smart grid technologies and the rising focus on energy efficiency, which aligns with the capabilities of medium voltage AIS systems.
| Market Scope | |
|---|---|
| Start Year | 2024 |
| Forecast Year | 2025-2034 |
| Start Value | $9.9 Billion |
| Forecast Value | $21.2 Billion |
| CAGR | 7.8% |
The commercial and industrial sectors are expected to grow at a CAGR of 8.1% through 2034, driven by rising investments in power distribution systems designed to enhance energy efficiency and reliability. The expansion of commercial infrastructure, including factories, data centers, office buildings, and shopping malls, is fueling the demand for AIS solutions in both medium and high voltage categories. These systems ensure the stable and efficient operation of power distribution networks, making them indispensable for supporting the energy needs of these sectors. As businesses prioritize sustainability and operational efficiency, the adoption of AIS systems is expected to accelerate, further contributing to market growth.
U.S. air insulated switchgear market is projected to generate USD 3.5 billion by 2034, driven by ongoing upgrades to the country's power infrastructure. The U.S. government's initiatives to enhance the reliability and efficiency of the national power grid are playing a pivotal role in boosting the demand for advanced AIS systems. Additionally, the increasing integration of renewable energy sources into the grid is expected to further drive the adoption of AIS solutions. These systems are critical for managing power distribution and ensuring grid stability, making them a vital component of the country's energy transition efforts. The focus on modernizing aging infrastructure and adopting smart grid technologies also contributes to market growth in the United States.
Table of Contents
Chapter 1 Methodology & Scope
- 1.1 Market definitions
- 1.2 Base estimates & calculations
- 1.3 Forecast calculation
- 1.4 Data sources
- 1.4.1 Primary
- 1.4.2 Secondary
- 1.4.2.1 Paid
- 1.4.2.2 Public
Chapter 2 Executive Summary
- 2.1 Industry synopsis, 2021 - 2034
Chapter 3 Industry Insights
- 3.1 Industry ecosystem analysis
- 3.2 Regulatory landscape
- 3.3 Industry impact forces
- 3.3.1 Growth drivers
- 3.3.2 Industry pitfalls & challenges
- 3.4 Growth potential analysis
- 3.5 Porter's analysis
- 3.5.1 Bargaining power of suppliers
- 3.5.2 Bargaining power of buyers
- 3.5.3 Threat of new entrants
- 3.5.4 Threat of substitutes
- 3.6 PESTEL analysis
Chapter 4 Competitive landscape, 2024
- 4.1 Strategic dashboard
- 4.2 Innovation & sustainability landscape
Chapter 5 Market Size and Forecast, By Voltage, 2021 – 2034 (USD Million, ‘000 Units)
- 5.1 Key trends
- 5.2 Medium
- 5.3 High
Chapter 6 Market Size and Forecast, By Application, 2021 – 2034 (USD Million, ‘000 Units)
- 6.1 Key trends
- 6.2 Residential
- 6.3 Commercial & Industrial
- 6.4 Utility
Chapter 7 Market Size and Forecast, By Region, 2021 – 2034 (USD Million, ‘000 Units)
- 7.1 Key trends
- 7.2 North America
- 7.2.1 U.S.
- 7.2.2 Canada
- 7.2.3 Mexico
- 7.3 Europe
- 7.3.1 UK
- 7.3.2 France
- 7.3.3 Germany
- 7.3.4 Italy
- 7.3.5 Russia
- 7.3.6 Spain
- 7.4 Asia Pacific
- 7.4.1 China
- 7.4.2 Australia
- 7.4.3 India
- 7.4.4 Japan
- 7.4.5 South Korea
- 7.5 Middle East & Africa
- 7.5.1 Saudi Arabia
- 7.5.2 UAE
- 7.5.3 Turkey
- 7.5.4 South Africa
- 7.5.5 Egypt
- 7.6 Latin America
- 7.6.1 Brazil
- 7.6.2 Argentina
Chapter 8 Company Profiles
- 8.1 ABB
- 8.2 Bharat Heavy Electricals
- 8.3 CG Power and Industrial Solutions
- 8.4 E + I Engineering
- 8.5 Eaton
- 8.6 Fuji Electric
- 8.7 General Electric
- 8.8 HD Hyundai Electric
- 8.9 Hitachi
- 8.10 Hyosung Heavy Industries
- 8.11 Lucy Group
- 8.12 Mitsubishi Electric
- 8.13 Ormazabal
- 8.14 Schneider Electric
- 8.15 Siemens
- 8.16 Skema
- 8.17 Toshiba

