
ブチル化ヒドロキシトルエン市場における機会、成長要因、業界動向分析、および2026年から2035年までの予測
Butylated Hydroxytoluene (BHT) Market Opportunity, Growth Drivers, Industry Trend Analysis, and Forecast 2026 - 2035
- 発行日
- ページ情報
- 英文 190 Pages
- 納期
- 2~3営業日
- 商品コード
- 1913447
- カスタマイズ可能 お客様のご希望に応じて、既存データの加工や未掲載情報(例:国別セグメント)の追加などの対応が可能です。詳細はお問い合わせください。
- 翻訳ツール提供対象 PDF対応AI翻訳ツールの無料貸し出しサービスのご利用が可能です
概要
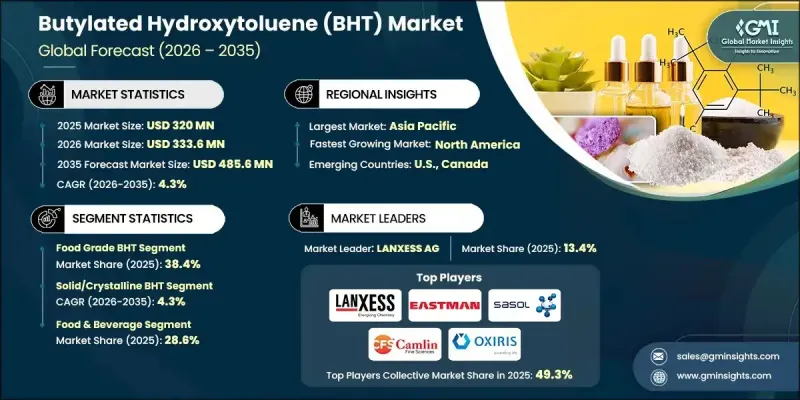
世界のブチル化ヒドロキシトルエン(BHT)市場は、2025年に3億2,000万米ドルと評価され、2035年までにCAGR 4.3%で成長し、4億8,560万米ドルに達すると予測されています。
市場の発展は、複数の産業分野において効果的な抗酸化剤としてブチル化ヒドロキシトルエンが広く使用されていることに支えられています。BHTは油脂の酸化を遅らせる上で重要な役割を果たし、製品の安定性向上と保存期間の延長に直接貢献します。フリーラジカルを中和する能力により劣化や品質低下を防止するため、食品保存、パーソナルケア製品、医薬品における必須成分となっています。包装製品や長期保存製品の需要増加は、工業プロセスにおけるBHTの重要性をさらに高めています。コスト効率の良さ、強力な抗酸化性能、製品特性への影響が最小限であることから、BHTは引き続き支持されています。発展途上国における食品加工および化粧品生産の拡大は、市場の成長をさらに後押ししています。しかしながら、特定の地域における規制枠組みの進化や健康関連の問題が市場力学を形成しており、メーカーは需要を維持し長期的な市場の安定を確保するため、コンプライアンス、品質保証、製品の純度に注力することが求められています。
| 市場範囲 | |
|---|---|
| 開始年 | 2025年 |
| 予測年度 | 2026-2035 |
| 開始時価値 | 3億2,000万米ドル |
| 予測金額 | 4億8,560万米ドル |
| CAGR | 4.3% |
食品グレードのBHTは2025年に38.4%のシェアを占め、2035年までCAGR 4.4%で成長すると予測されています。このセグメントは、加工食品、シリアル、飲料、動物栄養製品における抗酸化剤ソリューションへの強い需要の恩恵を受けています。鮮度と製品の完全性を維持する必要性は消費を支え続けていますが、規制監督と変化する消費者の嗜好が配合戦略に影響を与えています。
固体または結晶性BHTセグメントは2025年に73.4%のシェアを占め、2026年から2035年にかけてCAGR 4.3%で成長すると予測されています。この形態は、安定性、取り扱い容易性、正確な投与能力、様々な配合との互換性から広く採用されています。その一貫した性能と保存上の利点は、食品、医薬品、化粧品用途における需要を継続的に牽引しています。
北米のブチル化ヒドロキシトルエン(BHT)市場は2025年に29.9%のシェアを占めました。食品・医薬品・化粧品メーカーからの安定した需要と、厳格な品質・安全基準が地域成長を支えています。高純度製剤への重視と規制順守への取り組みが、購買決定を形作り市場勢いを維持し続けております。
よくあるご質問
目次
第1章 調査手法と範囲
第2章 エグゼクティブサマリー
第3章 業界考察
- エコシステム分析
- サプライヤーの情勢
- 利益率
- 各段階における付加価値
- バリューチェーンに影響を与える要因
- ディスラプション
- 業界への影響要因
- 促進要因
- 業界の潜在的リスク&課題
- 市場機会
- 成長可能性分析
- 規制情勢
- 北米
- 欧州
- アジア太平洋地域
- ラテンアメリカ
- 中東・アフリカ
- ポーター分析
- PESTEL分析
- 価格動向
- 地域別
- 製品タイプ別
- 将来の市場動向
- 技術とイノベーションの動向
- 現在の技術動向
- 新興技術
- 特許状況
- 貿易統計(HSコード)(注:貿易統計は主要国のみ提供されます)
- 主要輸入国
- 主要輸出国
- 持続可能性と環境面
- 持続可能な取り組み
- 廃棄物削減戦略
- 生産におけるエネルギー効率
- 環境に配慮した取り組み
- カーボンフットプリントへの配慮
第4章 競合情勢
- イントロダクション
- 企業の市場シェア分析
- 地域別
- 北米
- 欧州
- アジア太平洋地域
- ラテンアメリカ
- 中東・アフリカ地域
- 地域別
- 企業マトリクス分析
- 主要市場企業の競合分析
- 競合ポジショニングマトリックス
- 主な発展
- 合併・買収
- 提携・協業
- 新製品の発売
- 事業拡大計画
第5章 市場推計・予測:グレード別、2022-2035
- 食品グレードBHT
- 医薬品グレード
- 工業用テクニカルグレードBHT
第6章 市場推計・予測:形態別、2022-2035
- 固体/結晶性BHT
- 液体BHT
第7章 市場推計・予測:用途別、2022-2035
- 食品・飲料
- 化粧品・パーソナルケア
- 医薬品製剤
- ポリマー・プラスチック安定化剤
- 潤滑油・石油製品
- 飼料添加物
- 包装材料及び食品接触物質
第8章 市場推計・予測:地域別、2022-2035
- 北米
- 米国
- カナダ
- 欧州
- ドイツ
- 英国
- フランス
- スペイン
- イタリア
- その他欧州地域
- アジア太平洋地域
- 中国
- インド
- 日本
- オーストラリア
- 韓国
- その他アジア太平洋地域
- ラテンアメリカ
- ブラジル
- メキシコ
- アルゼンチン
- その他ラテンアメリカ地域
- 中東・アフリカ
- サウジアラビア
- 南アフリカ
- アラブ首長国連邦
- その他中東・アフリカ地域
第9章 企業プロファイル
- AB Enterprises
- Akrochem Corporation
- Anmol Chemicals
- Camlin Fine Sciences Ltd.
- Eastman Chemical Company
- Kemin Industries
- KH Chemicals BV
- Lanxess AG
- Oxiris Chemicals S.A.
- Ratnagiri Chemicals Pvt Ltd
- Sasol Limited
- SI Group
- 発行日
- 発行
- Global Market Insights Inc.
- ページ情報
- 英文 190 Pages
- 納期
- 2~3営業日


