
乳がん治療市場の機会、成長促進要因、産業動向分析、2025年~2034年の予測
Breast Cancer Therapeutics Market Opportunity, Growth Drivers, Industry Trend Analysis, and Forecast 2025 - 2034- 発行日
- ページ情報
- 英文 130 Pages
- 納期
- 2~3営業日
- 商品コード
- 1797854
- カスタマイズ可能 お客様のご希望に応じて、既存データの加工や未掲載情報(例:国別セグメント)の追加などの対応が可能です。詳細はお問い合わせください。
- 翻訳ツール提供対象 PDF対応AI翻訳ツールの無料貸し出しサービスのご利用が可能です
概要
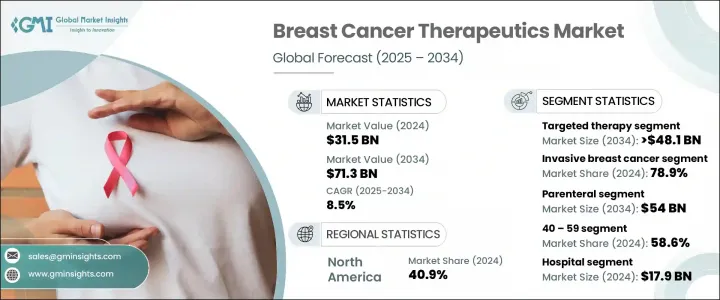
乳がん治療の世界市場は、2024年には315億米ドルと評価され、CAGR 8.5%で成長し、2034年には713億米ドルに達すると推定されています。
市場成長の要因は、乳がんの罹患率の高さ、早期発見・早期治療に対する意識の高まり、政府や非営利団体による検診への支援の高まりなどです。検診が増加し、早期に発見される症例が増えるにつれて、効果的な治療オプションに対する需要が高まり、市場の勢いを支えています。また、高齢化率の上昇、肥満、座りがちなライフスタイル、都市化が乳がん有病率の上昇に寄与しています。新興国市場における医療アクセスの拡大が、治療の普及をさらに後押ししています。標的治療、ホルモン療法、免疫療法などの個別化医療の進歩が治療成績を向上させ、市場拡大に拍車をかけています。
乳がん治療疾患の進行を抑制し、再発を予防し、生存率を向上させることを目的とした一連の治療が含まれます。メルク、アストラゼネカ、ノバルティス、ファイザー、F.ホフマン・ラ・ロシュなどの大手製薬会社は研究開発に多額の投資を行っており、特にプレシジョン・オンコロジーとバイオマーカー主導型治療に注力しています。政府による検診プログラムや啓蒙キャンペーンは早期診断を加速させ、ひいては先進的治療への需要を牽引しています。新興国のヘルスケア・インフラの成長と償還制度改革により、より広範なアクセスが可能になります。モノクローナル抗体、低分子阻害剤、免疫腫瘍薬など、より標的を絞った治療へのシフトが、副作用を抑えながら有効性を向上させ、採用をさらに後押ししています。
| 市場範囲 | |
|---|---|
| 開始年 | 2024 |
| 予測年 | 2025-2034 |
| 開始金額 | 315億米ドル |
| 予測金額 | 713億米ドル |
| CAGR | 8.5% |
標的治療薬は、がん関連バイオマーカーを標的とし、副作用が少ないことから、2024年に214億米ドルの売上を記録しました。抗体薬物複合体、HER2阻害剤、PARP阻害剤などの治療形態は、初期段階から後期段階までの治療プロトコールで広く採用されています。HER2低サブタイプ治療薬とAIによる患者層別化における革新は、このカテゴリーの継続的な市場リーダーシップを支えています。
浸潤性乳がんセグメントは2024年に78.9%のシェアを占め、最も罹患率の高い病型です。浸潤性乳管がんだけで浸潤性症例の約80%、乳がん診断の約55%を占める。浸潤性乳がんは、その攻撃的な性質と乳管外への転移の可能性から、標的薬、SERMなどのホルモン調整薬、化学療法、免疫療法など幅広い治療アプローチが求められ、強い臨床需要を牽引しています。
北米の乳がん治療の市場シェアは2024年に40.9%となり、米国とカナダがリードしています。高度なヘルスケアインフラ、早期発見に対する意識の高さ、旺盛ながん研究投資、有利な償還制度が治療薬採用を後押ししました。この地域は、迅速な規制当局の承認、独自の治療法の高い普及率、新たな治療法の広範な導入などの恩恵を受け、世界の乳がん治療情勢におけるリーダーシップを強化しています。
この業界を形成している主要企業は、技術革新と世界展開を推進しています。大手製薬企業は、コンパニオン診断によって最適化された精密標的治療を可能にする、分子サブタイプによる患者の層別化に重点を置いています。多くの企業が、抗体薬物複合体、二重特異性抗体、CDK4/6阻害剤、免疫療法の組み合わせなどの新規治療法のパイプラインを拡充し、ポートフォリオの充実を図っています。バイオテクノロジー企業との戦略的買収、ライセンシング契約、戦略的提携により、革新的な化合物や新たな研究開発人材へのアクセスが加速しています。新興市場への世界な拡大は、地域の販売業者やヘルスケアシステムとの提携を通じて達成されています。さらに、企業は償還交渉をサポートするために、実臨床試験や価値に基づく成果に投資しています。
目次
第1章 調査手法と範囲
第2章 エグゼクティブサマリー
第3章 業界考察
- エコシステム分析
- 業界への影響要因
- 促進要因
- 世界の乳がん発症率の上昇
- 標的療法と免疫療法の進歩
- 意識の高まりと早期発見プログラム
- 個別化医療とバイオマーカー検査の需要増加
- 業界の潜在的リスク&課題
- 治療費が高め
- 治療の副作用と毒性
- 市場機会
- 新しい治療法の開発
- コラボレーションと戦略的パートナーシップ
- 促進要因
- 成長可能性分析
- テクノロジーの情勢
- 現在の技術動向
- 新興技術
- パイプライン分析
- 規制情勢
- 将来の市場動向
- ポーター分析
- PESTEL分析
第4章 競合情勢
- イントロダクション
- 企業マトリックス分析
- 主要市場企業の競合分析
- 競合ポジショニングマトリックス
- 主な発展
- 合併と買収
- パートナーシップとコラボレーション
- 新製品の発売
第5章 市場推計・予測:療法別、2021年~2034年
- 主要動向
- 標的療法
- ホルモン療法
- 化学療法
- 免疫療法
第6章 市場推計・予測:がんタイプ別、2021年~2034年
- 主要動向
- 乳管内がん(DCIS)
- 浸潤性乳がん
- 浸潤性乳管がん(IDC)
- ホルモン受容体
- HER2陽性
- トリプルネガティブ乳がん(TNBC)
- その他の浸潤性乳管がん(IDC)の種類
- 浸潤性小葉がん(ILC)
- 浸潤性乳管がん(IDC)
第7章 市場推計・予測:投与経路別、2021年~2034年
- 主要動向
- オーラル
- 非経口
第8章 市場推計・予測:年齢別、2021年~2034年
- 主要動向
- 20~39歳
- 40~59歳
- 60歳以上
第9章 市場推計・予測:最終用途別、2021年~2034年
- 主要動向
- 病院
- オンコロジークリニック
- その他の用途
第10章 市場推計・予測:地域別、2021年~2034年
- 主要動向
- 北米
- 米国
- カナダ
- 欧州
- ドイツ
- 英国
- フランス
- スペイン
- イタリア
- オランダ
- アジア太平洋地域
- 日本
- 中国
- インド
- オーストラリア
- 韓国
- ラテンアメリカ
- ブラジル
- メキシコ
- アルゼンチン
- 中東・アフリカ
- 南アフリカ
- サウジアラビア
- アラブ首長国連邦
第11章 企業プロファイル
- Amgen
- AstraZeneca
- Eisai
- Eli Lilly and Company
- F. Hoffmann La Roche
- GE HealthCare
- Gilead Sciences
- Macrogenics
- Merck
- Novartis
- Pfizer
- Sun Pharmaceutical
目次
The Global Breast Cancer Therapeutics Market was valued at USD 31.5 billion in 2024 and is estimated to grow at a CAGR of 8.5% to reach USD 71.3 billion by 2034. The market growth is attributed to a combination of factors: high incidence of breast cancer, expanded awareness of early detection and treatment, and rising support from government and nonprofit screening initiatives. As screening increases and more cases are identified at earlier stages, demand for effective treatment options rises, supporting the market's momentum. Also, rising rates of aging populations, obesity, sedentary lifestyles, and urbanization are contributing to higher breast cancer prevalence. Expanded health access in developing markets further boosts therapy uptake. Advances in personalized medicine-such as targeted treatments, hormone therapy, and immunotherapy-are enhancing outcomes and fueling market expansion.
Breast cancer therapeutics encompass a spectrum of treatments aimed at controlling disease progression, preventing recurrence, and improving survival. Leading pharmaceutical firms such as Merck, AstraZeneca, Novartis, Pfizer, and F. Hoffmann-La Roche are investing heavily in R&D, particularly focusing on precision oncology and biomarker-driven therapies. Government screening programs and awareness campaigns are accelerating early diagnosis, which in turn drives demand for advanced treatments. Growth in emerging economies' healthcare infrastructure and reimbursement reforms enabling broader access. The shift toward more targeted interventions-including monoclonal antibodies, small-molecule inhibitors, and immuno-oncology agents-is improving efficacy while reducing side effects, further boosting adoption.
| Market Scope | |
|---|---|
| Start Year | 2024 |
| Forecast Year | 2025-2034 |
| Start Value | $31.5 Billion |
| Forecast Value | $71.3 Billion |
| CAGR | 8.5% |
The targeted therapies generated USD 21.4 billion in 2024, dominating due to their ability to target cancer-associated biomarkers with fewer adverse reactions. Formats such as antibody-drug conjugates, HER2 inhibitors, and PARP inhibitors are widely adopted across both early- and late-stage treatment protocols. Innovations in HER2 low subtype therapies and AI guided patient stratification support continued market leadership of this category.
The invasive breast cancer segment held 78.9% share in 2024 and is the most prevalent form of disease. Invasive ductal carcinoma alone accounts for about 80% of all invasive cases and roughly 55% of breast cancer diagnoses. Because of its aggressive nature and potential to metastasize beyond the ducts, invasive breast cancer demands broad treatment approaches, including targeted agents, hormone modulators such as SERMs, chemotherapy, and immunotherapies, driving strong clinical demand.
North America Breast Cancer Therapeutics Market held 40.9% share in 2024, with the United States and Canada leading. Advanced healthcare infrastructure, high early detection awareness, strong oncology research investment, and favorable reimbursement systems drove therapeutic adoption. This region benefits from rapid regulatory approvals, high proprietary therapy penetration, and widespread uptake of emerging treatment modalities, reinforcing its leadership in the global breast cancer therapeutics landscape.
Major companies shaping this industry include Pfizer, F. Hoffmann-La Roche, Merck, AstraZeneca, Novartis, and Eli Lilly, driving innovation and global reach. Leading pharmaceutical players are focusing heavily on patient stratification by molecular subtype, enabling precision-targeted therapies optimized with companion diagnostics. Many firms are expanding pipelines in novel modalities such as antibody-drug conjugates, bispecific antibodies, CDK4/6 inhibitors, and immunotherapy combinations to strengthen portfolio depth. Strategic acquisitions, licensing agreements, and strategic partnerships with biotech firms accelerate access to innovative compounds and emerging R&D talent. Global expansion into emerging markets is being achieved through collaborations with regional distributors and healthcare systems. Additionally, firms invest in real-world studies and value-based outcomes to support reimbursement negotiations.
Table of Contents
Chapter 1 Methodology and Scope
- 1.1 Market scope and definition
- 1.2 Research design
- 1.2.1 Research approach
- 1.2.2 Data collection methods
- 1.3 Data mining sources
- 1.3.1 Global
- 1.3.2 Regional/Country
- 1.4 Base estimates and calculations
- 1.4.1 Base year calculation
- 1.4.2 Key trends for market estimation
- 1.5 Primary research and validation
- 1.5.1 Primary sources
- 1.6 Forecast model
- 1.7 Research assumptions and limitations
Chapter 2 Executive Summary
- 2.1 Industry 3600 synopsis
- 2.2 Key market trends
- 2.2.1 Regional
- 2.2.2 Therapy
- 2.2.3 Cancer type
- 2.2.4 Route of administration
- 2.2.5 Age group
- 2.2.6 End use
- 2.3 CXO perspectives: Strategic imperatives
- 2.3.1 Key decision points for industry executives
- 2.3.2 Critical success factors for market players
- 2.4 Future outlook and strategic recommendations
Chapter 3 Industry Insights
- 3.1 Industry ecosystem analysis
- 3.2 Industry impact forces
- 3.2.1 Growth drivers
- 3.2.1.1 Rising global incidence of breast cancer
- 3.2.1.2 Advancements in targeted and immunotherapies
- 3.2.1.3 Growing awareness and early detection programs
- 3.2.1.4 Increasing demand for personalized medicine and biomarker testing
- 3.2.2 Industry pitfalls and challenges
- 3.2.2.1 High cost of treatment
- 3.2.2.2 Side effects and toxicity of treatments
- 3.2.3 Market opportunities
- 3.2.3.1 Development of novel therapeutics
- 3.2.3.2 Collaborations and strategic partnerships
- 3.2.1 Growth drivers
- 3.3 Growth potential analysis
- 3.4 Technology landscape
- 3.4.1 Current technological trends
- 3.4.2 Emerging technologies
- 3.5 Pipeline analysis
- 3.6 Regulatory landscape
- 3.7 Future market trends
- 3.8 Porter's analysis
- 3.9 PESTEL analysis
Chapter 4 Competitive Landscape, 2024
- 4.1 Introduction
- 4.2 Company matrix analysis
- 4.3 Competitive analysis of major market players
- 4.4 Competitive positioning matrix
- 4.5 Key developments
- 4.5.1 Merger and acquisition
- 4.5.2 Partnership and collaboration
- 4.5.3 New product launches
Chapter 5 Market Estimates and Forecast, By Therapy, 2021 - 2034 ($ Mn)
- 5.1 Key trends
- 5.2 Targeted therapy
- 5.3 Hormonal therapy
- 5.4 Chemotherapy
- 5.5 Immunotherapy
Chapter 6 Market Estimates and Forecast, By Cancer Type, 2021 - 2034 ($ Mn)
- 6.1 Key trends
- 6.2 Ductal carcinoma in situ (DCIS)
- 6.3 Invasive breast cancer
- 6.3.1 Invasive ductal carcinoma (IDC)
- 6.3.1.1 Hormone receptor
- 6.3.1.2 HER2+
- 6.3.1.3 Triple-negative breast cancer (TNBC)
- 6.3.1.4 Other invasive ductal carcinoma (IDC) types
- 6.3.2 Invasive lobular carcinoma (ILC)
- 6.3.1 Invasive ductal carcinoma (IDC)
Chapter 7 Market Estimates and Forecast, By Route of Administration, 2021 - 2034 ($ Mn)
- 7.1 Key trends
- 7.2 Oral
- 7.3 Parenteral
Chapter 8 Market Estimates and Forecast, By Age Group, 2021 - 2034 ($ Mn)
- 8.1 Key trends
- 8.2 20 - 39
- 8.3 40 - 59
- 8.4 Above 60
Chapter 9 Market Estimates and Forecast, By End Use, 2021 - 2034 ($ Mn)
- 9.1 Key trends
- 9.2 Hospitals
- 9.3 Oncology clinics
- 9.4 Other end use
Chapter 10 Market Estimates and Forecast, By Region, 2021 - 2034 ($ Mn)
- 10.1 Key trends
- 10.2 North America
- 10.2.1 U.S.
- 10.2.2 Canada
- 10.3 Europe
- 10.3.1 Germany
- 10.3.2 UK
- 10.3.3 France
- 10.3.4 Spain
- 10.3.5 Italy
- 10.3.6 Netherlands
- 10.4 Asia Pacific
- 10.4.1 Japan
- 10.4.2 China
- 10.4.3 India
- 10.4.4 Australia
- 10.4.5 South Korea
- 10.5 Latin America
- 10.5.1 Brazil
- 10.5.2 Mexico
- 10.5.3 Argentina
- 10.6 Middle East and Africa
- 10.6.1 South Africa
- 10.6.2 Saudi Arabia
- 10.6.3 UAE
Chapter 11 Company Profiles
- 11.1 Amgen
- 11.2 AstraZeneca
- 11.3 Eisai
- 11.4 Eli Lilly and Company
- 11.5 F. Hoffmann La Roche
- 11.6 GE HealthCare
- 11.7 Gilead Sciences
- 11.8 Macrogenics
- 11.9 Merck
- 11.10 Novartis
- 11.11 Pfizer
- 11.12 Sun Pharmaceutical
- 発行日
- 発行
- Global Market Insights Inc.
- ページ情報
- 英文 130 Pages
- 納期
- 2~3営業日


