
|
市場調査レポート
商品コード
1871309
ソフトウェアテスト市場の機会、成長要因、業界動向分析、および2025年から2034年までの予測Software Testing Market Opportunity, Growth Drivers, Industry Trend Analysis, and Forecast 2025 - 2034 |
||||||
カスタマイズ可能
|
|||||||
| ソフトウェアテスト市場の機会、成長要因、業界動向分析、および2025年から2034年までの予測 |
|
出版日: 2025年10月29日
発行: Global Market Insights Inc.
ページ情報: 英文 235 Pages
納期: 2~3営業日
|

概要
世界のソフトウェアテスト市場は、2024年に558億米ドルと評価され、2034年までにCAGR7.2%で成長し、1,125億米ドルに達すると予測されています。
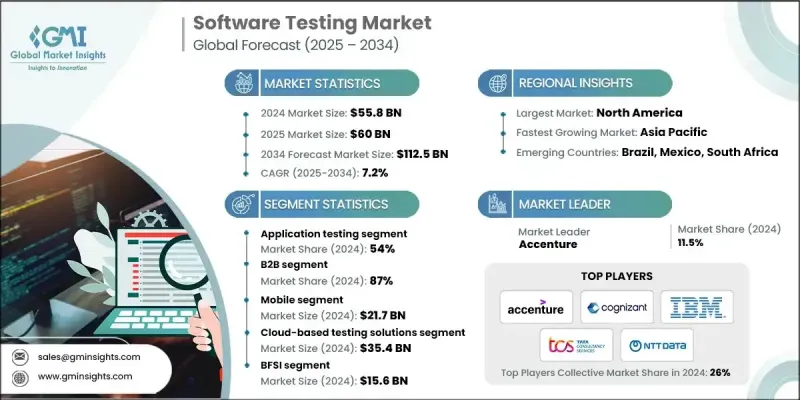
本市場の成長は、アジャイル、DevOps、継続的インテグレーション/継続的デリバリー(CI/CD)調査手法の導入拡大に加え、企業のデジタルトランスフォーメーション(DX)への注力強化によって推進されています。様々な業界の組織が高品質で安全かつ信頼性の高いソフトウェアを優先する中、高度なテストソリューションへの需要が高まっています。AIを活用した自動化、クラウドベースのテストプラットフォーム、ローコード/ノーコードフレームワークにおける継続的な革新により、企業はインテリジェントでスケーラブル、かつコスト効率の高いテスト運用を展開できるようになっております。これらの進歩は市場投入までの時間を短縮し、業務効率を向上させ、ソフトウェア品質を高めております。AI駆動の自動化、近代化されたデジタルインフラ、そしてパフォーマンス、信頼性、サイバーセキュリティに対する期待の高まりに後押しされ、市場は急速な技術的進化を遂げております。企業は、進化する業界規制への準拠を確保しつつ、シームレスな運用と優れた顧客体験を維持するため、DevOpsパイプラインへのテストソリューションの統合を加速しています。
| 市場範囲 | |
|---|---|
| 開始年 | 2024年 |
| 予測期間 | 2025-2034 |
| 開始時価値 | 558億米ドル |
| 予測金額 | 1,125億米ドル |
| CAGR | 7.2% |
ソフトウェアテストソリューション(自動テストプラットフォーム、性能・負荷テストシステム、セキュリティ検証フレームワーク、AI駆動型テスト管理ツールなど)は、ソフトウェアの完全性を維持するために不可欠です。これらのソリューションは、手動介入を最小限に抑えながら、リアルタイム監視、正確な欠陥検出、包括的なアプリケーション検証を可能にします。テストチーム、クラウドインフラストラクチャ、DevOps環境間のシームレスな連携を確保し、より広範な企業のデジタル化戦略を支援します。本市場は、AIを活用した自動化、クラウド導入、ITインフラの近代化、品質とセキュリティに関する規制要件の強化によって形成されています。
アプリケーションテスト分野は2024年に54%のシェアを占め、2025年から2034年にかけてCAGR10.1%で成長が見込まれています。その優位性は、Web、モバイル、エンタープライズプラットフォーム全体におけるソフトウェアの機能性、パフォーマンス、セキュリティ、信頼性を確保する上で重要な役割を担っていることに由来します。この分野は、ソフトウェアベンダー、ITサービスプロバイダー、および企業が高品質なアプリケーションを提供するために不可欠な、機能テスト、性能評価、セキュリティ検証、ユーザーエクスペリエンス評価を網羅しています。
B2Bセグメントは2024年に87%のシェアを占め、2034年までCAGR(7.4%)で成長すると予測されています。この主導的な地位は、金融、医療、製造、ITサービスなどの分野において、企業が安全で高性能かつ信頼性の高いソフトウェアを必要とするニーズの高まりによって推進されています。企業は、コンプライアンスの確保、シームレスな統合、業務効率の向上を図りながらエンドユーザーの満足度を高めるため、包括的なテストソリューションへの投資を進めています。
米国ソフトウェアテスト市場は88%のシェアを占め、2024年には233億米ドルの規模に達しました。米国は、企業向けIT導入の規模が大きいこと、クラウドネイティブおよびモバイルアプリケーションの急速な普及、サイバーセキュリティ・データプライバシー・業界コンプライアンスに関する厳格な規制基準により、大きな機会を秘めています。同国の成熟したITエコシステムは、AI駆動型テスト管理システム、CI/CDパイプライン、次世代テストソリューションの迅速な導入を可能にしています。
グローバルソフトウェアテスト市場における主要プレイヤーには、Tricentis、IBM、Cognizant、Wipro、EPAM Systems、SmartBear Software、Capgemini、TCS、Accenture、NTT Dataなどが挙げられます。ソフトウェアテスト市場の企業は、市場での存在感を拡大し、地位を強化するために複数の戦略を採用しています。スケーラブルでコスト効率に優れ、インテリジェントなテストソリューションを提供するため、AI駆動型テスト自動化とクラウドベースプラットフォームへの多額の投資を行っています。企業はサービス提供範囲とグローバル展開を拡大するため、パートナーシップや合併・買収に注力しています。製品革新と研究開発の取り組みにより、進化する企業のニーズに対応する最先端ソリューションの提供が可能となっています。多くの企業は、DevOps連携、CI/CDサポート、セキュリティコンプライアンスを含むエンドツーエンドのサービス統合を重視しています。戦略的マーケティング、思想的リーダーシップ、業界特化型ソリューションは、ブランド差別化と高付加価値企業顧客の獲得に貢献し、ソフトウェアテスト市場における競争力と長期的な成長を促進しています。
よくあるご質問
目次
第1章 調査手法と範囲
第2章 エグゼクティブサマリー
第3章 業界考察
- エコシステム分析
- サプライヤーの情勢
- 利益率
- コスト構造
- 各段階における付加価値
- バリューチェーンに影響を与える要因
- ディスラプション
- 業界への影響要因
- 促進要因
- アジャイルおよびDevOpsの導入拡大
- 高品質ソフトウェアに対する需要の高まり
- テスト自動化における技術的進歩
- 規制およびコンプライアンス要件
- 業界の潜在的リスク&課題
- 初期投資額が高額
- レガシーシステムとの複雑な統合
- 市場機会
- 急速に進化する技術情勢
- データセキュリティとプライバシーに関する懸念事項
- AI駆動型および予測型テストソリューション
- クラウドベースおよびハイブリッドテストサービス
- 促進要因
- 成長可能性分析
- 規制情勢
- グローバルな規制状況の概要
- 業界固有のコンプライアンス要件
- データプライバシー及び保護に関する規制
- サイバーセキュリティ基準とフレームワーク
- プロフェッショナル認定要件
- 品質基準と認証
- 国境を越えた規制の調和
- ポーター分析
- PESTEL分析
- 技術とイノベーションの情勢
- AIおよび機械学習の統合
- テスト自動化の進化
- クラウドネイティブテストプラットフォーム
- ローコード/ノーコードテストソリューション
- 量子コンピューティングテスト準備
- ブロックチェーンテスト要件
- IoTおよびエッジコンピューティングのテスト
- 拡張現実(AR)および仮想現実(VR)テスト
- 5Gネットワークテスト要件
- 価格動向
- 地域別価格変動
- プレイヤーセグメント別価格戦略
- サービスベースの価格設定モデル
- 価値ベースの価格設定アプローチ
- 規模の経済と範囲の経済
- コスト内訳分析
- 特許分析
- 持続可能性と環境的側面
- 持続可能な実践
- 無駄削減戦略
- 生産におけるエネルギー効率
- 環境に配慮した取り組み
- カーボンフットプリントに関する考慮事項
- リスク評価フレームワーク
- ベストケースシナリオ
- クライアント要件と選定基準の分析
- 企業クライアントのテスト要件
- 中小企業におけるテスト要件と予算制約
- ベンダー選定の決定要因
- ROIの期待値と測定フレームワーク
- サービスレベル契約要件
- セキュリティ及びコンプライアンス要件
- 統合および相互運用性の要件
- 拡張性と柔軟性の要件
- 業界固有のテスト要件
- コンプライアンステスト(PCI-DSS、HIPAA、GDPRへの影響)
- 分野固有の複雑性(フィンテック、医療、自動運転車)
- 規制監査対応準備状況
- 業界ベンチマークとベストプラクティス
- 品質メトリクスと分析フレームワーク
- テスト効果のKPI(欠陥逃れ率、テストROI、サイクルタイム)
- データ駆動型品質洞察
- リアルタイム監視とダッシュボード
- 予測品質分析
- 業界基準との比較評価
- 顧客成功・維持指標
- 導入後のサポート要件
- 顧客満足度の動向
- 顧客離反分析とロイヤルティ要因
- 価値実現までのタイムライン
第4章 競合情勢
- イントロダクション
- 企業の市場シェア分析
- 北米
- 欧州
- アジア太平洋地域
- ラテンアメリカ
- 中東・アフリカ
- 主要市場企業の競合分析
- 競合ポジショニングマトリックス
- 戦略的展望マトリックス
- 主な発展
- 合併・買収
- 提携および協業
- 新製品のリリース
- 事業拡大計画と資金調達状況
- 競合上の脆弱性と脅威
- 主要領域におけるパフォーマンスのギャップ
- 技術的負債とレガシープラットフォームの問題点
- 顧客離反の兆候とリスクのあるセグメント
- 新規参入企業または隣接分野のプレイヤーによる新たな脅威
- 十分にサービスが行き届いていない市場セグメント
- 顧客獲得/喪失分析
- 競合別の取引規模と契約金額
- 特定競合に対する勝率
- 競合案件における主要な差別化要因
- 顧客の移行パターン(乗り換え行動)
- セグメント別の市場シェアの増減
- 技術スタックとプラットフォーム機能マトリクス
- 主要企業間のAI/ML機能比較
- クラウドインフラストラクチャの選好と投資動向
- テスト自動化の適用範囲と深度
- 統合エコシステムの広がり(DevOps、監視、セキュリティツール)
- 独自開発型とオープンソース型のアプローチ
第5章 市場推計・予測:コンポーネント別、2021-2034
- 主要動向
- アプリケーションテスト
- 機能別
- システムテスト
- ユニットテスト
- 統合テスト
- スモークテスト
- 回帰テスト
- その他
- 非機能部品
- セキュリティテスト
- 性能試験
- ユーザビリティテスト
- その他
- 機能別
- 試験サービス
- 専門サービス
- マネージドサービス
第6章 市場推計・予測:事業モデル別、2021-2034
- 主要動向
- B2B
- エンタープライズアプリケーションのテスト
- B2Bプラットフォームのテスト
- 統合テストサービス
- APIテストソリューション
- B2C
- 消費者向けアプリケーションのテスト
- ユーザー体験テスト
- モバイルアプリテスト
- 電子商取引のテスト
第7章 市場推計・予測:プラットフォーム別、2021-2034
- 主要動向
- モバイル
- ネイティブモバイルアプリのテスト
- クロスプラットフォームモバイルテスト
- モバイルデバイステスト
- モバイル性能テスト
- モバイルセキュリティテスト
- ウェブベースのテスト
- Webアプリケーションテスト
- ブラウザ互換性テスト
- Webパフォーマンステスト
- ウェブセキュリティテスト
- プログレッシブウェブアプリのテスト
第8章 市場推計・予測:導入モデル別、2021-2034
- 主要動向
- クラウドベースのテストソリューション
- ソフトウェア・アズ・ア・サービス(SaaS)テストプラットフォーム
- プラットフォーム・アズ・ア・サービス(PaaS)向けテストツール
- インフラストラクチャ・アズ・ア・サービス(IaaS)のテスト
- マルチクラウドテスト戦略
- オンプレミス型テストソリューション
- 従来のテストインフラストラクチャ
- エンタープライズ向けテストプラットフォーム
- 専用試験センター
- ハイブリッドテストソリューション
- クラウドとオンプレミスの統合
- 柔軟な導入モデル
- ハイブリッドテストオーケストレーション
第9章 市場推計・予測:用途別、2021-2034
- 主要動向
- IT
- 通信
- BFSI(銀行・金融・保険)
- 製造業
- 小売り
- ヘルスケア
- 運輸・物流
- 政府・公共部門
- 民生用電子機器
- メディア
- その他
第10章 市場推計・予測:地域別、2021-2034
- 主要動向
- 北米
- 米国
- カナダ
- 欧州
- 英国
- ドイツ
- フランス
- イタリア
- スペイン
- ベルギー
- オランダ
- スウェーデン
- アジア太平洋地域
- 中国
- インド
- 日本
- オーストラリア
- シンガポール
- 韓国
- ベトナム
- インドネシア
- ラテンアメリカ
- ブラジル
- メキシコ
- アルゼンチン
- 中東・アフリカ地域
- アラブ首長国連邦
- 南アフリカ
- サウジアラビア
第11章 企業プロファイル
- Global Player
- Accenture
- Atos
- Capgemini
- Cognizant Technology Solutions
- IBM
- Infosys
- NTT Data
- Tata Consultancy Services(TCS)
- Wipro
- Regional Player
- EPAM Systems
- Keysight Technologies
- Micro Focus International
- Parasoft
- Ranorex
- SmartBear Software
- Tech Mahindra
- Tricentis
- Worksoft
- 新興企業
- Applitools
- Katalon
- Mabl
- Sauce Labs
- Testim

