表紙:直接リチウム抽出(DLE)の世界市場(2025年~2035年)
市場調査レポート
商品コード
1595743

直接リチウム抽出(DLE)の世界市場(2025年~2035年)

The Global Direct Lithium Extraction (DLE) Market 2025-2035


出版日
ページ情報
英文 160 Pages, 87 Tables, 20 Figures
納期
即納可能 即納可能とは
価格
価格表記: GBPを日本円(税抜)に換算
本日の銀行送金レート: 1GBP=195.09円
直接リチウム抽出(DLE)の世界市場(2025年~2035年)
出版日: 2024年12月13日
発行: Future Markets, Inc.
ページ情報: 英文 160 Pages, 87 Tables, 20 Figures
納期: 即納可能 即納可能とは
GIIご利用のメリット
  • 全表示
  • 概要
  • 図表
  • 目次
概要

世界の直接リチウム抽出(DLE)市場は、成長する電気自動車産業を支える持続可能なリチウム生産への差し迫った需要に後押しされ、急速に拡大しています。DLE技術は、生産時間を18~24ヶ月から1~2日に劇的に短縮し、回収率を70~90%向上させ、水の消費を90%削減し、土地の占有面積を80%縮小することで、環境に対する影響を大幅に軽減するなど、従来の方法に比べて大きな利点を提供します。EVの市場規模は2030年までに2億5,000万台を超えると予測されており、炭酸リチウム換算で年間300万~400万トンが必要となります。

大規模な商業開発が世界的に加速しており、主要地域でDLEプロジェクトが実施されています。この部門への設備投資は、2023年に25億米ドルに達し、2030年までに150億米ドルを超えると予測されています。この技術は、従来の方法よりも生産コストが20~30%低く、投資回収期間が3~5年と短いという魅力的な経済性を提供する一方で、技術のスケールアップ、高い初期資本要件、立地特有の最適化の必要性といった課題が残っています。このような課題にもかかわらず、DLEは、技術革新と環境の持続可能性、経済性を兼ね備えた、リチウム生産における変革の機会を示しています。

当レポートでは、世界の直接リチウム抽出(DLE)市場について調査分析し、市場力学、技術革新、成長機会に関する詳細な考察を提供しています。

目次

第1章 エグゼクティブサマリー

  • 市場の概要
    • リチウムの生産と需要
    • 従来の抽出方法の問題点
    • 直接リチウム抽出市場
    • 直接リチウム抽出市場の成長軌道
    • 主な市場セグメント
  • 市場予測
    • 短期見通し(2024年~2026年)
    • 中期予測(2026年~2030年)
    • 長期予測(2030年~2035年)
  • 市場促進要因
    • 電気自動車の成長
    • エネルギー貯蔵需要
    • 政府の政策
    • 技術の進歩
    • 持続可能性の目標
    • 供給の安全性
  • 市場の課題
    • 技術的な障壁
    • 経済的実現可能性
    • スケールアップの問題
    • リソースの可用性
    • 規制上のハードル
    • 競合
  • 商業活動
    • 市場マップ
    • 世界のリチウム抽出プロジェクト
    • DLEプロジェクト
    • ビジネスモデル
    • 投資

第2章 イントロダクション

  • リチウムの用途
  • リチウム塩水鉱床
  • 定義と動作原理
    • 基本的な概念とメカニズム
    • プロセス化学
    • 技術の進化
  • DLE技術の種類
    • 塩水資源
    • 硬岩資源
    • 堆積物に含まれる鉱床
    • イオン交換
    • 吸着
    • 膜分離
    • 溶媒抽出
    • 電気化学的抽出
    • 化学沈殿
    • 新しいハイブリッドアプローチ
  • 従来の抽出法に対する利点
    • 回収率
    • 環境に対する影響
    • 処理時間
    • 製品の純度
  • DLE技術の比較
  • 価格
  • 環境に対する影響と持続可能性
  • エネルギー要件
  • 水の使用
  • 回収率
    • 技術タイプ別
    • 資源タイプ別
    • 最適化可能性
  • スケーラビリティ
  • 資源分析
    • 塩水資源
    • 粘土鉱床
    • 地熱水
    • 資源品質の評価
    • 抽出可能性

第3章 世界市場の分析

  • 市場規模と成長
  • 市場シェア:地域別
    • 北米
    • 南米
    • アジア太平洋
    • 欧州
  • コスト分析
    • CAPEXの比較
    • OPEXの内訳
    • 1トン当たりのコストの分析
  • 需給の力学
    • 現在の供給
    • 需要の予測
  • 規則
  • 競合情勢

第4章 企業プロファイル(64社の企業プロファイル)

第5章 付録

第6章 参考文献

図表

List of Tables

  • Table 1. Lithium sources and extraction methods
  • Table 2. Global Lithium Production 2023, by country
  • Table 3. Factors Affecting Lithium Production Outlook
  • Table 4. Worldwide Distribution of DLE Projects - Comprehensive Table
  • Table 5. Announced vs Assumed DLE Outlook
  • Table 6. Global Lithium Production and Demand 2020-2024 (ktpa LCE)
  • Table 7. Lithium Production Forecast 2025-2035
  • Table 8. Li Production Contribution by Resource Type (%)
  • Table 9. Li Production Contribution from Brine Extraction (ktpa LCE)
  • Table 10. Lithium Supply vs Demand Outlook 2023-2035 (ktpa LCE)
  • Table 11. Comparison of lithium extraction methods
  • Table 12. Key Characteristics by DLE Method
  • Table 13. Global DLE Market Size 2020-2024
  • Table 14. DLE Market Growth Projections 2024-2035
  • Table 15. DLE Production Forecast by Country (ktpa LCE)
  • Table 16. DLE forecast by extraction technology
  • Table 17. DLE forecast segmented by brine type
  • Table 18. Direct Lithium Extraction Key Market Segments
  • Table 19. Market Drivers for DLE
  • Table 20. Market Challenges in Direct Lithium Extraction
  • Table 21. Alternative Technologies Comparison
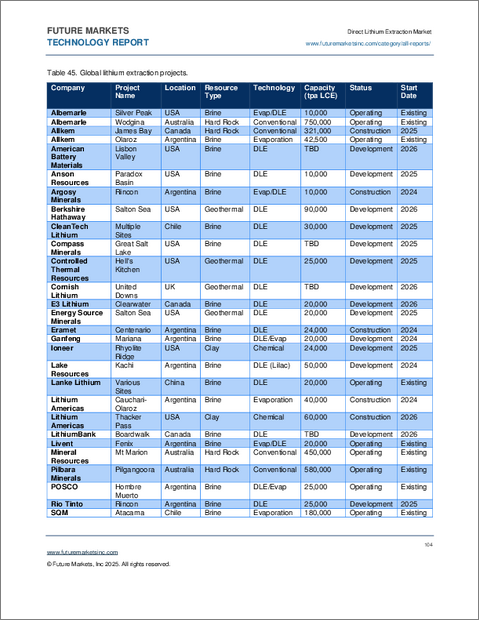
  • Table 22. Global lithium extraction projects
  • Table 23. Current and Planned DLE Projects
  • Table 24. Traditional Brine Operations
  • Table 25. Hard Rock Operations
  • Table 26. Conversion Plants
  • Table 27. Business Models by DLE Player Activity
  • Table 28. Business Models by Li Recovery Process
  • Table 29. DLE Investments
  • Table 30. Lithium applications
  • Table 31. Types of lithium brine deposits
  • Table 32. Existing and emerging methods for lithium mining & extraction
  • Table 33. Technology Evolution Timeline and Characteristics
  • Table 34. Types of DLE Technologies
  • Table 35. Brine Evaporation vs Brine DLE Comparison
  • Table 36. Commercial Hard Rock (Spodumene) Projects
  • Table 37. Companies in Sedimentary Lithium Processing
  • Table 38. Ion exchange processes for lithium extraction
  • Table 39. Ion Exchange DLE Projects and Companies
  • Table 40. Companies in ion exchange DLE
  • Table 41. Adsorption vs Absorption
  • Table 42. Adsorption Processes for Lithium Extraction
  • Table 43. Adsorption vs ion exchange
  • Table 44. Types of Sorbent Materials
  • Table 45. Commercial brine evaporation projects
  • Table 46. Comparison of Al/Mn/Ti-based Sorbents
  • Table 47. Adsorption DLE Projects
  • Table 48. Companies in adsorption DLE
  • Table 49. Membrane processes for lithium recovery
  • Table 50. Membrane Materials
  • Table 51. Membrane Filtration Comparison
  • Table 52. Potential-assisted Membrane Technologies
  • Table 53. Companies in membrane technologies for DLE
  • Table 54. Membrane technology developers by Li recovery process
  • Table 55. Solvent extraction processes for lithium extraction
  • Table 56. Companies in solvent extraction DLE
  • Table 57. Electrochemical technologies for lithium recovery
  • Table 58. Companies in electrochemical extraction DLE
  • Table 59. Chemical Precipitation Agents
  • Table 60. Novel Hybrid DLE Approaches
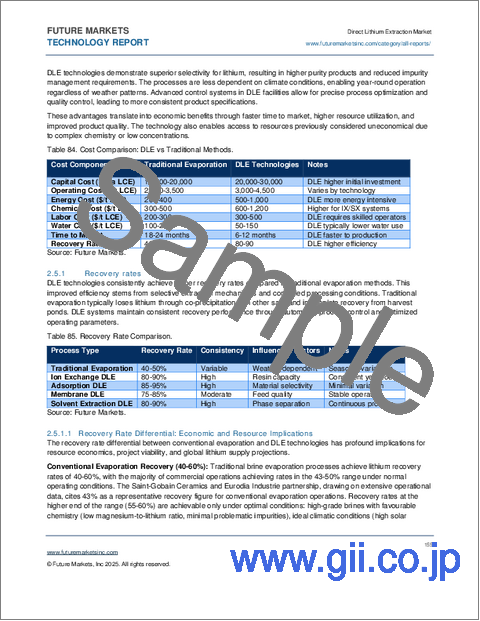
  • Table 61. Cost Comparison: DLE vs Traditional Methods
  • Table 62. Recovery Rate Comparison
  • Table 63. Environmental Impact Comparison
  • Table 64. Processing Time Comparison
  • Table 65. Product Purity Comparison
  • Table 66. Comparison of DLE Technologies
  • Table 67. Lithium Prices 2019-2024 (Battery Grade Li2CO3)
  • Table 68. Energy Consumption Comparison
  • Table 69. Water Usage by Technology Type
  • Table 70. Recovery Rates Comparison
  • Table 71. Recovery Rates By Technology Type
  • Table 72. Recovery Rates By Resource Type
  • Table 73. Global Lithium Resource Distribution,
  • Table 74. Quality Parameters
  • Table 75. Brine Chemistry Comparison
  • Table 76. Resource Quality Matrix
  • Table 77. Extraction Potential by Resource Type
  • Table 78. Global DLE Market Size by Region
  • Table 79. CAPEX Breakdown by Technology
  • Table 80. Cost Comparisons Between Lithium Projects
  • Table 81. OPEX Breakdown Table (USD/tonne LCE)
  • Table 82. Production Cost Comparison (USD/tonne LCE)
  • Table 83. Sustainability Comparisons
  • Table 84. Regulations and incentives related to lithium extraction and mining
  • Table 85. DLE Patent Filing Trends 2015-2024
  • Table 86. Glossary of Terms
  • Table 87. List of Abbreviations

List of Figures

  • Figure 1. Schematic of a conventional lithium extraction process with evaporation ponds
  • Figure 2. Schematic for a direct lithium extraction (DLE) process.
  • Figure 3. Global DLE Market Size 2020-2024
  • Figure 4. DLE Market Growth Projections 2024-2035
  • Figure 5. Market map of DLE technology developers
  • Figure 6. Direct Lithium Extraction Process
  • Figure 7. Direct lithium extraction (DLE) technologies
  • Figure 8. Ion Exchange Process Flow Diagram
  • Figure 9. SWOT analysis for ion exchange technologies
  • Figure 10. SWOT analysis for adsorption DLE
  • Figure 11. Membrane Separation Schematic
  • Figure 12. SWOT analysis for membrane DLE
  • Figure 13. SWOT analysis for solvent extraction DLE
  • Figure 14. SWOT analysis for electrochemical extraction DLE
  • Figure 15. SWOT analysis for chemical precipitation
  • Figure 16. Conventional vs. DLE processes
  • Figure 17. Global DLE Market Size by Region
  • Figure 18. Competitive Position Matrix
  • Figure 19. Flionex-R process
  • Figure 20. Volt Lithium Process
目次

The global Direct Lithium Extraction (DLE) market is undergoing rapid expansion, driven by the pressing demand for sustainable lithium production to support the growing electric vehicle industry. DLE technologies offer significant advantages over traditional methods, including dramatic reduction in production time from 18-24 months to 1-2 days, increased recovery rates of 70-90%, and substantially reduced environmental impact through 90% lower water consumption and 80% smaller land footprint. The EV market's projection of 250+ million vehicles by 2030 necessitates 3-4 million tons of lithium carbonate equivalent annually, creating a substantial supply gap that DLE is positioned to address.

Major commercial developments are accelerating globally, with companies implementing DLE projects across key regions. Capital investment in the sector reached $2.5 billion in 2023 and is expected to exceed $15 billion by 2030, focusing on advanced sorbent materials, process automation, and renewable energy integration. While the technology offers compelling economics with 20-30% lower production costs than traditional methods and shorter payback periods of 3-5 years, challenges remain in technology scale-up, high initial capital requirements, and site-specific optimization needs. Despite these challenges, DLE represents a transformative opportunity in lithium production, combining technological innovation with environmental sustainability and economic viability.

"The Global Direct Lithium Extraction (DLE) Market 2025-2035" analyzes the sector, providing detailed insights into market dynamics, technological innovations, and growth opportunities. The report combines extensive primary research with detailed secondary analysis of market trends, competitive landscapes, and technological developments. The study examines key DLE technologies including ion exchange, adsorption, membrane separation, solvent extraction, and electrochemical methods, providing comparative analysis of their performance metrics, cost structures, and commercial viability. It evaluates various extraction processes against traditional methods, analyzing recovery rates, environmental impact, processing times, and product purity.

Key market segments covered include technology types, resource types (brines, clays, geothermal waters), and geographical regions. The report provides detailed market size projections, with breakdowns by technology and region, supported by comprehensive data on market drivers including EV growth, energy storage demand, and government policies.

Report contents include:

  • Detailed market size and growth projections through 2035
  • Technology comparison and performance analysis
  • Cost analysis including CAPEX and OPEX breakdowns
  • Environmental impact and sustainability assessments
  • Competitive landscape analysis featuring 64 companies. Companies profiled include Adionics, Aepnus Technology, American Battery Materials, Anson Resources, Arcadium Lithium, Albemarle Corporation, alkaLi, Arizona Lithium, BioMettallum, Century Lithium, CleanTech Lithium, Conductive Energy, Controlled Thermal Resources, Cornish Lithium, E3 Lithium, Ekosolve, ElectraLith, Ellexco, EnergyX, Energy Sourcer Minerals, Eon Minerals, Eramet, Evove, ExSorbiton, Geo40, Geolith, Go2Lithium, International Battery Metals, Jintai Lithium, Koch Technology Solutions, KMX Technologies, Lake Resources, Lanke Lithium, Lihytech, Lilac Solutions, LithiumBank, Lithios, Mangrove Lithium, MVP Lithium, Novalith, Olukun Minerals, PureLi, Posco, Precision Periodic, Qinghai Chaidamu Xinghua Lithium Salt Co., Saltworks Technologies, SLB, Solvay, SpecifX and more.....These companies span the DLE value chain from technology developers to project operators, with solutions ranging from ion exchange and membrane technologies to electrochemical extraction methods. The profiles analyze each company's technological approach, commercial development stage, strategic partnerships, and market positioning within the rapidly evolving DLE landscape.
  • Regional market analysis covering North America, South America, Asia Pacific, and Europe
  • Resource analysis including brine chemistry and extraction potential
  • Commercial project analysis and investment trends

The analysis covers critical market drivers including electric vehicle adoption, energy storage demand, government policies, and technological advancements. It addresses key challenges such as technical barriers, economic viability, scale-up issues, and regulatory hurdles.

Special focus areas include:

  • Comparative analysis of DLE technologies and their commercial readiness
  • Environmental and sustainability implications
  • Resource quality assessment and extraction potential
  • Economic analysis including capital costs and operating expenses
  • Regulatory framework and policy impacts
  • Supply-demand dynamics and price trends

TABLE OF CONTENTS

1. EXECUTIVE SUMMARY

  • 1.1. Market Overview
    • 1.1.1. Lithium production and demand
      • 1.1.1.1. DLE Projects
      • 1.1.1.2. Global Lithium Production and Demand 2020-2024 (ktpa LCE)
      • 1.1.1.3. Lithium Production Forecast 2025-2035
    • 1.1.2. Issues with traditional extraction methods
    • 1.1.3. The Direct Lithium Extraction market
    • 1.1.4. Growth trajectory for The Direct Lithium Extraction market
    • 1.1.5. Key market segments
  • 1.2. Market forecasts
    • 1.2.1. Short-term outlook (2024-2026)
    • 1.2.2. Medium-term forecasts (2026-2030)
    • 1.2.3. Long-term predictions (2030-2035)
  • 1.3. Market Drivers
    • 1.3.1. Electric Vehicle Growth
    • 1.3.2. Energy Storage Demand
    • 1.3.3. Government Policies
    • 1.3.4. Technological Advancements
      • 1.3.4.1. Process improvements
      • 1.3.4.2. Efficiency gains
      • 1.3.4.3. Cost reduction
    • 1.3.5. Sustainability Goals
    • 1.3.6. Supply Security
  • 1.4. Market Challenges
    • 1.4.1. Technical Barriers
    • 1.4.2. Economic Viability
    • 1.4.3. Scale-up Issues
    • 1.4.4. Resource Availability
    • 1.4.5. Regulatory Hurdles
    • 1.4.6. Competition
      • 1.4.6.1. Traditional methods
      • 1.4.6.2. Alternative technologies
  • 1.5. Commercial activity
    • 1.5.1. Market map
    • 1.5.2. Global lithium extraction projects
    • 1.5.3. DLE Projects
    • 1.5.4. Business models
    • 1.5.5. Investments

2. INTRODUCTION

  • 2.1. Applications of lithium
  • 2.2. Lithium brine deposits
  • 2.3. Definition and Working Principles
    • 2.3.1. Basic concepts and mechanisms
    • 2.3.2. Process chemistry
    • 2.3.3. Technology evolution
  • 2.4. Types of DLE Technologies
    • 2.4.1. Brine Resources
    • 2.4.2. Hard Rock Resources
    • 2.4.3. Sediment-hosted deposits
    • 2.4.4. Ion Exchange
      • 2.4.4.1. Resin-based systems
      • 2.4.4.2. Inorganic ion exchangers
      • 2.4.4.3. Hybrid systems
      • 2.4.4.4. Companies
      • 2.4.4.5. SWOT analysis
    • 2.4.5. Adsorption
      • 2.4.5.1. Adsorption vs ion exchange
      • 2.4.5.2. Physical adsorption
      • 2.4.5.3. Chemical adsorption
      • 2.4.5.4. Selective materials
        • 2.4.5.4.1. Ion sieves
        • 2.4.5.4.2. Sorbent Composites
      • 2.4.5.5. Companies
      • 2.4.5.6. SWOT analysis
    • 2.4.6. Membrane Separation
      • 2.4.6.1. Pressure-assisted
        • 2.4.6.1.1. Reverse osmosis (RO)
        • 2.4.6.1.2. Membrane fouling
        • 2.4.6.1.3. Microfiltration (MF), ultrafiltration (UF), and nanofiltration (NF)
      • 2.4.6.2. Potential-assisted
        • 2.4.6.2.1. Electrodialysis
        • 2.4.6.2.2. Bipolar
        • 2.4.6.2.3. Capacitive deionization (CDI)
        • 2.4.6.2.4. Membrane distillation (MD)
      • 2.4.6.3. Companies
      • 2.4.6.4. SWOT analysis
    • 2.4.7. Solvent Extraction
      • 2.4.7.1. Overview
        • 2.4.7.1.1. CO2-based extraction systems
      • 2.4.7.2. Companies
      • 2.4.7.3. SWOT analysis
    • 2.4.8. Electrochemical extraction
      • 2.4.8.1. Overview
      • 2.4.8.2. Battery-based
      • 2.4.8.3. Intercalation Cells
      • 2.4.8.4. Hybrid Capacitive
      • 2.4.8.5. Modified Electrodes
      • 2.4.8.6. Flow-through Systems
      • 2.4.8.7. Companies
      • 2.4.8.8. SWOT analysis
    • 2.4.9. Chemical precipitation
      • 2.4.9.1. Overview
      • 2.4.9.2. SWOT analysis
    • 2.4.10. Novel hybrid approaches
  • 2.5. Advantages Over Traditional Extraction
    • 2.5.1. Recovery rates
    • 2.5.2. Environmental impact
    • 2.5.3. Processing time
    • 2.5.4. Product purity
  • 2.6. Comparison of DLE Technologies
  • 2.7. Prices
  • 2.8. Environmental Impact and Sustainability
  • 2.9. Energy Requirements
  • 2.10. Water Usage
  • 2.11. Recovery Rates
    • 2.11.1. By technology type
    • 2.11.2. By resource type
    • 2.11.3. Optimization potential
  • 2.12. Scalability
  • 2.13. Resource Analysis
    • 2.13.1. Brine Resources
    • 2.13.2. Clay Deposits
    • 2.13.3. Geothermal Waters
    • 2.13.4. Resource Quality Assessment
    • 2.13.5. Extraction Potential

3. GLOBAL MARKET ANALYSIS

  • 3.1. Market Size and Growth
  • 3.2. Regional Market Share
    • 3.2.1. North America
    • 3.2.2. South America
    • 3.2.3. Asia Pacific
    • 3.2.4. Europe
  • 3.3. Cost Analysis
    • 3.3.1. CAPEX comparison
    • 3.3.2. OPEX breakdown
    • 3.3.3. Cost Per Ton Analysis
  • 3.4. Supply-Demand Dynamics
    • 3.4.1. Current supply
    • 3.4.2. Demand projections
  • 3.5. Regulations
  • 3.6. Competitive Landscape

4. COMPANY PROFILES (64 company profiles)

5. APPENDICES

  • 5.1. Glossary of Terms
  • 5.2. List of Abbreviations
  • 5.3. Research Methodology

6. REFERENCES