|
|
市場調査レポート
商品コード
1348022
メタマテリアル・メタサーフェスの世界市場(2024年~2034年)The Global Market for Metamaterials and Metasurfaces 2024-2034 |
||||||
|
|||||||
| メタマテリアル・メタサーフェスの世界市場(2024年~2034年) |
|
出版日: 2023年10月06日
発行: Future Markets, Inc.
ページ情報: 英文 203 Pages, 47 Tables, 72 Figures
納期: 即納可能
|
- 全表示
- 概要
- 図表
- 目次
メタマテリアル用途は、自動運転車向けのレーダーやLiDAR、通信アンテナ、6Gネットワーク、コーティング、振動減衰、ワイヤレス充電、ノイズ防止などの製品の進歩により、今後10年以内に数十億米ドルの市場規模となる見込みです。
当レポートでは、世界のメタマテリアル・メタサーフェス市場について調査分析し、市場の促進要因と動向、最終用途市場と地域ごとの収益の予測、企業プロファイルなどを提供しています。
目次
第1章 エグゼクティブサマリー
- 過去のメタマテリアル市場
- 最近の成長
- 世界市場の収益、現在と予測
- 地域の分析
- 市場機会の評価
- メタマテリアルへの投資資金調達
- 市場と技術の課題
- 産業の発展(2020年~2023年)
第2章 メタマテリアルの概要
- メタマテリアルとは何か
- 電磁メタマテリアル
- メタサーフェス
- メタマテリアルの種類
- 光メタマテリアル
- 電磁メタマテリアル
- 無線周波数(RF)メタマテリアル
- テラヘルツメタマテリアル
- 音響メタマテリアル
- 調整可能なメタマテリアル
- 非線形メタマテリアル
- 自己変化メタマテリアル
- トポロジカルメタマテリアル
- メタマテリアルで使用される材料
- 技術成熟度レベル(TRL)
第3章 メタマテリアルの市場と用途
- 競合情勢
- SWOT分析
- 将来の市場見通し
- 世界のメタマテリアルの収益:市場別(2017年~2034年)
- 最終用途市場別
- 地域別
- 音響
- 市場促進要因と動向
- 用途
- 市場の評価
- 世界の収益(2017年~2034年)
- コミュニケーション
- 市場促進要因と動向
- 用途
- 世界の収益(2017年~2034年)
- 自動車
- 市場促進要因と動向
- 用途
- 市場の評価
- 世界の収益(2017年~2034年)
- 航空宇宙、防衛、セキュリティ
- 市場促進要因と動向
- 用途
- 市場の評価
- 世界の収益(2017年~2034年)
- コーティング、フィルム
- 市場促進要因と動向
- 用途
- 市場の評価
- 世界の収益(2017年~2034年)
- 太陽光発電
- 市場促進要因と動向
- 用途
- 世界の収益(2017年~2034年)
- 医用画像
- 市場促進要因と動向
- 用途
- 世界の収益(2017年~2034年)
- ディスプレイ
- 市場促進要因と動向
- 用途
第4章 企業プロファイル(66社)
第5章 調査手法
第6章 参考文献
List of Tables
- Table 1. Types of metamaterials and their properties
- Table 2. Market summary for metamaterials
- Table 3. Global revenues for metamaterials and metasurfaces, total, 2017-2034 (Millions USD), Conservative estimate
- Table 4. Global revenues for metamaterials and metasurfaces, by region, 2017-2034 (Millions USD)
- Table 5. Market opportunity assessment matrix for metamaterials and metasurfaces applications
- Table 6. Investment funding in metamaterials and metasurfaces companies
- Table 7. Market and technology challenges in metamaterials and metasurfaces
- Table 8. Metamaterials and metasurfaces industry developments 2020-2023
- Table 9. Comparison of types of metamaterials-frequency ranges, key characteristics, and applications
- Table 10. Optical Metamaterial Applications
- Table 11. Applications of radio frequency metamaterials
- Table 12. Applications of acoustic metamaterials
- Table 13. Types of tunable terahertz (THz) metamaterials and their tuning mechanisms
- Table 14. Tunable acoustic metamaterials and their tuning mechanisms
- Table 15. Types of tunable optical metamaterials and their tuning mechanisms
- Table 16. Markets and applications for tunable metamaterials
- Table 17. Types of self-transforming metamaterials and their transformation mechanisms
- Table 18. Key materials used with different types of metamaterials
- Table 19. Technology Readiness Level (TRL) Examples
- Table 20. Global revenues for metamaterials, by end-use market, 2017-2034 (Millions USD)
- Table 21. Global revenues for metamaterials and metasurfaces, by region, 2017-2034 (Millions USD)
- Table 22. Metamaterials and metasurfaces in sound insulation-market drivers and trends
- Table 23. Market assessment for metamaterials and metasurfaces in acoustics
- Table 24. Market opportunity assessment for metamaterials in acoustics
- Table 25. Global revenues for metamaterials and metasurfaces in acoustics, 2017-2034 (Millions USD)
- Table 26: Metamaterials and metasurfaces in electronics and communications-market drivers and trends
- Table 27. Unmet need, metamaterial solution and markets
- Table 28. Market opportunity assessment for metamaterials and metasurfaces in communications
- Table 29. Global revenues for metamaterials and metasurfaces in communications, 2017-2034 (Millions USD)
- Table 30. Metamaterials and metasurfaces in the automotive sector-market drivers and trends
- Table 31. Market assessment for metamaterials and metasurfaces in automotive
- Table 32. Market opportunity assessment for metamaterials and metasurfaces in automotive
- Table 33. Global revenues for metamaterials and metasurfaces in automotive, 2017-2034 (Millions USD)
- Table 34. Metamaterials and metasurfaces in aerospace, defence and security-market drivers and trends
- Table 35. Market assessment for metamaterials and metasurfaces in aerospace, defence & security
- Table 36. Market opportunity assessment for metamaterials and metasurfaces in aerospace, defence & security
- Table 37. Global revenues for metamaterials in aerospace, defence & security, 2017-2034 (Millions USD)
- Table 38. Metamaterials in coatings and films-market drivers and trends
- Table 39. Applications of metamaterials in coatings and thin films
- Table 40. Market assessment for metamaterials and metasurfaces in coatings and films
- Table 41. Market opportunity assessment for metamaterials and metasurfaces in coatings and films
- Table 42. Global revenues for metamaterials and metasurfaces in coatings and films, 2017-2034 (Millions USD)
- Table 43: Metamaterials and metasurfaces in photovoltaics-market drivers and trends
- Table 44. Global revenues for metamaterials and metasurfaces in solar, 2017-2034 (Millions USD)
- Table 45: Metamaterials and metasurfaces in medical imaging-drivers and trends
- Table 46. Global revenues for metamaterials and metasurfaces in medical imaging, 2017-2034 (Millions USD)
- Table 47: Metamaterials and metasurfaces in touch screens and displays-drivers and trends
List of Figures
- Figure 1. Classification of metamaterials based on functionalities
- Figure 2. Global revenues for metamaterials and metasurfaces, total, 2017-2034 (Millions USD)
- Figure 3. Global revenues for metamaterials and metasurfaces, by market, 2017-2034 (Millions USD)
- Figure 4. Global revenues for metamaterials and metasurfaces, by region, 2017-2034 (Millions USD)
- Figure 5. Metamaterials example structures
- Figure 6. Metamaterial schematic versus conventional materials
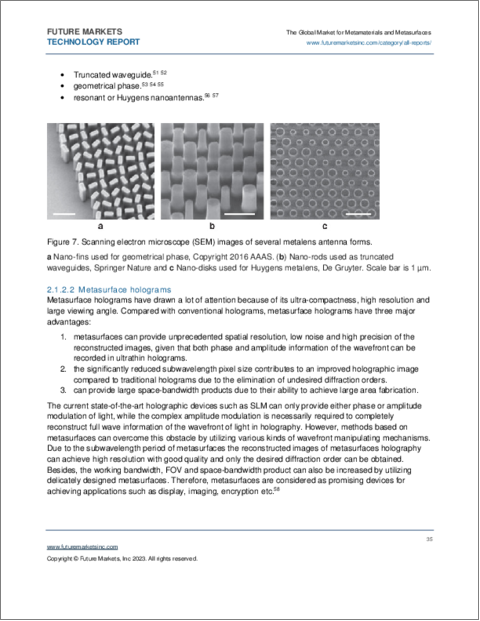
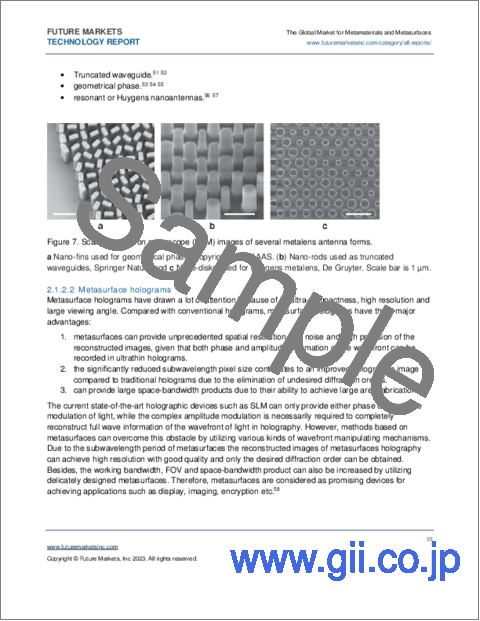
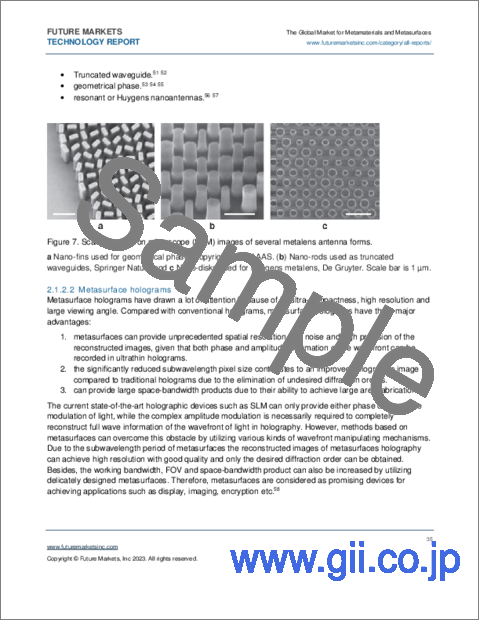
- Figure 7. Scanning electron microscope (SEM) images of several metalens antenna forms
- Figure 8. Transparent and flexible metamaterial film developed by Sekishi Chemical
- Figure 9. Invisibility cloak
- Figure 10. Electromagnetic metamaterial
- Figure 11. Schematic of Electromagnetic Band Gap (EBG) structure
- Figure 12. Schematic of chiral metamaterials
- Figure 13. Metamaterial antenna
- Figure 14. Terahertz metamaterials
- Figure 15. Schematic of the quantum plasmonic metamaterial
- Figure 16. Properties and applications of graphene metamaterials
- Figure 17. Nonlinear metamaterials- 400-nm thick nonlinear mirror that reflects frequency-doubled output using input light intensity as small as that of a laser pointer
- Figure 18. Technology Readiness Level (TRL) for metamaterials and metasurfaces
- Figure 19. SWOT analysis: metamaterials market
- Figure 20. Global revenues for metamaterials, by end-use market, 2017-2034 (Millions USD)
- Figure 21. Global revenues for metamaterials and metasurfaces, by region, 2017-2034 (Millions USD)
- Figure 22. Prototype metamaterial device used in acoustic sound insulation
- Figure 23. Metamaterials installed in HVAC sound insulation the Hotel Madera Hong Kong
- Figure 24. Robotic metamaterial device for seismic-induced vibration mitigation
- Figure 25. Global revenues for metamaterials and metasurfaces in acoustics, 2017-2034 (Millions USD)
- Figure 26. Wireless charging technology prototype
- Figure 27. Flat-panel satellite antenna (top) and antenna mounted on a vehicle (bottom)
- Figure 28. META Transparent Window Film
- Figure 29. Radi-cool metamaterial film
- Figure 30. Global revenues for metamaterials and metasurfaces in communications, 2017-2034 (Millions USD)
- Figure 31. Metamaterials in automotive applications
- Figure 32. Lumotive advanced beam steering concept
- Figure 33. Illustration of EchoDrive operation
- Figure 34. Anti-reflective metamaterials plastic
- Figure 35. Global revenues for metamaterials and metasurfaces in automotive, 2017-2034 (Millions USD)
- Figure 36. Metamaterials invisibility cloak for microwave frequencies
- Figure 37. Metamaterials radar antenna
- Figure 38. Metamaterials radar array
- Figure 39. Evolv Edge visitor screening solution
- Figure 40. Lightweight metamaterial microlattice
- Figure 41. metaAIR eyewear
- Figure 42. Global revenues for metamaterials in aerospace, defence & security, 2017-2034 (Millions USD)
- Figure 43. Schematic of dry-cooling technology
- Figure 44. Global revenues for metamaterials and metasurfaces in coatings and films, 2017-2034 (Millions USD)
- Figure 45. Metamaterial solar coating
- Figure 46. Global revenues for metamaterials and metasurfaces in solar, 2017-2034 (Millions USD)
- Figure 47. A patient in MRI scan modified by metasurface
- Figure 48. Global revenues for metamaterials and metasurfaces in medical imaging, 2017-2034 (Millions USD)
- Figure 49. Stretchable hologram
- Figure 50. Design concepts of soft mechanical metamaterials with large negative swelling ratios and tunable stress-strain curves
- Figure 51. Anywaves antenna products. CubeSat S-band antenna, CubeSat X-band antenna and UAV cellular antenna
- Figure 52. Brelyon monitor
- Figure 53. RadarZero
- Figure 54. Schematic of MESA System
- Figure 55. EchoGuard Radar System
- Figure 56. Edgehog Advanced Technologies Omnidirectional anti-reflective coating
- Figure 57. Emrod architecture. 1. A transmitting antenna. 2. A relay that is essentially lossless, doesn't require any power, and acts as a lens refocusing the beam extending the travel range. 3. A rectenna that receives and rectifies the beam back to electricity. Metamaterials allow converting wireless energy back into electricity efficiently
- Figure 58. Commercial application of Emrod technology
- Figure 59. Evolv Edge screening system
- Figure 60. FM/R technology
- Figure 61. Metablade antenna
- Figure 62. MTenna flat panel antenna
- Figure 63. Kymeta u8 antenna installed on a vehicle
- Figure 64. LIDAR system for autonomous vehicles
- Figure 65. Light-control metasurface beam-steering chips
- Figure 66. Metamaterials film
- Figure 67. Metaboard wireless charger
- Figure 68. Orion dot pattern projector
- Figure 69. A 12-inch wafer made using standard semiconductor processes contains thousands of metasurface optics
- Figure 70. metaAIR
- Figure 71. Nissan acoustic metamaterial
- Figure 72. Metamaterial structure used to control thermal emission
Metamaterials applications will represent a multi-billion dollar market within the next decade with product advances in radar and lidar for autonomous vehicles, telecommunications antenna, 6G networks, coatings, vibration damping, wireless charging, noise prevention and more.
Metamaterials are artificially engineered structures with exceptional material properties (acoustic, electrical, magnetic, optical, etc.). They comprise arrays of resonators that manipulate electromagnetic waves or sound in ways not normally found in nature. Possessing customized dielectric properties and tunable responses they allow for excellent flexibility in a range of applications, their use enabling the manipulation of fields and waves at a subwavelength scale.
Key applications include:
- telecommunications
- acoustics
- sound insulation
- sensors
- radar imaging
- optics (terahertz and infrared)
- coatings & films
- lidar systems for self-driving cars
- imaging and sensing
- power transmission
- energy harvesting
- wireless charging
- thermal management
- superlenses for medical devices
- AR displays
Report content include:
- Current market analysis and future revenue forecasts, by metamaterial types, markets and region.
- Commercialization assessment from research to market
- Market drivers, trends and challenges
- Competitive landscape
- In-depth opportunity assessment in markets including communications, sound insulation, antennas, sensors, solar coatings, displays, and medical imaging
- Profiles of 66 companies including products, investments, partnerships. Companies profiled include Anywaves, Breylon, Echodyne, Inc., Evolv Technologies, Inc., Fractal Antenna Systems, Inc, Imagia, Kymeta Corporation, Lumotive, OPT Industries, Phononic Vibes srl, Metamaterial, Inc. and Metawave Corporation
- Detailed application market forecasts through 2034
- Regional revenues and demand analysis
TABLE OF CONTENTS
1. EXECUTIVE SUMMARY
- 1.1. Historical metamaterials market
- 1.2. Recent growth
- 1.3. Global market revenues, current and forecast
- 1.4. Regional analysis
- 1.5. Market opportunity assessment
- 1.6. Investment funding in metamaterials
- 1.7. Market and technology challenges
- 1.8. Industry developments 2020-2023
2. METAMATERIALS OVERVIEW
- 2.1. What are metamaterials?
- 2.1.1. Electromagnetic metamaterials
- 2.1.2. Metasurfaces
- 2.1.2.1. Meta-Lens
- 2.1.2.2. Metasurface holograms
- 2.1.2.3. Flexible metasurfaces
- 2.1.2.4. Reconfigurable intelligent surfaces (RIS)
- 2.2. Types of metamaterials
- 2.2.1. Optical Metamaterials
- 2.2.1.1. Photonic metamaterials
- 2.2.1.2. Tunable metamaterials
- 2.2.1.3. Frequency selective surface (FSS) based metamaterials
- 2.2.1.4. Plasmonic metamaterials
- 2.2.1.5. Invisibility cloaks
- 2.2.1.6. Perfect absorbers
- 2.2.1.7. Optical nanocircuits
- 2.2.1.8. Metalenses
- 2.2.1.9. Holograms
- 2.2.1.10. Applications
- 2.2.2. Electromagnetic metamaterials
- 2.2.2.1. Double negative (DNG) metamaterials
- 2.2.2.2. Single negative metamaterials
- 2.2.2.3. Electromagnetic bandgap metamaterials (EBG)
- 2.2.2.4. Bi-isotropic and bianisotropic metamaterials
- 2.2.2.5. Chiral metamaterials
- 2.2.2.6. Electromagnetic Invisibility cloak
- 2.2.3. Radio frequency (RF) metamaterials
- 2.2.3.1. RF metasurfaces
- 2.2.3.2. Frequency selective surfaces
- 2.2.3.3. Tunable RF metamaterials
- 2.2.3.4. RF metamaterials antennas
- 2.2.3.5. Absorbers
- 2.2.3.6. Luneburg lens
- 2.2.3.7. RF filters
- 2.2.3.8. Applications
- 2.2.4. Terahertz metamaterials
- 2.2.4.1. THz metasurfaces
- 2.2.4.2. Quantum metamaterials
- 2.2.4.3. Graphene metamaterials
- 2.2.4.4. Flexible/wearable THz metamaterials
- 2.2.4.5. THz modulators
- 2.2.4.6. THz switches
- 2.2.4.7. THz absorbers
- 2.2.4.8. THz antennas
- 2.2.4.9. THz imaging components
- 2.2.5. Acoustic metamaterials
- 2.2.5.1. Sonic crystals
- 2.2.5.2. Acoustic metasurfaces
- 2.2.5.3. Locally resonant materials
- 2.2.5.4. Acoustic cloaks
- 2.2.5.5. Hyperlenses
- 2.2.5.6. Sonic one-way sheets
- 2.2.5.7. Acoustic diodes
- 2.2.5.8. Acoustic absorbers
- 2.2.5.9. Applications
- 2.2.6. Tunable Metamaterials
- 2.2.6.1. Tunable electromagnetic metamaterials
- 2.2.6.2. Tunable THz metamaterials
- 2.2.6.3. Tunable acoustic metamaterials
- 2.2.6.4. Tunable optical metamaterials
- 2.2.6.5. Applications
- 2.2.7. Nonlinear metamaterials
- 2.2.8. Self-Transforming Metamaterials
- 2.2.9. Topological Metamaterials
- 2.2.10. Materials used with metamaterials
- 2.2.1. Optical Metamaterials
- 2.3. Technology Readiness Level (TRL)
3. MARKETS AND APPLICATIONS FOR METAMATERIALS
- 3.1. Competitive landscape
- 3.2. SWOT analysis
- 3.3. Future market outlook
- 3.4. Global revenues for metamaterials, by market, 2017-2034(Millions USD)
- 3.4.1. By end-use market
- 3.4.2. By region
- 3.5. ACOUSTICS
- 3.5.1. Market drivers and trends
- 3.5.2. Applications
- 3.5.2.1. Sound insulation
- 3.5.2.2. Vibration dampers
- 3.5.3. Market assessment
- 3.5.4. Global revenues 2017-2034
- 3.6. COMMUNICATIONS
- 3.6.1. Market drivers and trends
- 3.6.2. Applications
- 3.6.2.1. Wireless Networks
- 3.6.2.2. Fiber Optic Communications
- 3.6.2.3. Satellite Communications
- 3.6.2.4. Thermal management
- 3.6.3. Global revenues 2017-2034
- 3.7. AUTOMOTIVE
- 3.7.1. Market drivers and trends
- 3.7.2. Applications
- 3.7.2.1. Radar and sensors
- 3.7.2.2. Autonomous vehicles
- 3.7.2.3. Anti-reflective plastics
- 3.7.3. Market assessment
- 3.7.4. Global revenues 2017-2034
- 3.8. AEROSPACE, DEFENCE & SECURITY
- 3.8.1. Market drivers and trends
- 3.8.2. Applications
- 3.8.2.1. Stealth technology
- 3.8.2.2. Radar
- 3.8.2.3. Optical sensors
- 3.8.2.4. Security screening
- 3.8.2.5. Composites
- 3.8.2.6. Windscreen films
- 3.8.2.7. Protective eyewear for pilots
- 3.8.2.8. EMI and RFI shielding
- 3.8.2.9. Thermal management
- 3.8.3. Market assessment
- 3.8.4. Global revenues 2017-2034
- 3.9. COATINGS AND FILMS
- 3.9.1. Market drivers and trends
- 3.9.2. Applications
- 3.9.2.1. Cooling films
- 3.9.2.2. Anti-reflection surfaces
- 3.9.2.3. Optical solar reflection coatings
- 3.9.3. Market assessment
- 3.9.4. Global revenues 2017-2034
- 3.10. PHOTOVOLTAICS
- 3.10.1. Market drivers and trends
- 3.10.2. Applications
- 3.10.2.1. Solar-thermal absorber
- 3.10.2.2. Coatings
- 3.10.3. Global revenues 2017-2034
- 3.11. MEDICAL IMAGING
- 3.11.1. Market drivers and trends
- 3.11.2. Applications
- 3.11.2.1. MRI imaging
- 3.11.3. Global revenues 2017-2034
- 3.12. DISPLAYS
- 3.12.1. Market drivers and trends
- 3.12.2. Applications
- 3.12.2.1. Holographic displays
- 3.12.2.2. AR/VR
- 3.12.2.3. Multiview displays
- 3.12.2.4. Stretchable displays
- 3.12.2.5. Soft materials
- 3.12.2.6. Anti-reflection coatings
4. COMPANY PROFILES (66 companies)
5. RESEARCH METHODOLOGY
- 5.1. Report scope
- 5.2. Research methodology


