|
|
市場調査レポート
商品コード
1712523
スマートグラスの世界市場(2025年~2032年)Global Smart Glasses Market - 2025-2032 |
||||||
|
|
|||||||
カスタマイズ可能
適宜更新あり
|
|||||||


| スマートグラスの世界市場(2025年~2032年) |
|
出版日: 2025年04月22日
発行: DataM Intelligence
ページ情報: 英文 180 Pages
納期: 即日から翌営業日
|

- 全表示
- 概要
- 目次
世界のスマートグラスの市場規模は、2024年に9億2,522万米ドルに達し、2032年までに24億9,645万米ドルに達すると予測され、予測期間の2025年~2032年にCAGRで13.21%の成長が見込まれます。
スマートグラス市場は、AR、AI、ウェアラブルコンピューティングの技術革新に後押しされ、力強く拡大しています。リアルタイム診断やワークフロー支援に向けた製造やフィールドサービスへのARの統合により、展開がさらに加速しています。これらの開発は、業務、医療、産業環境における不可欠なツールとしてのスマートグラスへのシフトを強く示しています。
スマートグラス市場の動向
市場を形成している明確な動向は、没入型のハンズフリー体験を生み出すARとAIの融合です。米国の技術企業は、リアルタイムのデータ可視化と文脈に応じた音声対話を可能にするAI搭載スマートグラスを開発し、ハンドヘルドデバイスへの依存を減らしています。医療では、ARスマートグラスによって外科医が手術の途中で画像や患者情報にアクセスできるようになり、治療成績の向上とミスの減少が実現します。また、5Gによる接続性の強化により、これらのデバイスはリアルタイムコラボレーションツールへと変化しています。
市場力学
AIとリアルタイムデータ可視化の統合による産業/医療用途の強化
スマートグラスにおけるAIとリアルタイムのデータ可視化の統合は、産業部門と医療部門における業務効率を大幅に強化しています。産業部門では、Vuzix Corporationのような企業がVuzix Z100スマートグラスのようなデバイスを発表しており、作業者にリアルタイムの最新情報や合理化されたワークフローの確認を提供し、生産性を向上させます。
同様に医療では、AI機能を備えたスマートグラスが遠隔支援やリアルタイムのデータ共有に活用され、患者ケアや医学訓練の向上を促進しています。これらの進歩は、重要な情報へのハンズフリーアクセスを提供し、さまざまな産業にわたる複雑な作業を支援する能力によって、スマートグラスの採用が拡大していることを明示しています。
消費者への普及を制限するプライバシーへの懸念とデータセキュリティリスク
プライバシーへの懸念とデータセキュリティリスクが、スマートグラスの消費者への普及を大きく妨げています。例えば、European Data Protection Supervisorは、ユーザー/非ユーザーデータコントロールの欠如、侵入的な行動分析、適切な保護のない機密データの処理などの潜在的な問題を示しています。これらの懸念は、無許可の記録やデータ共有の可能性によってさらに悪化し、規制機関や公衆からの精査の強化につながっています。
当レポートでは、世界のスマートグラス市場について調査し、市場力学、地域とセグメントの分析、競合情勢、企業プロファイルなどを提供しています。
目次
第1章 調査手法と範囲
第2章 定義と概要
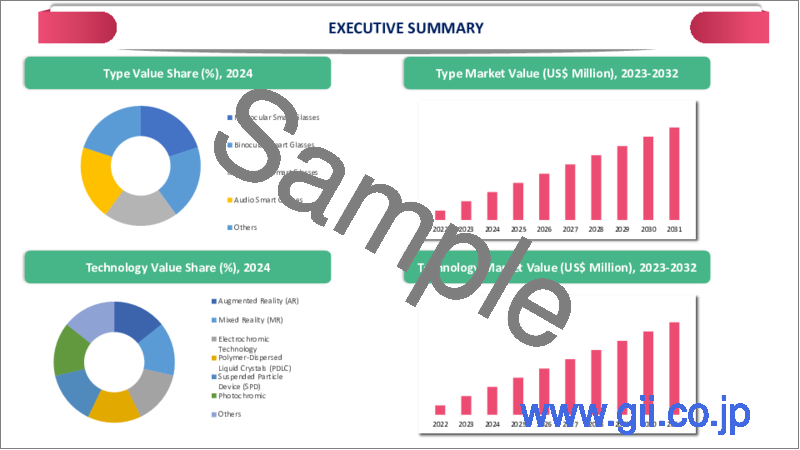
第3章 エグゼクティブサマリー
第4章 市場力学
- 影響要因
- 促進要因
- AIとリアルタイムデータ可視化の統合による産業/医療用途の強化
- 抑制要因
- 消費者への普及を制限するプライバシーへの懸念とデータセキュリティリスク
- 機会
- 影響の分析
- 促進要因
第5章 産業の分析
- ポーターのファイブフォース分析
- サプライチェーン分析
- 価格分析
- 規制分析
- 技術分析
- 産業動向の分析
- DMIの見解
第6章 タイプ別
- スタンドアロンスマートグラス
- テザードスマートグラス
- 一体型スマートグラス
第7章 技術別
- AR
- VR
- MR
- その他
第8章 操作方式別
- タッチパッド
- 音声命令
- ジェスチャー認識
- 遠隔操作
- その他
第9章 用途別
- 医療
- 工業
- 軍事・防衛
- 消費者・ライフスタイル
- スポーツ・フィットネス
- 教育・訓練
- その他
第10章 地域別
- 北米
- 米国
- カナダ
- メキシコ
- 欧州
- ドイツ
- 英国
- フランス
- イタリア
- スペイン
- その他の欧州
- 南米
- ブラジル
- アルゼンチン
- その他の南米
- アジア太平洋
- 中国
- インド
- 日本
- オーストラリア
- その他のアジア太平洋
- 中東・アフリカ
第11章 競合情勢
- 競合シナリオ
- 市場ポジショニング/シェア分析
- 合併と買収の分析
第12章 企業プロファイル
- Google LLC
- Microsoft Corporation
- Vuzix Corporation
- Magic Leap, Inc.
- Lenovo Group Limited
- Sony Group Corporation
- RealWear, Inc.
- Epson America, Inc.
- Meta Platforms, Inc.
- Samsung Electronics Co., Ltd.
第13章 付録
Global smart glasses market size reached US$ 925.22 million in 2024 and is expected to reach US$ 2,496.45 million by 2032, growing with a CAGR of 13.21% during the forecast period 2025-2032.
The smart glasses market is witnessing robust expansion, fueled by innovations in augmented reality (AR), artificial intelligence (AI), and wearable computing. The integration of AR in manufacturing and field services for real-time diagnostics and workflow support is further accelerating deployment. These developments underscore a shift toward smart glasses as essential tools in professional, medical, and industrial environments.
Smart Glasses Market Trend
A distinct trend shaping the market is the convergence of AR and AI to create immersive, hands-free experiences. US-based technology firms are developing AI-powered smart glasses that enable real-time data visualization and contextual voice interaction, reducing the reliance on handheld devices. In healthcare, AR smart glasses allow surgeons to access imaging and patient information mid-procedure, improving outcomes and reducing errors. Enhanced connectivity through 5G is also transforming these devices into real-time collaboration tools.
Market Dynamics
Integration of AI and Real-Time Data Visualization Enhancing Industrial and Healthcare Applications
The integration of Artificial Intelligence (AI) and real-time data visualization in smart glasses is significantly enhancing operational efficiency in the industrial and healthcare sectors. In the industrial domain, companies like Vuzix Corporation have introduced devices such as the Vuzix Z100 smart glasses, which provide workers with real-time updates and streamlined workflow confirmations, thereby improving productivity.
Similarly, in healthcare, smart glasses equipped with AI capabilities are being utilized for remote assistance and real-time data sharing, facilitating improved patient care and medical training. These advancements underscore the growing adoption of smart glasses, driven by their ability to deliver hands-free access to critical information and support complex tasks across various industries.
Privacy Concerns and Data Security Risks Limiting Widespread Consumer Adoption
Privacy concerns and data security risks are significantly hindering the widespread consumer adoption of smart glasses. For instance, the European Data Protection Supervisor has highlighted potential issues such as the lack of user and non-user data control, intrusive behavior analysis, and the processing of sensitive data without adequate safeguards. These concerns are further exacerbated by the potential for unauthorized recording and data sharing, leading to heightened scrutiny from regulatory bodies and the public.
Segment Analysis
The global smart glasses market is segmented based on type, technology, mode of control, application and region.
Augmented Reality Technology Driving Growth in the Smart Glasses Market
The integration of augmented reality (AR) technology is a core driver of smart glasses adoption across industrial, medical, and defense applications. In the US, agencies such as the Department of Defense are actively deploying AR-enhanced wearables to improve battlefield awareness, mission planning, and real-time data interpretation. Meanwhile, the US Department of Veterans Affairs has implemented AR tools in medical training simulations, showing how government support is bolstering real-world use cases.
In the healthcare space, AR-enabled smart glasses are being adopted for real-time assistance in surgeries, diagnostics, and telemedicine. For instance, AR overlays during surgery allow physicians to access imaging data and patient vitals without diverting attention from the procedure. This aligns with broader efforts by the National Institutes of Health (NIH) to support wearable innovations that enhance patient outcomes.
Geographical Penetration
Rising Institutional Adoption and Industrial Integration Fueling Smart Glass Demand in North America
The demand for smart glasses in North America is accelerating due to the growing implementation of augmented reality (AR) and wearable technology across key sectors such as healthcare, logistics, and advanced manufacturing. The use cases present in the region illustrate how government-backed innovation is supporting the deployment of smart glasses for real-time data visualization, remote assistance, and hands-free operation in complex environments.
Canada is also embracing smart glasses technology in its industrial and education sectors, supported by national innovation programs that prioritize digital transformation and workforce modernization. For example, smart glasses are increasingly used in remote technical support and skill-based training, reducing operational costs and improving safety. The combination of institutional support, rising consumer awareness, and the region's leadership in technology adoption continues to fuel demand across both enterprise and public service applications in North America.
Technology Analysis
The technological landscape of the smart glasses market is rapidly evolving, driven by advancements in augmented reality (AR), artificial intelligence (AI), and connectivity. Modern smart glasses integrate high-resolution displays, AI-powered voice assistants, and real-time data processing capabilities, enhancing user experiences across various sectors.
The incorporation of 5G technology further enhances the functionality of smart glasses by enabling faster data transmission and low-latency communication, which is crucial for applications requiring real-time feedback. These technological strides are positioning smart glasses as pivotal tools in both professional and consumer domains, reflecting a significant shift towards more immersive and interactive digital experiences.
Competitive Landscape
The major global players in the market include Google LLC, Microsoft Corporation, Vuzix Corporation, Magic Leap, Inc., Lenovo Group Limited, Sony Group Corporation, RealWear, Inc., Epson America, Inc., Meta Platforms, Inc., and Samsung Electronics Co., Ltd.
Key Developments
- In March 2025, Samsung reported that it is working on a new pair of XR smart glasses, set to launch alongside its upcoming XR headset under Project Moohan. According to ETNews, the device is being developed under the codename "Project HAEAN." While the exact purpose and functionality are still being finalized, the smart glasses are expected to feature Galaxy AI, similar to the XR headset.
- In April 2025, Meta announced the launch of a new version of its Ray Ban Meta smart glasses later this year (2025), though not the fully AR-enabled device that it still has in development.
Why Choose DataM?
- Data-Driven Insights: Dive into detailed analyses with granular insights such as pricing, market shares and value chain evaluations, enriched by interviews with industry leaders and disruptors.
- Post-Purchase Support and Expert Analyst Consultations: As a valued client, gain direct access to our expert analysts for personalized advice and strategic guidance, tailored to your specific needs and challenges.
- White Papers and Case Studies: Benefit quarterly from our in-depth studies related to your purchased titles, tailored to refine your operational and marketing strategies for maximum impact.
- Annual Updates on Purchased Reports: As an existing customer, enjoy the privilege of annual updates to your reports, ensuring you stay abreast of the latest market insights and technological advancements. Terms and conditions apply.
- Specialized Focus on Emerging Markets: DataM differentiates itself by delivering in-depth, specialized insights specifically for emerging markets, rather than offering generalized geographic overviews. This approach equips our clients with a nuanced understanding and actionable intelligence that are essential for navigating and succeeding in high-growth regions.
- Value of DataM Reports: Our reports offer specialized insights tailored to the latest trends and specific business inquiries. This personalized approach provides a deeper, strategic perspective, ensuring you receive the precise information necessary to make informed decisions. These insights complement and go beyond what is typically available in generic databases.
Target Audience 2024
- Manufacturers/ Buyers
- Industry Investors/Investment Bankers
- Research Professionals
- Emerging Companies
Table of Contents
1. Methodology and Scope
- 1.1. Research Methodology
- 1.2. Research Objective and Scope of the Report
2. Definition and Overview
3. Executive Summary
- 3.1. Snippet by Type
- 3.2. Snippet by Technology
- 3.3. Snippet by Mode of Control
- 3.4. Snippet by Application
- 3.5. Snippet by Region
4. Dynamics
- 4.1. Impacting Factors
- 4.1.1. Drivers
- 4.1.1.1. Integration of AI and Real-Time Data Visualization Enhancing Industrial and Healthcare Applications
- 4.1.2. Restraints
- 4.1.2.1. Privacy Concerns and Data Security Risks Limiting Widespread Consumer Adoption
- 4.1.3. Opportunity
- 4.1.4. Impact Analysis
- 4.1.1. Drivers
5. Industry Analysis
- 5.1. Porter's Five Force Analysis
- 5.2. Supply Chain Analysis
- 5.3. Pricing Analysis
- 5.4. Regulatory Analysis
- 5.5. Technology Analysis
- 5.6. Industry Trend Analysis
- 5.7. DMI Opinion
6. By Type
- 6.1. Introduction
- 6.1.1. Market Size Analysis and Y-o-Y Growth Analysis (%), By Type
- 6.1.2. Market Attractiveness Index, By Type
- 6.2. Standalone Smart Glasses *
- 6.2.1. Introduction
- 6.2.2. Market Size Analysis and Y-o-Y Growth Analysis (%)
- 6.3. Tethered Smart Glasses
- 6.4. Integrated Smart Glasses
7. By Technology
- 7.1. Introduction
- 7.1.1. Market Size Analysis and Y-o-Y Growth Analysis (%), By Technology
- 7.1.2. Market Attractiveness Index, By Technology
- 7.2. Augmented Reality (AR)*
- 7.2.1. Introduction
- 7.2.2. Market Size Analysis and Y-o-Y Growth Analysis (%)
- 7.3. Virtual Reality (VR)
- 7.4. Mixed Reality (MR)
- 7.5. Others
8. By Mode of Control
- 8.1. Introduction
- 8.1.1. Market Size Analysis and Y-o-Y Growth Analysis (%), By Mode of Control
- 8.1.2. Market Attractiveness Index, By Mode of Control
- 8.2. Touchpad*
- 8.2.1. Introduction
- 8.2.2. Market Size Analysis and Y-o-Y Growth Analysis (%)
- 8.3. Voice Command
- 8.4. Gesture Recognition
- 8.5. Remote Control
- 8.6. Others
9. By Application
- 9.1. Introduction
- 9.1.1. Market Size Analysis and Y-o-Y Growth Analysis (%), By Application
- 9.1.2. Market Attractiveness Index, By Application
- 9.2. Healthcare*
- 9.2.1. Introduction
- 9.2.2. Market Size Analysis and Y-o-Y Growth Analysis (%)
- 9.3. Industrial
- 9.4. Military & Defense
- 9.5. Consumer & Lifestyle
- 9.6. Sports & Fitness
- 9.7. Education & Training
- 9.8. Others
10. By Region
- 10.1. Introduction
- 10.1.1. Market Size Analysis and Y-o-Y Growth Analysis (%), By Region
- 10.1.2. Market Attractiveness Index, By Region
- 10.2. North America
- 10.2.1. Introduction
- 10.2.2. Key Region-Specific Dynamics
- 10.2.3. Market Size Analysis and Y-o-Y Growth Analysis (%), By Type
- 10.2.4. Market Size Analysis and Y-o-Y Growth Analysis (%), By Technology
- 10.2.5. Market Size Analysis and Y-o-Y Growth Analysis (%), By Mode of Control
- 10.2.6. Market Size Analysis and Y-o-Y Growth Analysis (%), By Application
- 10.2.7. Market Size Analysis and Y-o-Y Growth Analysis (%), By Country
- 10.2.7.1. US
- 10.2.7.2. Canada
- 10.2.7.3. Mexico
- 10.3. Europe
- 10.3.1. Introduction
- 10.3.2. Key Region-Specific Dynamics
- 10.3.3. Market Size Analysis and Y-o-Y Growth Analysis (%), By Type
- 10.3.4. Market Size Analysis and Y-o-Y Growth Analysis (%), By Technology
- 10.3.5. Market Size Analysis and Y-o-Y Growth Analysis (%), By Mode of Control
- 10.3.6. Market Size Analysis and Y-o-Y Growth Analysis (%), By Application
- 10.3.7. Market Size Analysis and Y-o-Y Growth Analysis (%), By Country
- 10.3.7.1. Germany
- 10.3.7.2. UK
- 10.3.7.3. France
- 10.3.7.4. Italy
- 10.3.7.5. Spain
- 10.3.7.6. Rest of Europe
- 10.4. South America
- 10.4.1. Introduction
- 10.4.2. Key Region-Specific Dynamics
- 10.4.3. Market Size Analysis and Y-o-Y Growth Analysis (%), By Type
- 10.4.4. Market Size Analysis and Y-o-Y Growth Analysis (%), By Technology
- 10.4.5. Market Size Analysis and Y-o-Y Growth Analysis (%), By Mode of Control
- 10.4.6. Market Size Analysis and Y-o-Y Growth Analysis (%), By Application
- 10.4.7. Market Size Analysis and Y-o-Y Growth Analysis (%), By Country
- 10.4.7.1. Brazil
- 10.4.7.2. Argentina
- 10.4.7.3. Rest of South America
- 10.5. Asia-Pacific
- 10.5.1. Introduction
- 10.5.2. Key Region-Specific Dynamics
- 10.5.3. Market Size Analysis and Y-o-Y Growth Analysis (%), By Type
- 10.5.4. Market Size Analysis and Y-o-Y Growth Analysis (%), By Technology
- 10.5.5. Market Size Analysis and Y-o-Y Growth Analysis (%), By Mode of Control
- 10.5.6. Market Size Analysis and Y-o-Y Growth Analysis (%), By Application
- 10.5.7. Market Size Analysis and Y-o-Y Growth Analysis (%), By Country
- 10.5.7.1. China
- 10.5.7.2. India
- 10.5.7.3. Japan
- 10.5.7.4. Australia
- 10.5.7.5. Rest of Asia-Pacific
- 10.6. Middle East and Africa
- 10.6.1. Introduction
- 10.6.2. Key Region-Specific Dynamics
- 10.6.3. Market Size Analysis and Y-o-Y Growth Analysis (%), By Type
- 10.6.4. Market Size Analysis and Y-o-Y Growth Analysis (%), By Technology
- 10.6.5. Market Size Analysis and Y-o-Y Growth Analysis (%), By Mode of Control
- 10.6.6. Market Size Analysis and Y-o-Y Growth Analysis (%), By Application
11. Competitive Landscape
- 11.1. Competitive Scenario
- 11.2. Market Positioning/Share Analysis
- 11.3. Mergers and Acquisitions Analysis
12. Company Profiles
- 12.1. Google LLC*
- 12.1.1. Company Overview
- 12.1.2. Type Portfolio and Description
- 12.1.3. Financial Overview
- 12.1.4. Key Developments
- 12.2. Microsoft Corporation
- 12.3. Vuzix Corporation
- 12.4. Magic Leap, Inc.
- 12.5. Lenovo Group Limited
- 12.6. Sony Group Corporation
- 12.7. RealWear, Inc.
- 12.8. Epson America, Inc.
- 12.9. Meta Platforms, Inc.
- 12.10. Samsung Electronics Co., Ltd.
LIST NOT EXHAUSTIVE
13. Appendix
- 13.1. About Us and Services
- 13.2. Contact Us
