|
|
市場調査レポート
商品コード
1347995
世界のOTTテレビ・ビデオ予測市場-2023年~2030年Global OTT TV and Video Forecasts Market - 2023-2030 |
||||||
|
|
|||||||
カスタマイズ可能
適宜更新あり
|
|||||||


| 世界のOTTテレビ・ビデオ予測市場-2023年~2030年 |
|
出版日: 2023年09月11日
発行: DataM Intelligence
ページ情報: 英文 212 Pages
納期: 即日から翌営業日
|

- 全表示
- 概要
- 目次
概要
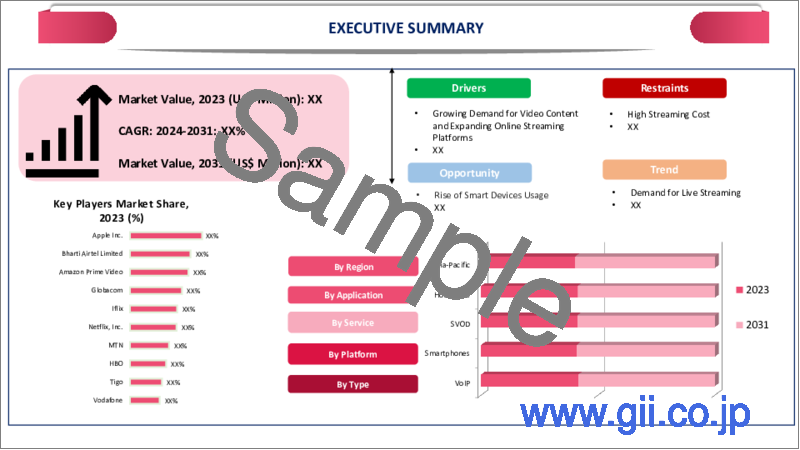
世界のOTTテレビ・ビデオ予測市場は、2022年に1,542億米ドルに達し、2023年から2030年にかけてCAGR 7.9%で成長し、2030年には2,311億米ドルに達すると予測されています。
全国で高速インターネット接続が利用可能になったことで、より多くの消費者がOTTコンテンツにアクセスし、動画予測を可視化できるようになっています。インターネットの接続性が向上するにつれ、より多くのユーザーがネットワークの問題やバッファリングの問題なしに動画コンテンツをストリーミングできるようになっています。enterpriseappsによると、インドでは、上位5つの地下鉄駅に居住するユーザーが55%います。2022年末には、OTTプラットフォームへのユーザーの関与は28.2%に達し、2027年末には36%まで増加します。
北米は、世界のOTTテレビ・ビデオ予測市場の1/3以上を占める成長地域のひとつです。この地域はインターネットの普及率が最も高く、消費者がOTTコンテンツをシームレスにストリーミングする需要が高まっています。消費者は、自分の都合に合わせて視聴できるオンデマンド・コンテンツを選びます。Amazon Fire TVやApple TVのようなスマートTVやコネクテッドデバイスの普及により、消費者はOTTプラットフォームへのアクセスが容易になっています。
ダイナミクス
動画コンテンツの需要増加
現代の視聴者は、エンターテインメントの選択に柔軟性と利便性を求めています。OTTプラットフォームにより、視聴者は従来のTVスケジュールに縛られることなく、自分のスケジュールで多種多様な動画コンテンツにアクセスすることができます。OTTプラットフォームは地理的な制約を受けることなく世界中の視聴者にリーチできるため、コンテンツ制作者は多様な市場や層をターゲットにすることができます。
例えば、2023年8月2日、NASAはNASA+と呼ばれる新しいストリーミング・プラットフォームを発表しました。従来のケーブルテレビとは異なり、NASA+はNetflixのようなサービスと同様のオンデマンド・ストリーミングを提供し、視聴者は見たいものを選ぶことができます。この動きは、視聴者の嗜好の変化に適応し、技術に精通した視聴者に対応しようとするNASAの努力を反映しています。
オンラインストリーミングプラットフォームの台頭
オンデマンドコンテンツへの需要の高まりは、視聴者の便宜を図っています。オンライン・ストリーミング・プラットフォームは、スマートフォン、タブレット、スマートテレビなど様々なデバイスに簡単にアクセスでき、消費者は好きな番組を見ることができます。オンラインストリーミングプラットフォームは世界にアクセスできるため、コンテンツ制作者はローカル市場を超えて視聴者にリーチすることができ、この世界なリーチはコンテンツ制作者とプラットフォーム双方にとって収益の可能性を拡大します。
例えば、2022年11月27日、ワールド・アーチェリーは、テクノロジー企業StreamViralと提携し、2023年初頭に「archery+」と呼ばれるオンラインストリーミングプラットフォームを立ち上げます。このプラットフォームは、ワールドアーチェリーの既存の権利契約ではカバーされていない地域の視聴者に向けて、国際的なアーチェリーイベントを放送することを目的としています。このプラットフォームでは、現代アーチェリー・ワールドカップ、現代世界アーチェリー選手権大会、2024年パリ・オリンピック予選、世界ランキング2位決定戦などの主要イベントを放送する予定です。
技術進歩
ブロードバンドや5Gネットワークなどの高速インターネット接続が利用可能になったことで、ユーザーのストリーミング品質と体験が大幅に向上しました。高速インターネットは、高画質、さらには4Kコンテンツのシームレスな再生を可能にし、視聴者の獲得と維持に欠かせません。AI主導の推薦アルゴリズムは、ユーザーの行動や嗜好を分析し、パーソナライズされたコンテンツ推薦を提供します。
例えば、2022年4月27日、Max Velocityは、放送業界を変革するために設計されたブラウザベース動画ストーリーテリングツールです。これは、メディアクライアントがあらゆる環境から高品質のデジタルコンテンツを効率的に作成することを可能にし、プラットフォーム間でのコンテンツ公開を容易にします。Max Alert Liveは、The Weather Companyのアラート・プラットフォームに追加された最新のもので、このソリューションは、破壊的な気象現象を通知することにより、視聴者に情報を提供し、安全を確保するよう設計されています。
多額のストリーミング費用
高速インターネットインフラの可用性は地域によって異なり、インターネットへのアクセスが限られている地域では、ユーザーが高品質のコンテンツをストリーミングする際に多くの困難に直面し、市場の成長を妨げています。動画コンテンツのストリーミングは大量のデータを消費するため、データ使用量が多くなり、プランのコストが高くなります。
すべてのデバイスがすべてのOTTプラットフォームに対応しているわけではありません。ユーザーは、好みのデバイスで特定のプラットフォームにアクセスする際に制限に直面する可能性があり、全体的な視聴体験に影響を与えます。コンテンツ、データ保護、ネット中立性に関する規制の枠組みは、地域によってOTTサービスの運営方法に影響を与える可能性があります。さまざまな規制を遵守することは、複雑でコストがかかる可能性があります。
目次
第1章 調査手法と調査範囲
第2章 定義と概要
第3章 エグゼクティブサマリー
第4章 市場力学
- 影響要因
- 促進要因
- 動画コンテンツの需要増加
- オンラインストリーミングプラットフォームの台頭
- 技術進歩
- 抑制要因
- 多額のストリーミング費用
- 機会
- 影響分析
- 促進要因
第5章 産業分析
- ポーターのファイブフォース分析
- サプライチェーン分析
- 価格分析
- 規制分析
- ロシア・ウクライナ戦争の影響分析
- DMIの見解
第6章 COVID-19分析
第7章 タイプ別
- VoIP
- テキスト・画像
- 動画
第8章 プラットフォーム別
- スマートフォン
- スマートTV
- ラップトップ/デスクトップ
- ゲーム機
- その他
第9章 サービス別
- SVOD
- AVOD
- TVOD
- ライブストリーミング
第10章 用途別
- 家庭用
- 業務用
- 教育用
- 政府機関
- その他
第11章 地域別
- 北米
- 米国
- カナダ
- メキシコ
- 欧州
- ドイツ
- 英国
- フランス
- イタリア
- ロシア
- その他欧州
- 南米
- ブラジル
- アルゼンチン
- その他南米
- アジア太平洋
- 中国
- インド
- 日本
- オーストラリア
- その他アジア太平洋
- 中東・アフリカ
第12章 競合情勢
- 競合シナリオ
- 市況/シェア分析
- M&A分析
第13章 企業プロファイル
- Apple
- 会社概要
- 製品ポートフォリオと説明
- 財務概要
- 主な動向
- Airtel
- Amazon Prime
- Globacom
- Iflix
- Netflix
- MTN
- HBO
- Tigo
- Vodafone
第14章 付録
Overview
Global OTT TV and Video Forecasts Market reached US$ 154.2 billion in 2022 and is expected to reach US$ 231.1 billion by 2030, growing with a CAGR of 7.9% during the forecast period 2023-2030.
The availability of high-speed internet connectivity across the nation has enabled more consumers to access OTT content and visualize video forecasts. As internet connectivity improves, more users are able to stream video content without any network issue or buffering issues. According to enterpriseapps, in India there is 55% of users that resides over top 5 metro stations. In the end of 2022 the user involvement is 28.2% of the OTT platform which will increase upto 36% at the end of 2027.
North America is among the growing regions in the global OTT TV and video forecasts market covering more than 1/3rd of the market. The region has the highest penetration level of the internet, which increases demand for consumers to stream OTT content seamlessly. Consumers choose on-demand content which they can watch at their own convenience. The growing adoption of smart TVs and connected devices such as Amazon Fire TV and Apple TV made it easier for consumers to access OTT platforms.
Dynamics
Increasing Demand for Video Content
Modern audiences prefer flexibility and convenience in their entertainment choices. OTT platforms allow viewers to access a wide variety of video content on their own schedule, without the limitations of traditional TV schedules. OTT platforms can reach a global audience without the limitations of geographical boundaries and this enables content creators to target diverse markets and demographics.
For instance, on 02 August 2023, NASA introduced a new streaming platform called NASA + , aiming to provide accessible and engaging space-related content to the public. Unlike traditional cable TV NASA + offers on-demand streaming similar to services like Netflix, allowing viewers to choose what they want to watch and this move reflects NASA's effort to adapt to changing viewer preferences and cater to a tech-savvy audience.
Rising Online Streaming Platform
The growing demand for on-demand content viewers access their convenience. Online platforms provides easy access to various devices that includes smartphones, tablets and smart Tvs. As consumers can view there favorite shows and some platforms offers ad-free channels which can access globally. Online streaming platforms can be accessed globally, allowing content creators to reach audiences beyond their local markets and this global reach expands revenue potential for both content creators and platforms.
For instance, on 27 November 2022, World Archery is partnering with technology company StreamViral to launch an online streaming platform called "archery + " in early 2023. The platform aims to broadcast international archery events to audiences in regions not covered by World Archery's existing rights deals. It will feature major events such as the Hyundai Archery World Cup, the Hyundai World Archery Championships, qualifiers for the Paris 2024 Olympic Games and second-tier world ranking tournaments.
Technology Advancement
The availability of high-speed internet connections like broadband and 5G networks, significantly improved the streaming quality and experience for users. High-speed internet enables seamless playback of high-definition and even 4K content, which is crucial for attracting and retaining viewers. AI-driven recommendation algorithms analyze user behavior and preferences to provide personalized content recommendations.
For instance, on 27 April 2022, Max Velocity was a browser-based video storytelling tool designed to transform the broadcast industry. It enables media clients to efficiently create high-quality digital content from any environment, making it easier to publish content across platforms. Max Alert Live is the latest addition to The Weather Company's alerting platform and this solution is designed to keep audiences informed and safe by notifying them of disruptive weather events.
High Streaming Cost
The availability of high-speed internet infrastructure varies from region to region and the areas where limited access to the internet is there users face many difficulties in streaming the high-quality content that hinder the growth of the market. Streaming video content consumes a significant amount of data that leads to have higher use of data which increases the cost of the plans.
Not all devices are compatible with every OTT platform. Users might face limitations in accessing certain platforms on their preferred devices, affecting their overall viewing experience. Regulatory frameworks around content, data protection and net neutrality can impact how OTT services operate in different regions. Compliance with varying regulations can be complex and costly.
Segment Analysis
The global OTT TV and video forecasts market is segmented based type, platform, service, application and region.
Rising Adoption of VoIP Platform
VoIP is expected to hold a significant share of around 1/3rd of the global market in 2022. VoIP services typically offer lower costs for voice communication compared to traditional telephony. As OTT platforms continue to gain popularity for video content, users might also be attracted to the cost savings of using VoIP for voice communication. Integrating VoIP into the OTT platforms can offer a convenient and seamless experience for users, allowing them to access both video content and voice communication from a single app or platform.
For instance, on 14 October 2022, ONEDigital, the media and communications vertical of the global Hinduja Group, introduced its integrated offering called "ONEDigital" and this comprehensive solution provides customers with a range of digital services, including broadband, digital TV, OTT content, Voice over Internet Protocol (VoIP)/Intercom, home and building WiFi, as well as CCTV solutions.
Geographical Penetration
Rising Internet Penetration and Digitalization in Asia-Pacific
Asia-Pacific is expected to be the fastest growing region in the global OTT TV and video forecasts market covering about 1/4th of the market. The region has witnessed a significant increase in internet penetration, driven by expanding connectivity in both urban and rural areas and this widespread access to high-speed internet enables consumers to stream OTT content seamlessly. Urbanization and increased urban lifestyles drive demand for entertainment options accessible through mobile devices.
For instance, on 29 August 2023, TV9 Network, India's largest news network, is once again disrupting the industry with the launch of News9 Mediaverse, India's first fully integrated digital-first English news brand and this revolutionary move combines three components: News9 Plus, the world's first news OTT News9 Live, India's only 24/7 digital exclusive news stream and News9Live.com, a rapidly growing English text platform.
Competitive Landscape
The major global players in the market include: Apple, Airtel, Amazon Prime, Globacom, Iflix, Netflix, MTN, HBO, Tigo and Vodafone.
COVID-19 Impact Analysis
OTT platforms with a global presence benefitted from their ability to reach audiences in different regions simultaneously, this global reach was advantageous as different regions experienced lockdowns and restrictions at various times. While OTT platforms focused on delivering content, there were challenges in content production due to restrictions on filming and social distancing measures and this led to delays in the release of some content and a shift in content release schedules.
Some OTT platforms adopted hybrid release strategies, combining theatrical releases with digital premieres and this approach allowed them to cater to different audience preferences and maximize revenue. While the pandemic initially disrupted production schedules, many OTT platforms quickly adapted by investing in the creation of original content, this not only ensured a steady stream of new content but also allowed platforms to differentiate themselves and attract subscribers.
AI Impact
AI-powered recommendation engines analyze user preferences, viewing history and behavior to provide personalized content suggestions and this enhances user engagement by ensuring that viewers are presented with content that aligns with their interests, increasing the likelihood of longer viewing sessions and reduced churn rates. AI algorithms enable improved content discovery by categorizing and tagging content based on its themes, genres and metadata.
AI-driven ad insertion helps tailor advertisements to individual viewers based on their demographics, interests and online behavior and this enhances the ad viewing experience by presenting more relevant and engaging ads, leading to more click-through rates and ad revenue. AI-powered video analytics provide valuable insights into viewer behavior, such as engagement patterns, drop-off points and content preferences, this data helps content creators and providers make informed decisions about content production, licensing and marketing strategies.
For instance, on 16 August 2023, Sabio Holdings Inc., a prominent provider of connected TV (CTV) and over-the-top (OTT) advertising platforms, announced a new AI feature within its App Science Insights analytics dashboard and this feature utilizes Natural Language Processing to automate the analysis of metrics within the dashboard, facilitating easier data interpretation for media agencies and brands.
Russia- Ukraine War Impact
The conflict may lead to disruptions in content availability and distribution. Depending on the severity of the conflict and related sanctions, content creators, distributors and platforms operating in the affected regions might face challenges in delivering content to audiences, potentially affecting the variety and availability of content on OTT platforms. The conflict may impact consumer behavior and preferences in the regions directly affected by the crisis.
Advertisers might reevaluate their advertising strategies and budgets in light of the geopolitical situation. Advertisers may choose to reallocate budgets to target specific regions or demographic segments, impacting the revenue streams for OTT platforms that rely on advertising as a revenue source region where the conflict is more intense, there could be disruptions in internet infrastructure and connectivity.
By Type
- VoIP
- Text & Image
- Video
By Platform
- Smartphones
- Smart TVs
- Laptops/Desktops
- Gaming
- Others
By Service
- SVOD
- AVOD
- TVOD
- Live Streaming
By Application
- Household
- Commercial
- Educational
- Government
- Others
By Region
- North America
- U.S.
- Canada
- Mexico
- Europe
- Germany
- UK
- France
- Italy
- Russia
- Rest of Europe
- South America
- Brazil
- Argentina
- Rest of South America
- Asia-Pacific
- China
- India
- Japan
- Australia
- Rest of Asia-Pacific
- Middle East and Africa
Key Developments
- On 27 July 2023, Indian startup Excitel introduced a new home internet plan named the 'Cable Cutter' plan, aimed at enhancing the home entertainment experience for its customers. The plan offers impressive speeds of up to 400 Mbps and includes 12 over-the-top (OTT) channels, featuring a selection of over 550 Live TV channels.
- On 30 August 2022, Sports betting company FanDuel Group is launching a new linear TV network and a standalone OTT platform in September. FanDuel TV and FanDuel + will become the first linear/digital network dedicated to sports wagering content. The content includes more than 3,000 hours of live sports, with well-known pundits hosting programming to engage sports fans and integrate with FanDuel's mobile app.
- On 25 August 2023, World Rugby is introducing its own free-to-air streaming platform called RugbyPass TV, which will provide international rugby matches to global fans. The OTT platform, powered by Endeavor Streaming, is set to launch with the Rugby World Cup 2023 on September 8. RugbyPass TV will cover both men's and women's tournaments, offering more than 1,000 hours of historic matches and behind-the-scenes content.
Why Purchase the Report?
- To visualize the global OTT TV and video forecasts market segmentation based on type, platform, service, application and region, as well as understand key commercial assets and players.
- Identify commercial opportunities by analyzing trends and co-development.
- Excel data sheet with numerous data points of OTT TV and video forecasts market-level with all segments.
- PDF report consists of a comprehensive analysis after exhaustive qualitative interviews and an in-depth study.
- Product mapping available as excel consisting of key products of all the major players.
The global OTT TV and video forecasts market report would provide approximately 69 tables, 72 figures and 212 pages.
Target Audience 2023
- Manufacturers/ Buyers
- Industry Investors/Investment Bankers
- Research Professionals
- Emerging Companies
Table of Contents
1. Methodology and Scope
- 1.1. Research Methodology
- 1.2. Research Objective and Scope of the Report
2. Definition and Overview
3. Executive Summary
- 3.1. Snippet by Type
- 3.2. Snippet by Platform
- 3.3. Snippet by Service
- 3.4. Snippet by Application
- 3.5. Snippet by Region
4. Dynamics
- 4.1. Impacting Factors
- 4.1.1. Drivers
- 4.1.1.1. Increasing Demand for Video Content
- 4.1.1.2. Rising Online Streaming Platform
- 4.1.1.3. Technology Advancement
- 4.1.2. Restraints
- 4.1.2.1. High Streaming Cost
- 4.1.3. Opportunity
- 4.1.4. Impact Analysis
- 4.1.1. Drivers
5. Industry Analysis
- 5.1. Porter's Five Force Analysis
- 5.2. Supply Chain Analysis
- 5.3. Pricing Analysis
- 5.4. Regulatory Analysis
- 5.5. Russia-Ukraine War Impact Analysis
- 5.6. DMI Opinion
6. COVID-19 Analysis
- 6.1. Analysis of COVID-19
- 6.1.1. Scenario Before COVID
- 6.1.2. Scenario During COVID
- 6.1.3. Scenario Post COVID
- 6.2. Pricing Dynamics Amid COVID-19
- 6.3. Demand-Supply Spectrum
- 6.4. Government Initiatives Related to the Market During Pandemic
- 6.5. Manufacturers Strategic Initiatives
- 6.6. Conclusion
7. By Type
- 7.1. Introduction
- 7.1.1. Market Size Analysis and Y-o-Y Growth Analysis (%), By Type
- 7.1.2. Market Attractiveness Index, By Type
- 7.2. VoIP*
- 7.2.1. Introduction
- 7.2.2. Market Size Analysis and Y-o-Y Growth Analysis (%)
- 7.3. Text & Image
- 7.4. Video
8. By Platform
- 8.1. Introduction
- 8.1.1. Market Size Analysis and Y-o-Y Growth Analysis (%), By Platform
- 8.1.2. Market Attractiveness Index, By Platform
- 8.2. Smartphones*
- 8.2.1. Introduction
- 8.2.2. Market Size Analysis and Y-o-Y Growth Analysis (%)
- 8.3. Smart TVs
- 8.4. Laptops/Desktops
- 8.5. Gaming
- 8.6. Others
9. By Service
- 9.1. Introduction
- 9.1.1. Market Size Analysis and Y-o-Y Growth Analysis (%), By Service
- 9.1.2. Market Attractiveness Index, By Service
- 9.2. SVOD*
- 9.2.1. Introduction
- 9.2.2. Market Size Analysis and Y-o-Y Growth Analysis (%)
- 9.3. AVOD
- 9.4. TVOD
- 9.5. Live Streaming
10. By Application
- 10.1. Introduction
- 10.1.1. Market Size Analysis and Y-o-Y Growth Analysis (%), By Application
- 10.1.2. Market Attractiveness Index, By Application
- 10.2. Household*
- 10.2.1. Introduction
- 10.2.2. Market Size Analysis and Y-o-Y Growth Analysis (%)
- 10.3. Commercial
- 10.4. Educational
- 10.5. Government
- 10.6. Others
11. By Region
- 11.1. Introduction
- 11.1.1. Market Size Analysis and Y-o-Y Growth Analysis (%), By Region
- 11.1.2. Market Attractiveness Index, By Region
- 11.2. North America
- 11.2.1. Introduction
- 11.2.2. Key Region-Specific Dynamics
- 11.2.3. Market Size Analysis and Y-o-Y Growth Analysis (%), By Type
- 11.2.4. Market Size Analysis and Y-o-Y Growth Analysis (%), By Platform
- 11.2.5. Market Size Analysis and Y-o-Y Growth Analysis (%), By Service
- 11.2.6. Market Size Analysis and Y-o-Y Growth Analysis (%), By Application
- 11.2.7. Market Size Analysis and Y-o-Y Growth Analysis (%), By Country
- 11.2.7.1. U.S.
- 11.2.7.2. Canada
- 11.2.7.3. Mexico
- 11.3. Europe
- 11.3.1. Introduction
- 11.3.2. Key Region-Specific Dynamics
- 11.3.3. Market Size Analysis and Y-o-Y Growth Analysis (%), By Type
- 11.3.4. Market Size Analysis and Y-o-Y Growth Analysis (%), By Platform
- 11.3.5. Market Size Analysis and Y-o-Y Growth Analysis (%), By Service
- 11.3.6. Market Size Analysis and Y-o-Y Growth Analysis (%), By Application
- 11.3.7. Market Size Analysis and Y-o-Y Growth Analysis (%), By Country
- 11.3.7.1. Germany
- 11.3.7.2. UK
- 11.3.7.3. France
- 11.3.7.4. Italy
- 11.3.7.5. Russia
- 11.3.7.6. Rest of Europe
- 11.4. South America
- 11.4.1. Introduction
- 11.4.2. Key Region-Specific Dynamics
- 11.4.3. Market Size Analysis and Y-o-Y Growth Analysis (%), By Type
- 11.4.4. Market Size Analysis and Y-o-Y Growth Analysis (%), By Platform
- 11.4.5. Market Size Analysis and Y-o-Y Growth Analysis (%), By Service
- 11.4.6. Market Size Analysis and Y-o-Y Growth Analysis (%), By Application
- 11.4.7. Market Size Analysis and Y-o-Y Growth Analysis (%), By Country
- 11.4.7.1. Brazil
- 11.4.7.2. Argentina
- 11.4.7.3. Rest of South America
- 11.5. Asia-Pacific
- 11.5.1. Introduction
- 11.5.2. Key Region-Specific Dynamics
- 11.5.3. Market Size Analysis and Y-o-Y Growth Analysis (%), By Type
- 11.5.4. Market Size Analysis and Y-o-Y Growth Analysis (%), By Platform
- 11.5.5. Market Size Analysis and Y-o-Y Growth Analysis (%), By Service
- 11.5.6. Market Size Analysis and Y-o-Y Growth Analysis (%), By Application
- 11.5.7. Market Size Analysis and Y-o-Y Growth Analysis (%), By Country
- 11.5.7.1. China
- 11.5.7.2. India
- 11.5.7.3. Japan
- 11.5.7.4. Australia
- 11.5.7.5. Rest of Asia-Pacific
- 11.6. Middle East and Africa
- 11.6.1. Introduction
- 11.6.2. Key Region-Specific Dynamics
- 11.6.3. Market Size Analysis and Y-o-Y Growth Analysis (%), By Type
- 11.6.4. Market Size Analysis and Y-o-Y Growth Analysis (%), By Platform
- 11.6.5. Market Size Analysis and Y-o-Y Growth Analysis (%), By Service
- 11.6.6. Market Size Analysis and Y-o-Y Growth Analysis (%), By Application
12. Competitive Landscape
- 12.1. Competitive Scenario
- 12.2. Market Positioning/Share Analysis
- 12.3. Mergers and Acquisitions Analysis
13. Company Profiles
- 13.1. Apple*
- 13.1.1. Company Overview
- 13.1.2. Product Portfolio and Description
- 13.1.3. Financial Overview
- 13.1.4. Key Developments
- 13.2. Airtel
- 13.3. Amazon Prime
- 13.4. Globacom
- 13.5. Iflix
- 13.6. Netflix
- 13.7. MTN
- 13.8. HBO
- 13.9. Tigo
- 13.10. Vodafone
LIST NOT EXHAUSTIVE
14. Appendix
- 14.1. About Us and Services
- 14.2. Contact Us
